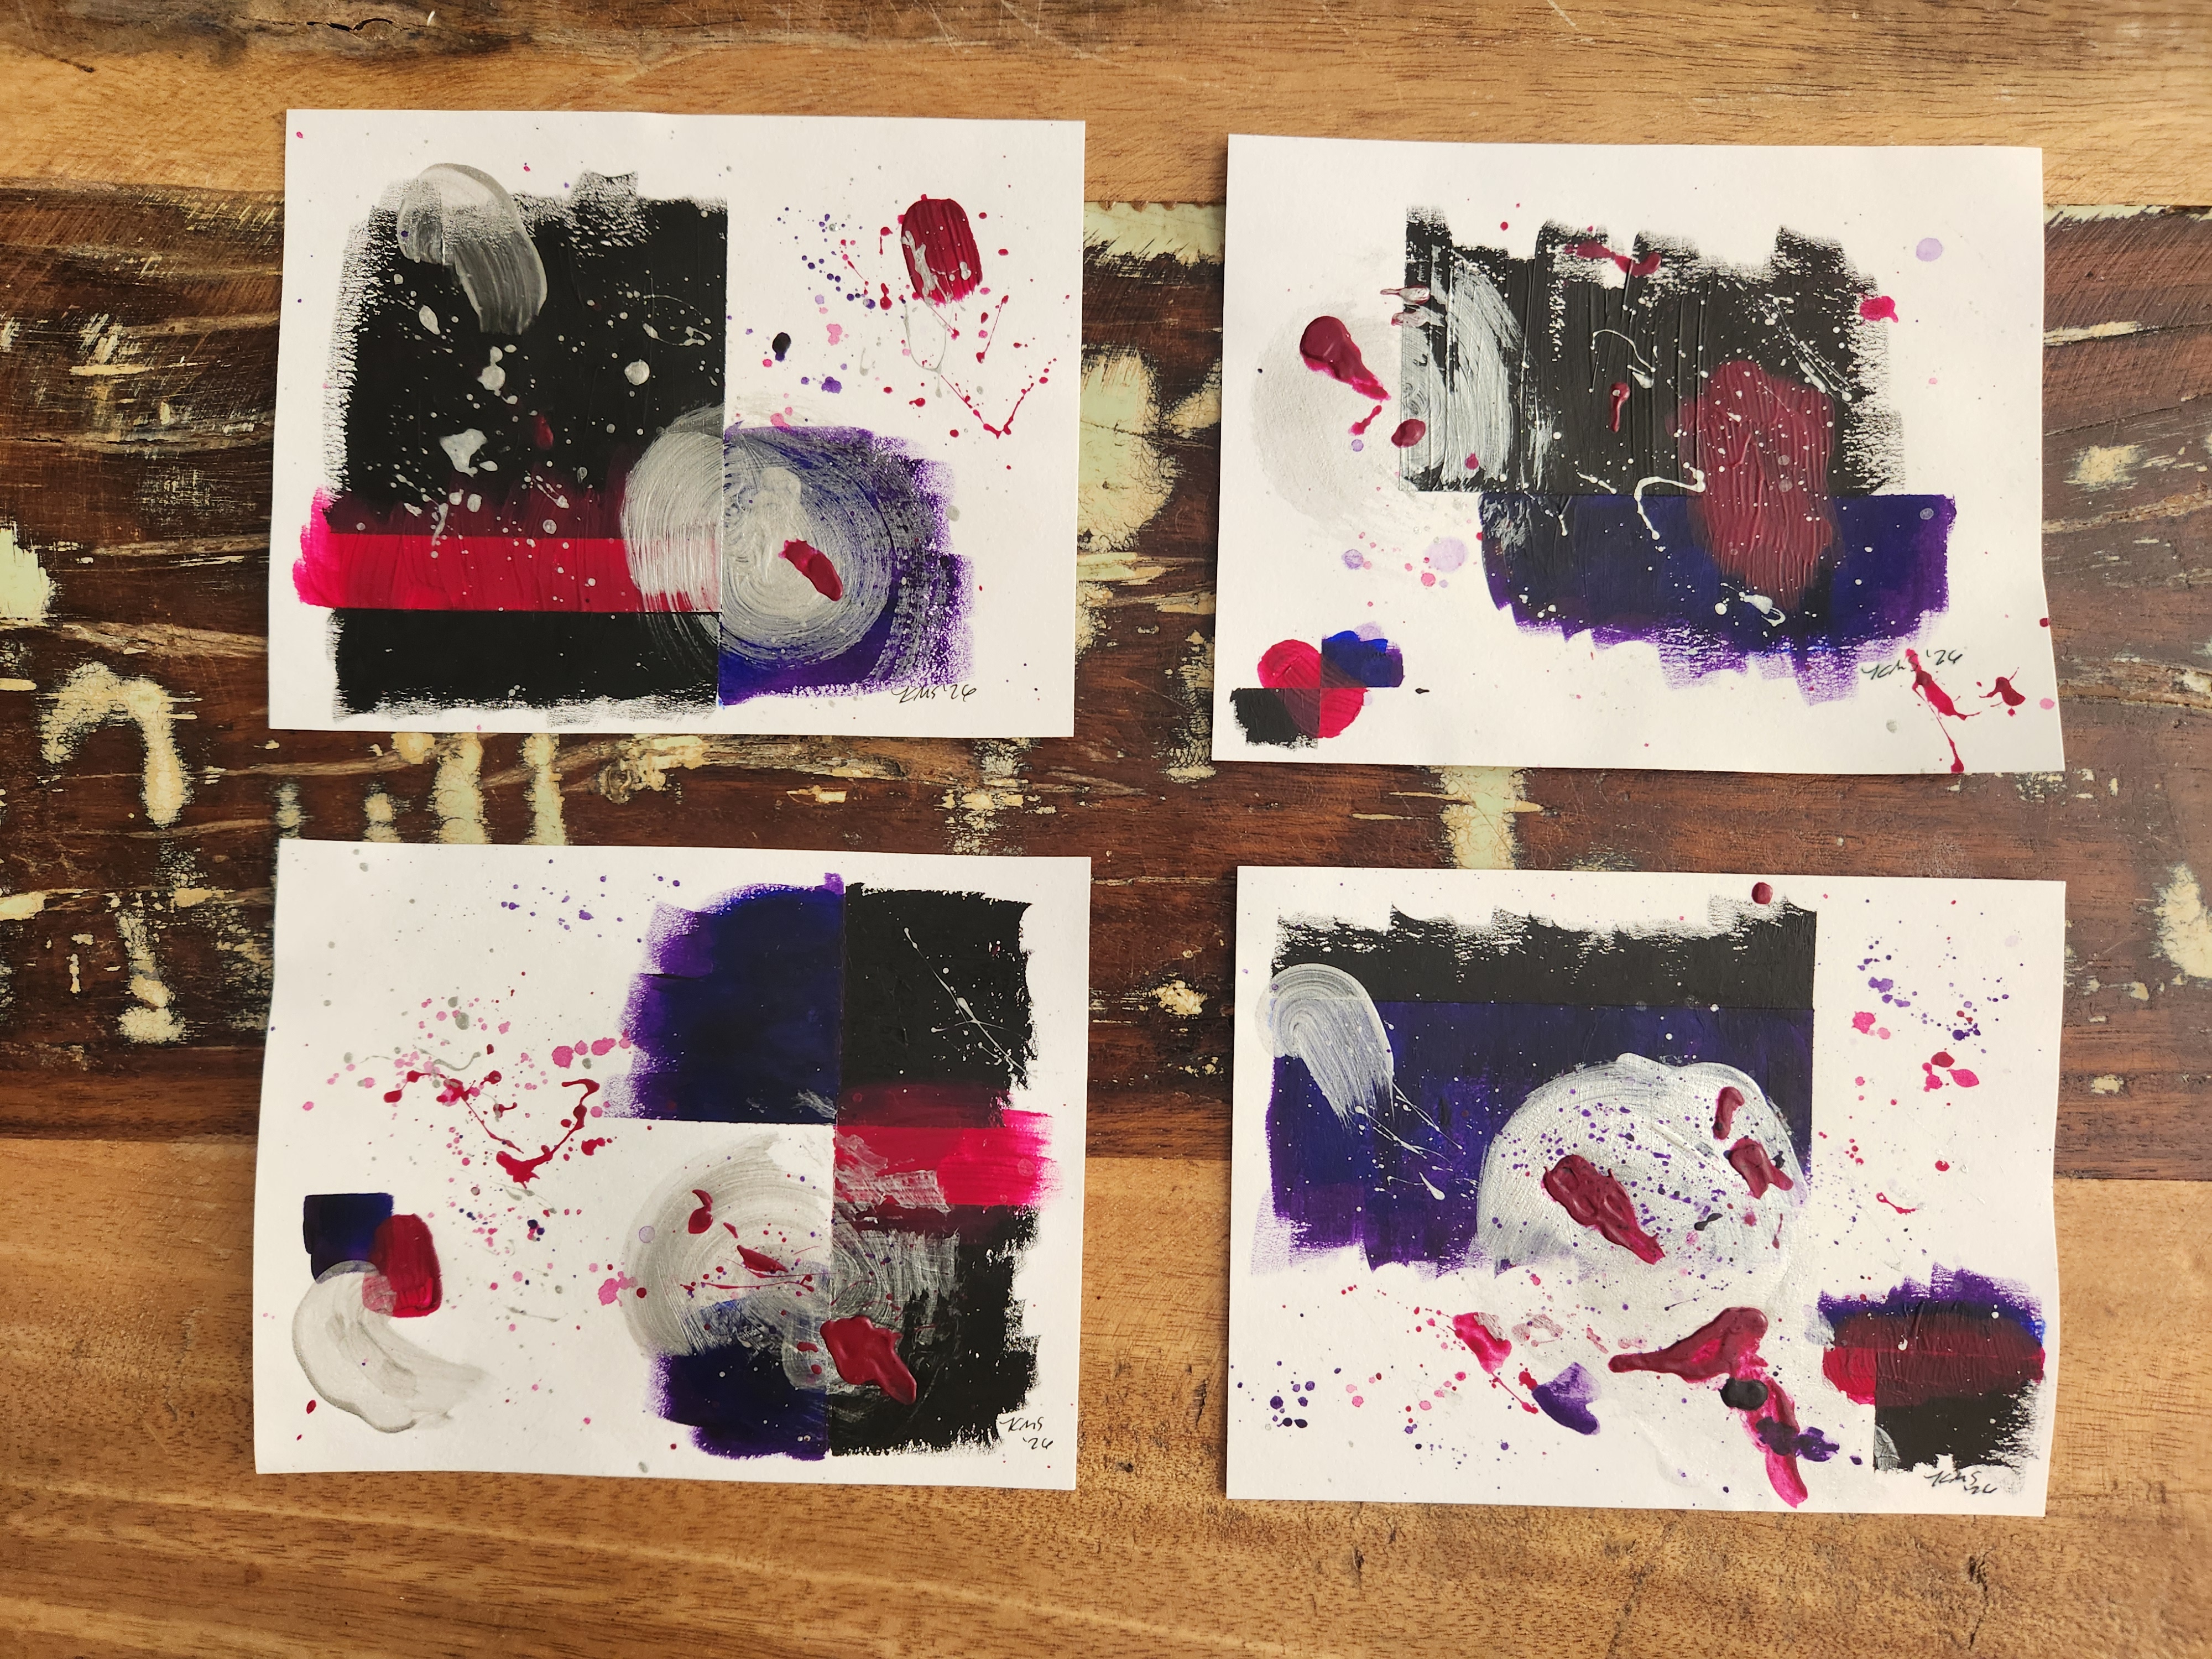
JFA Series 1 (2026)
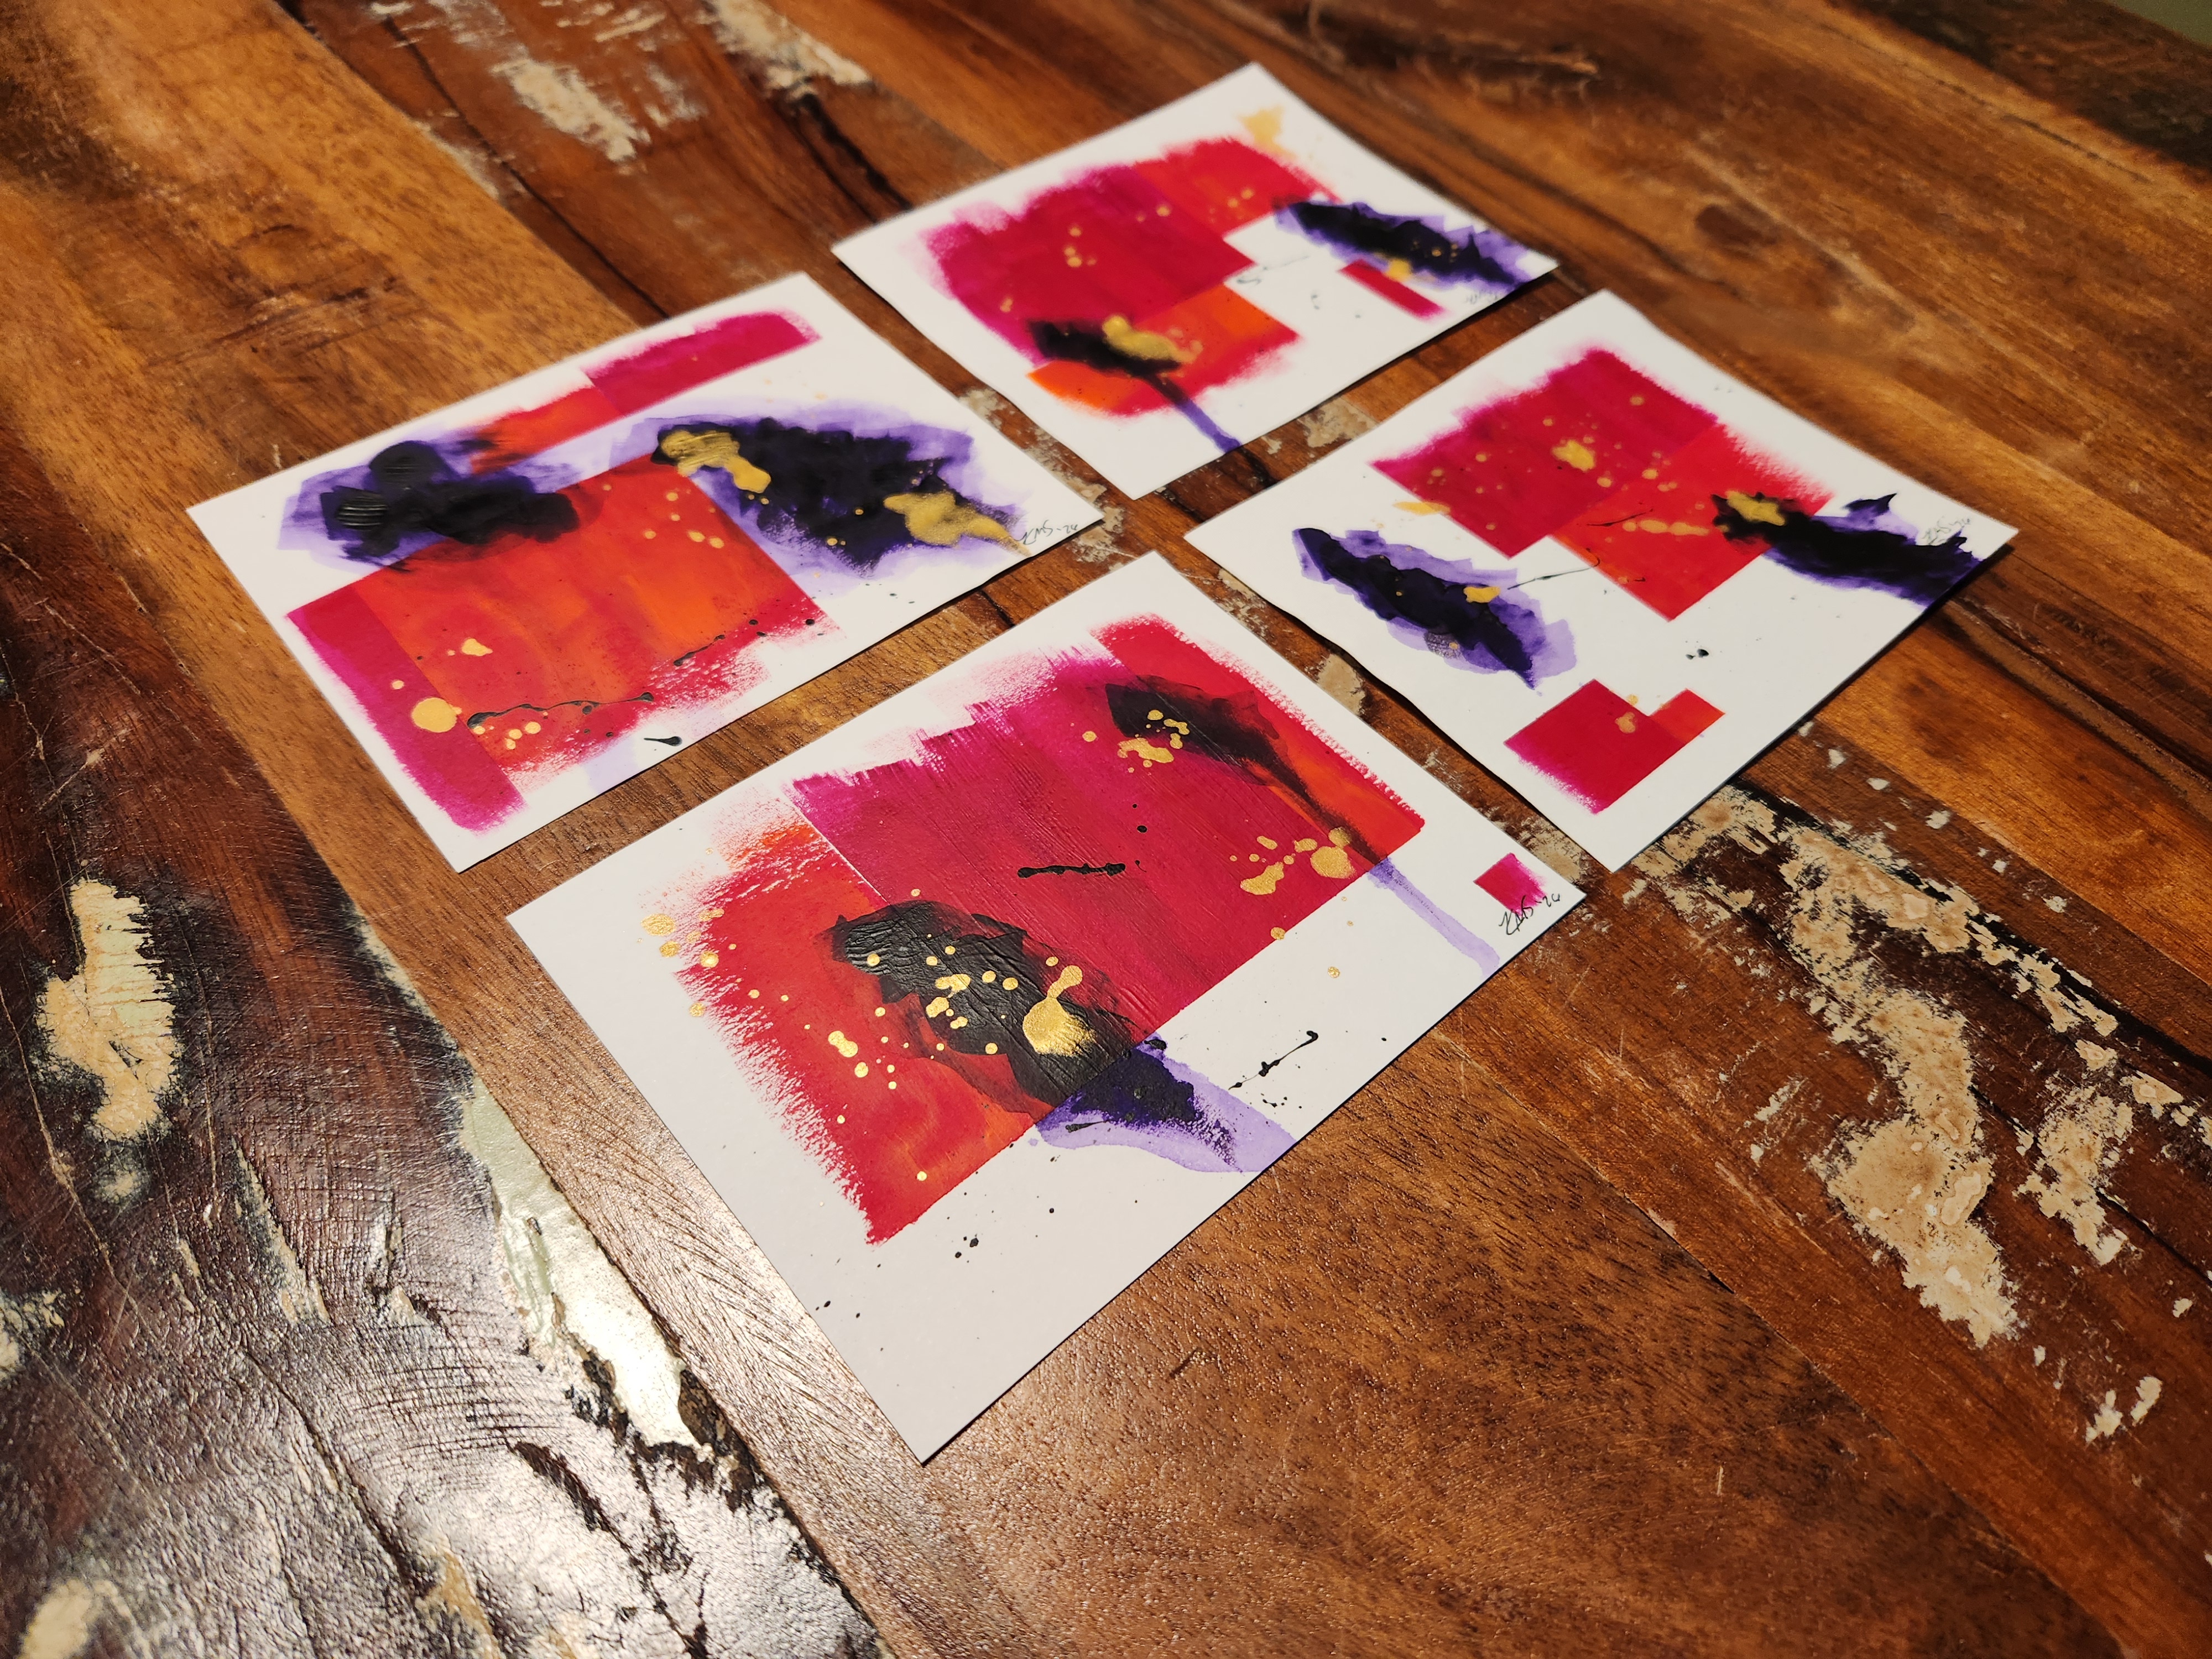
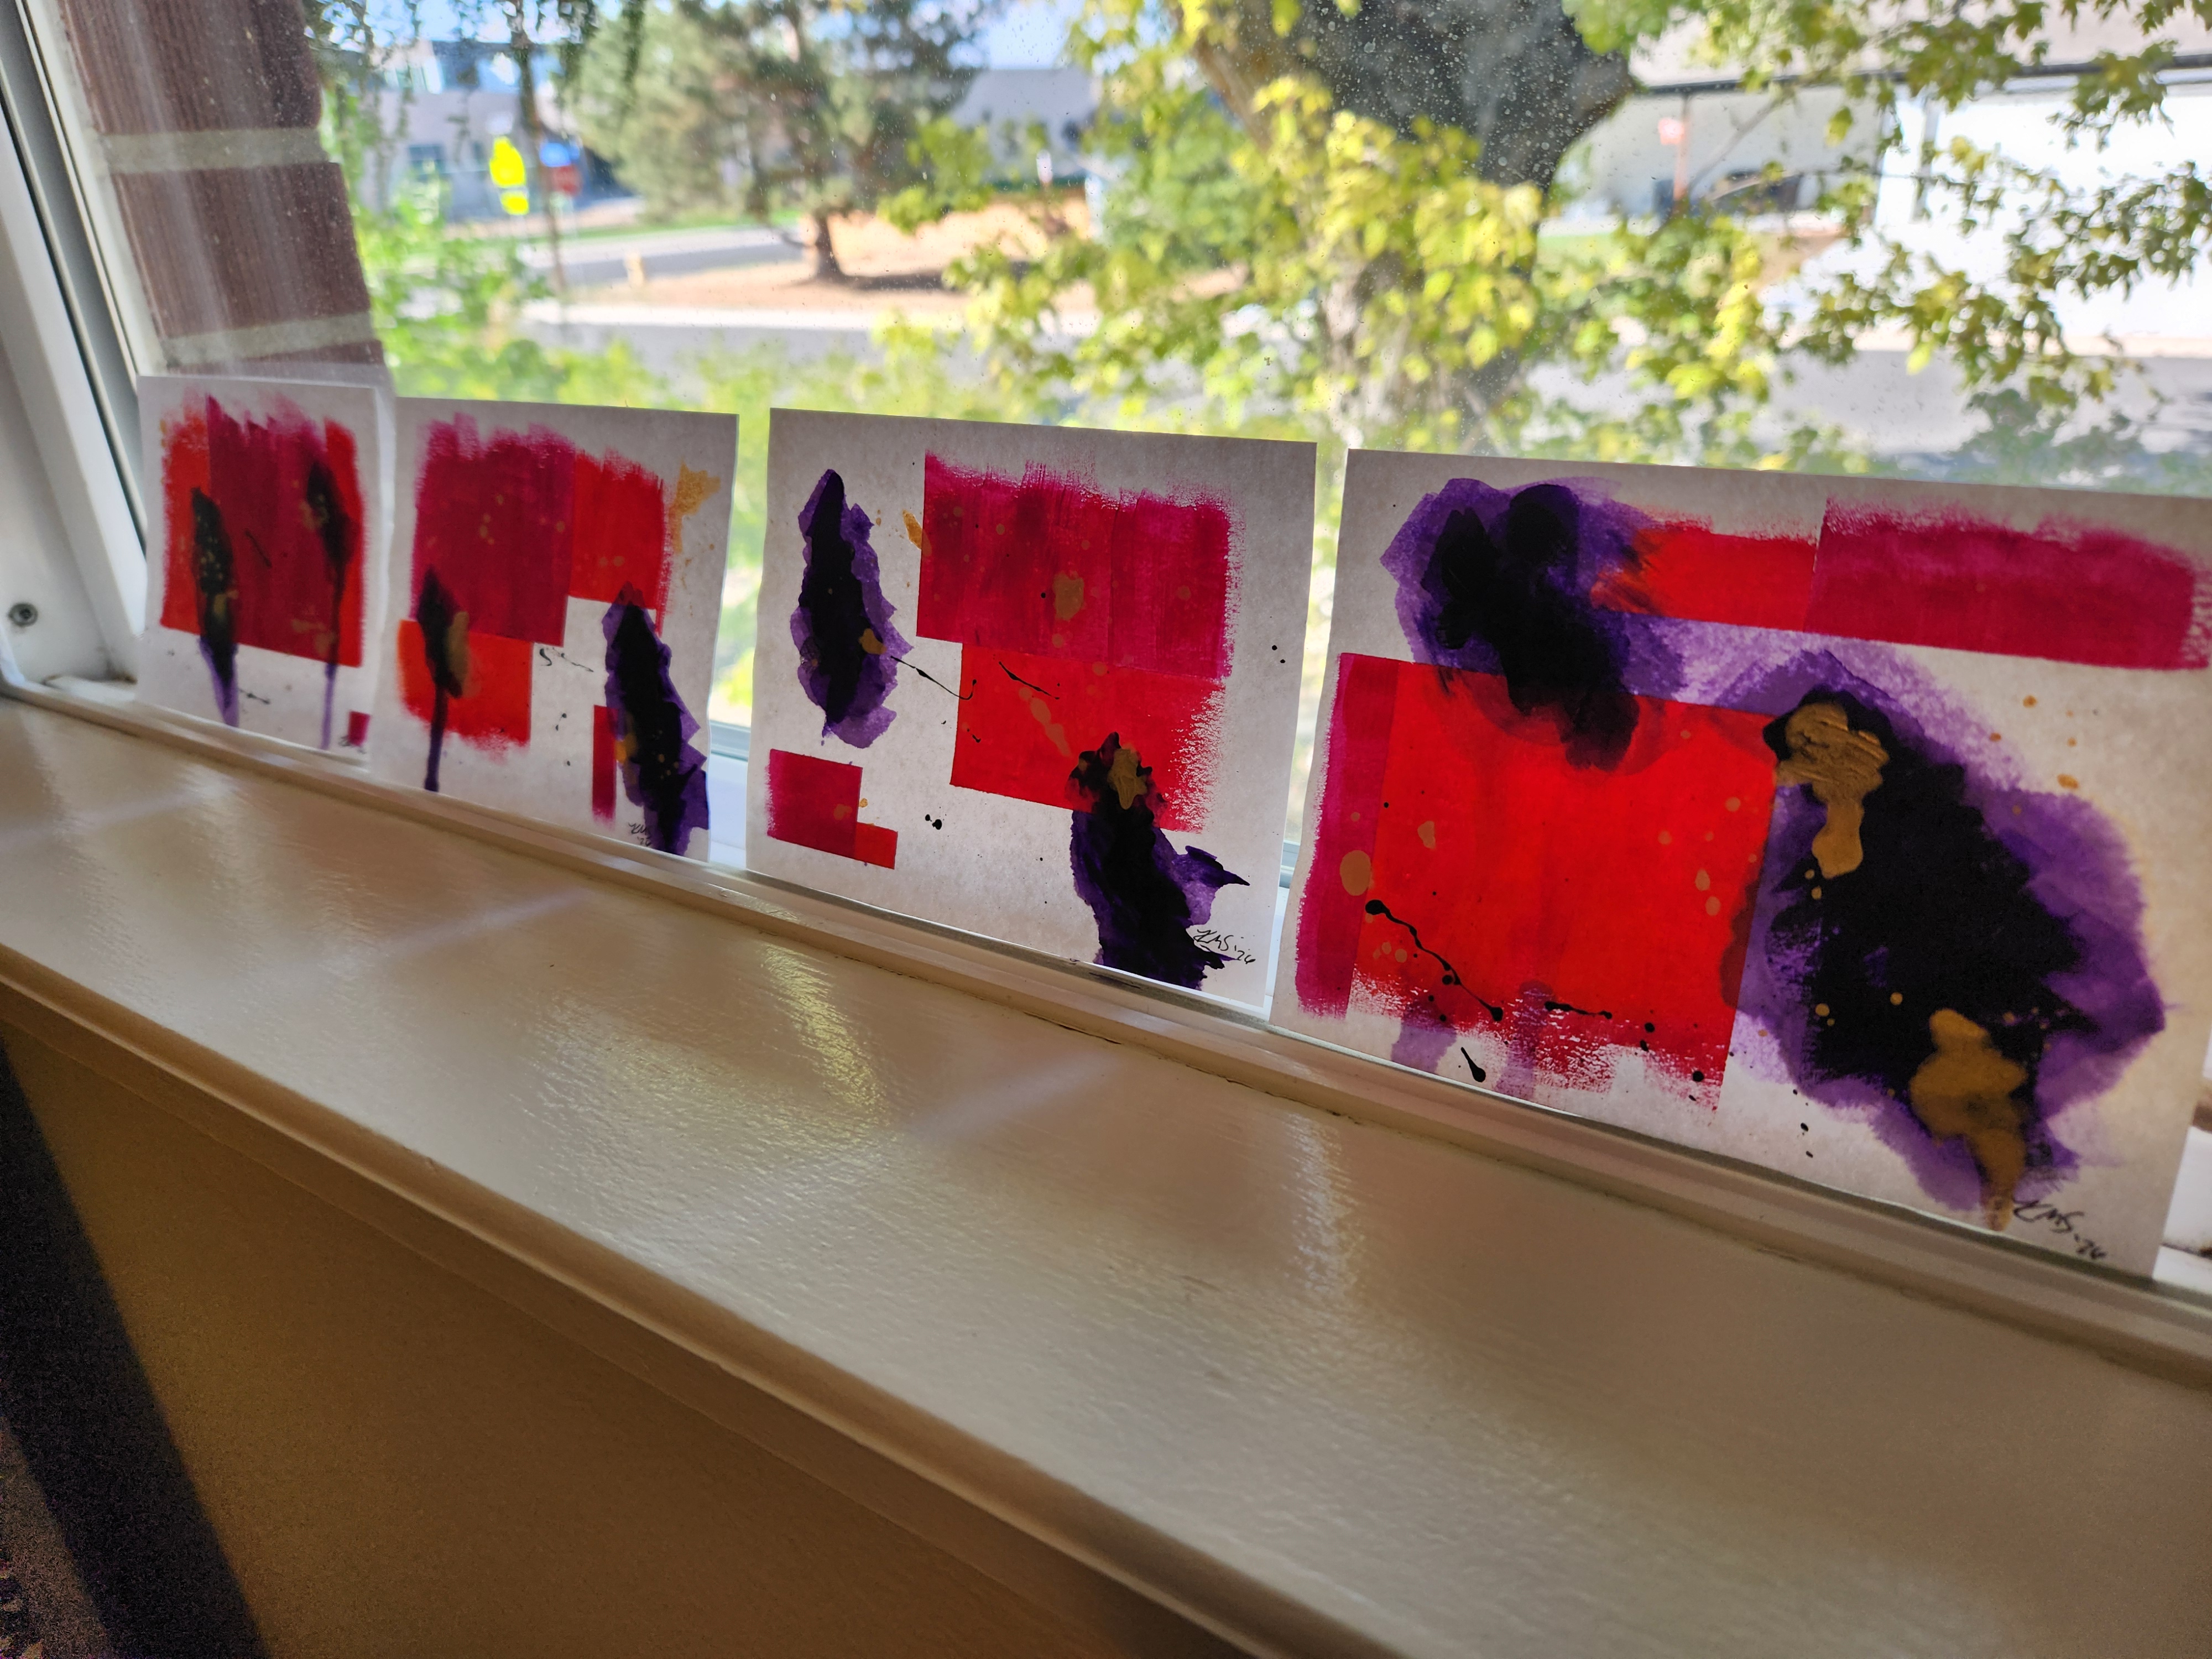
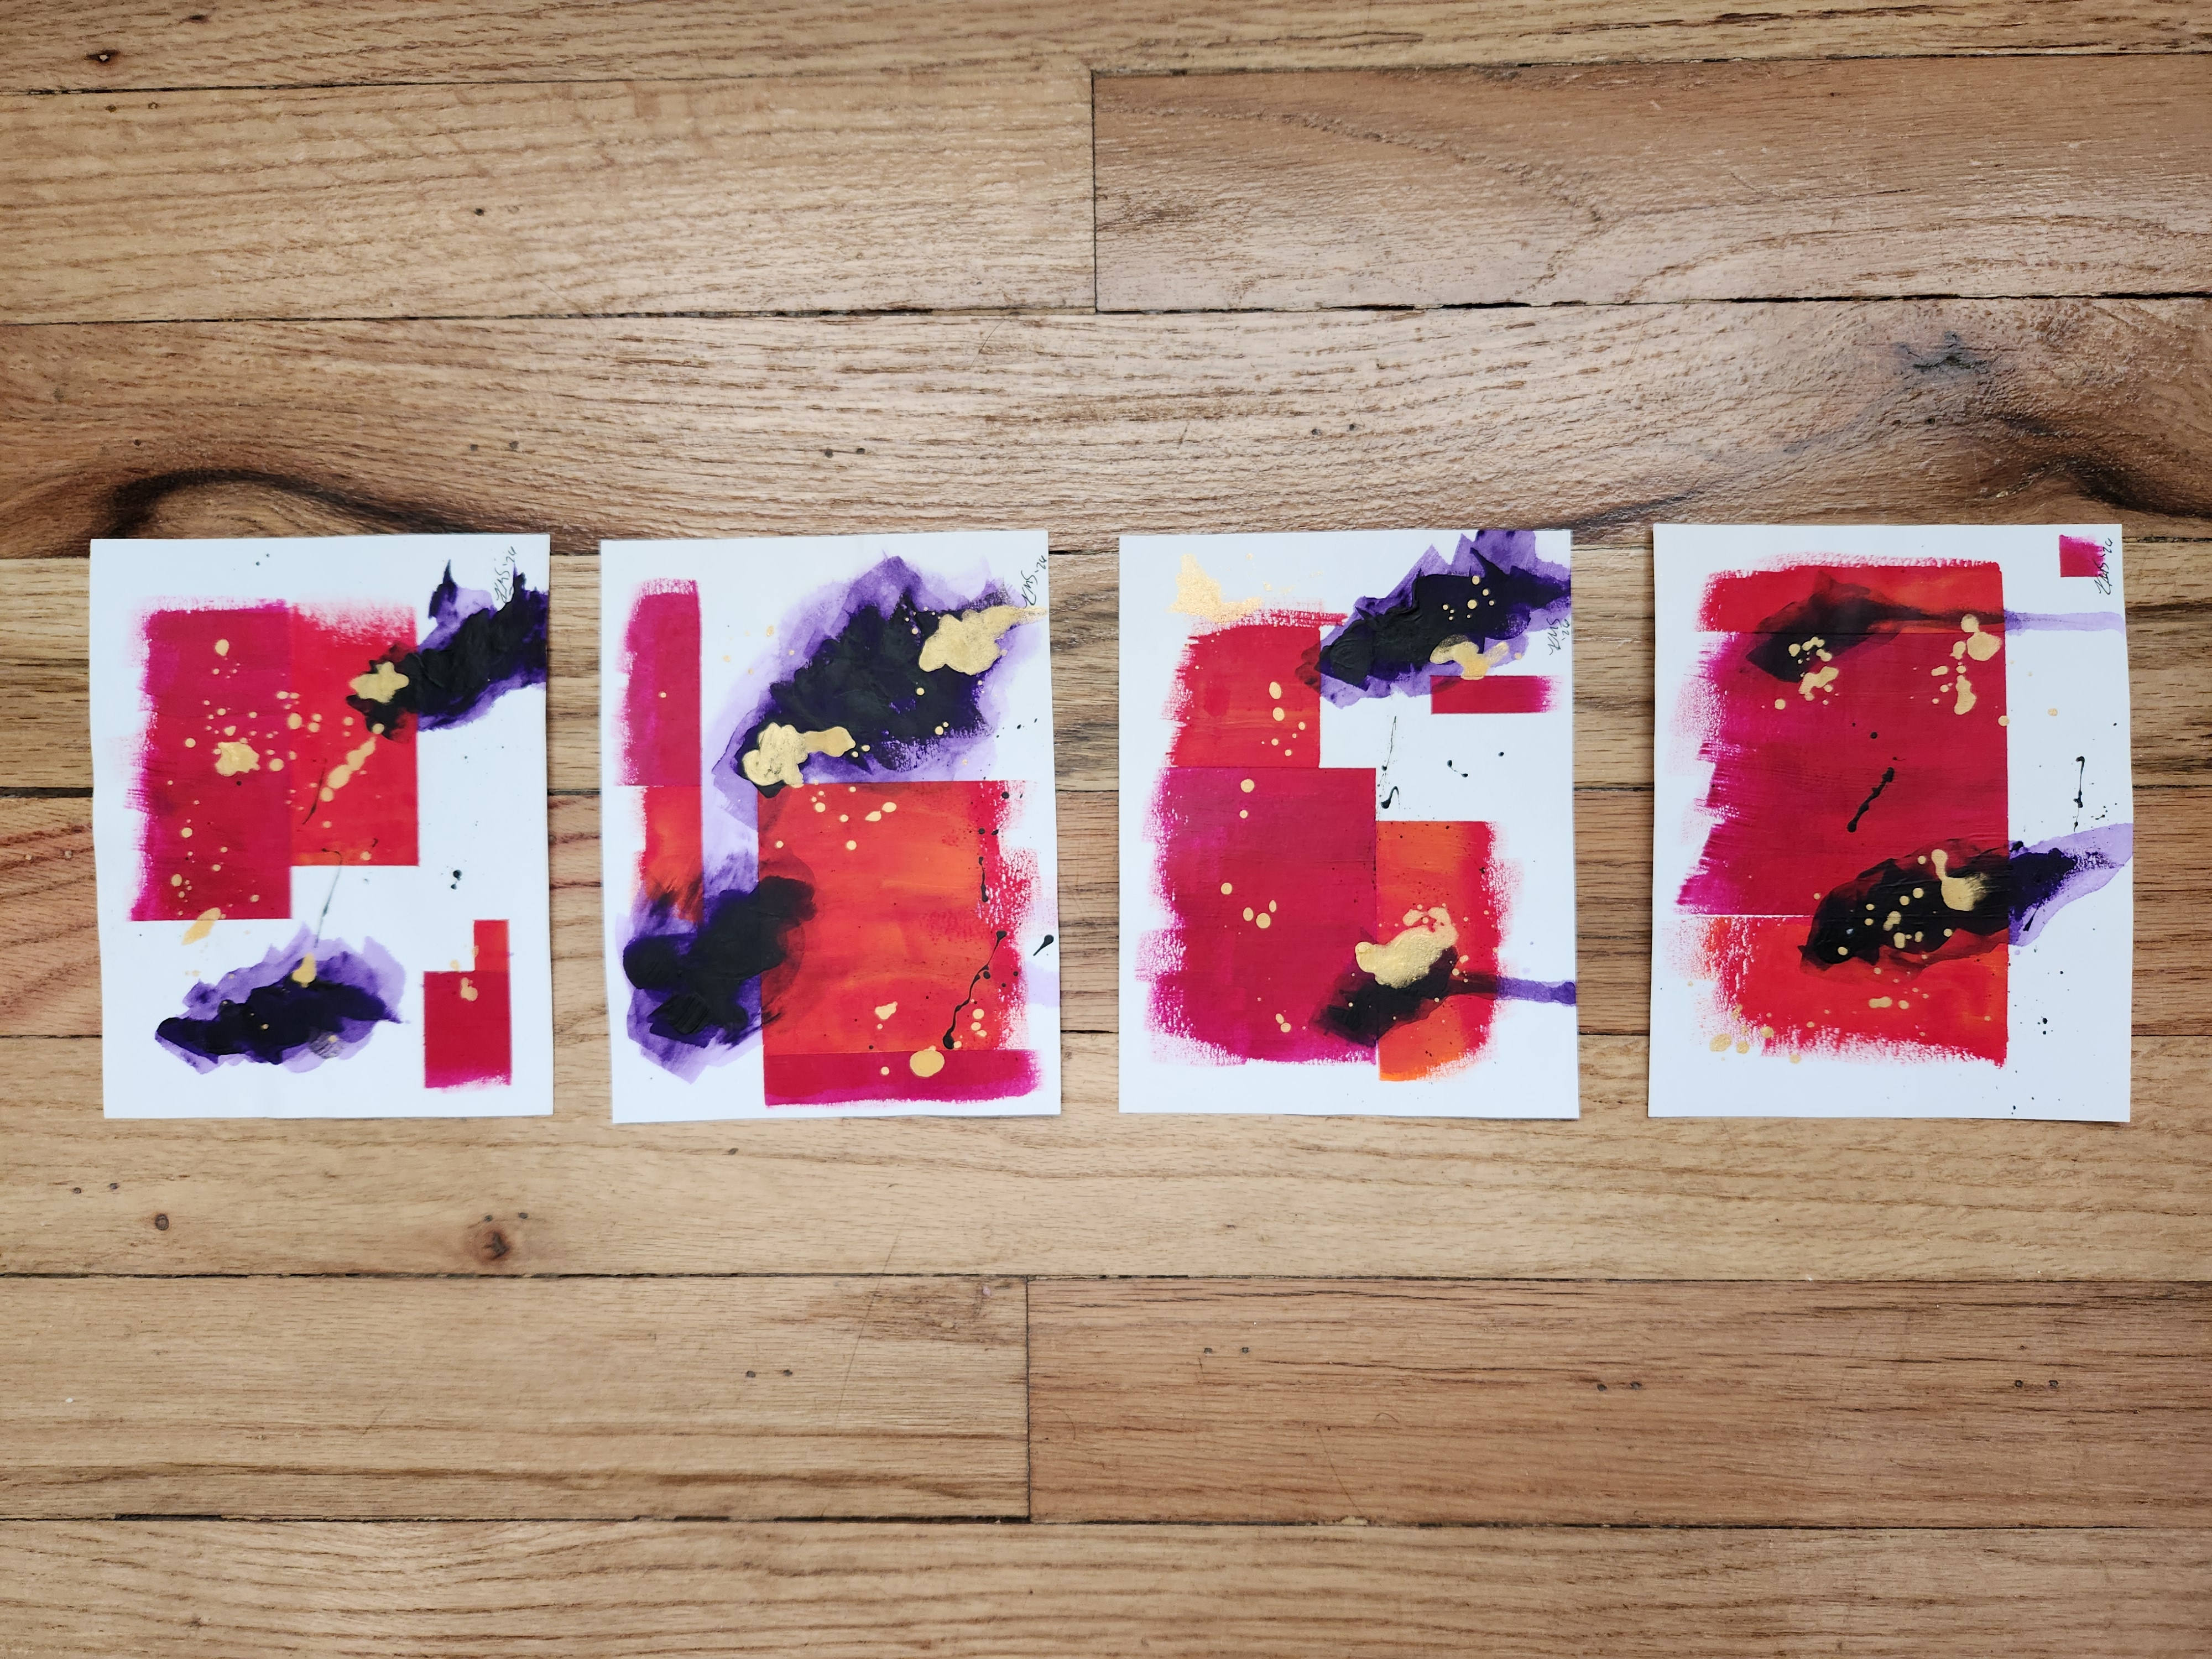
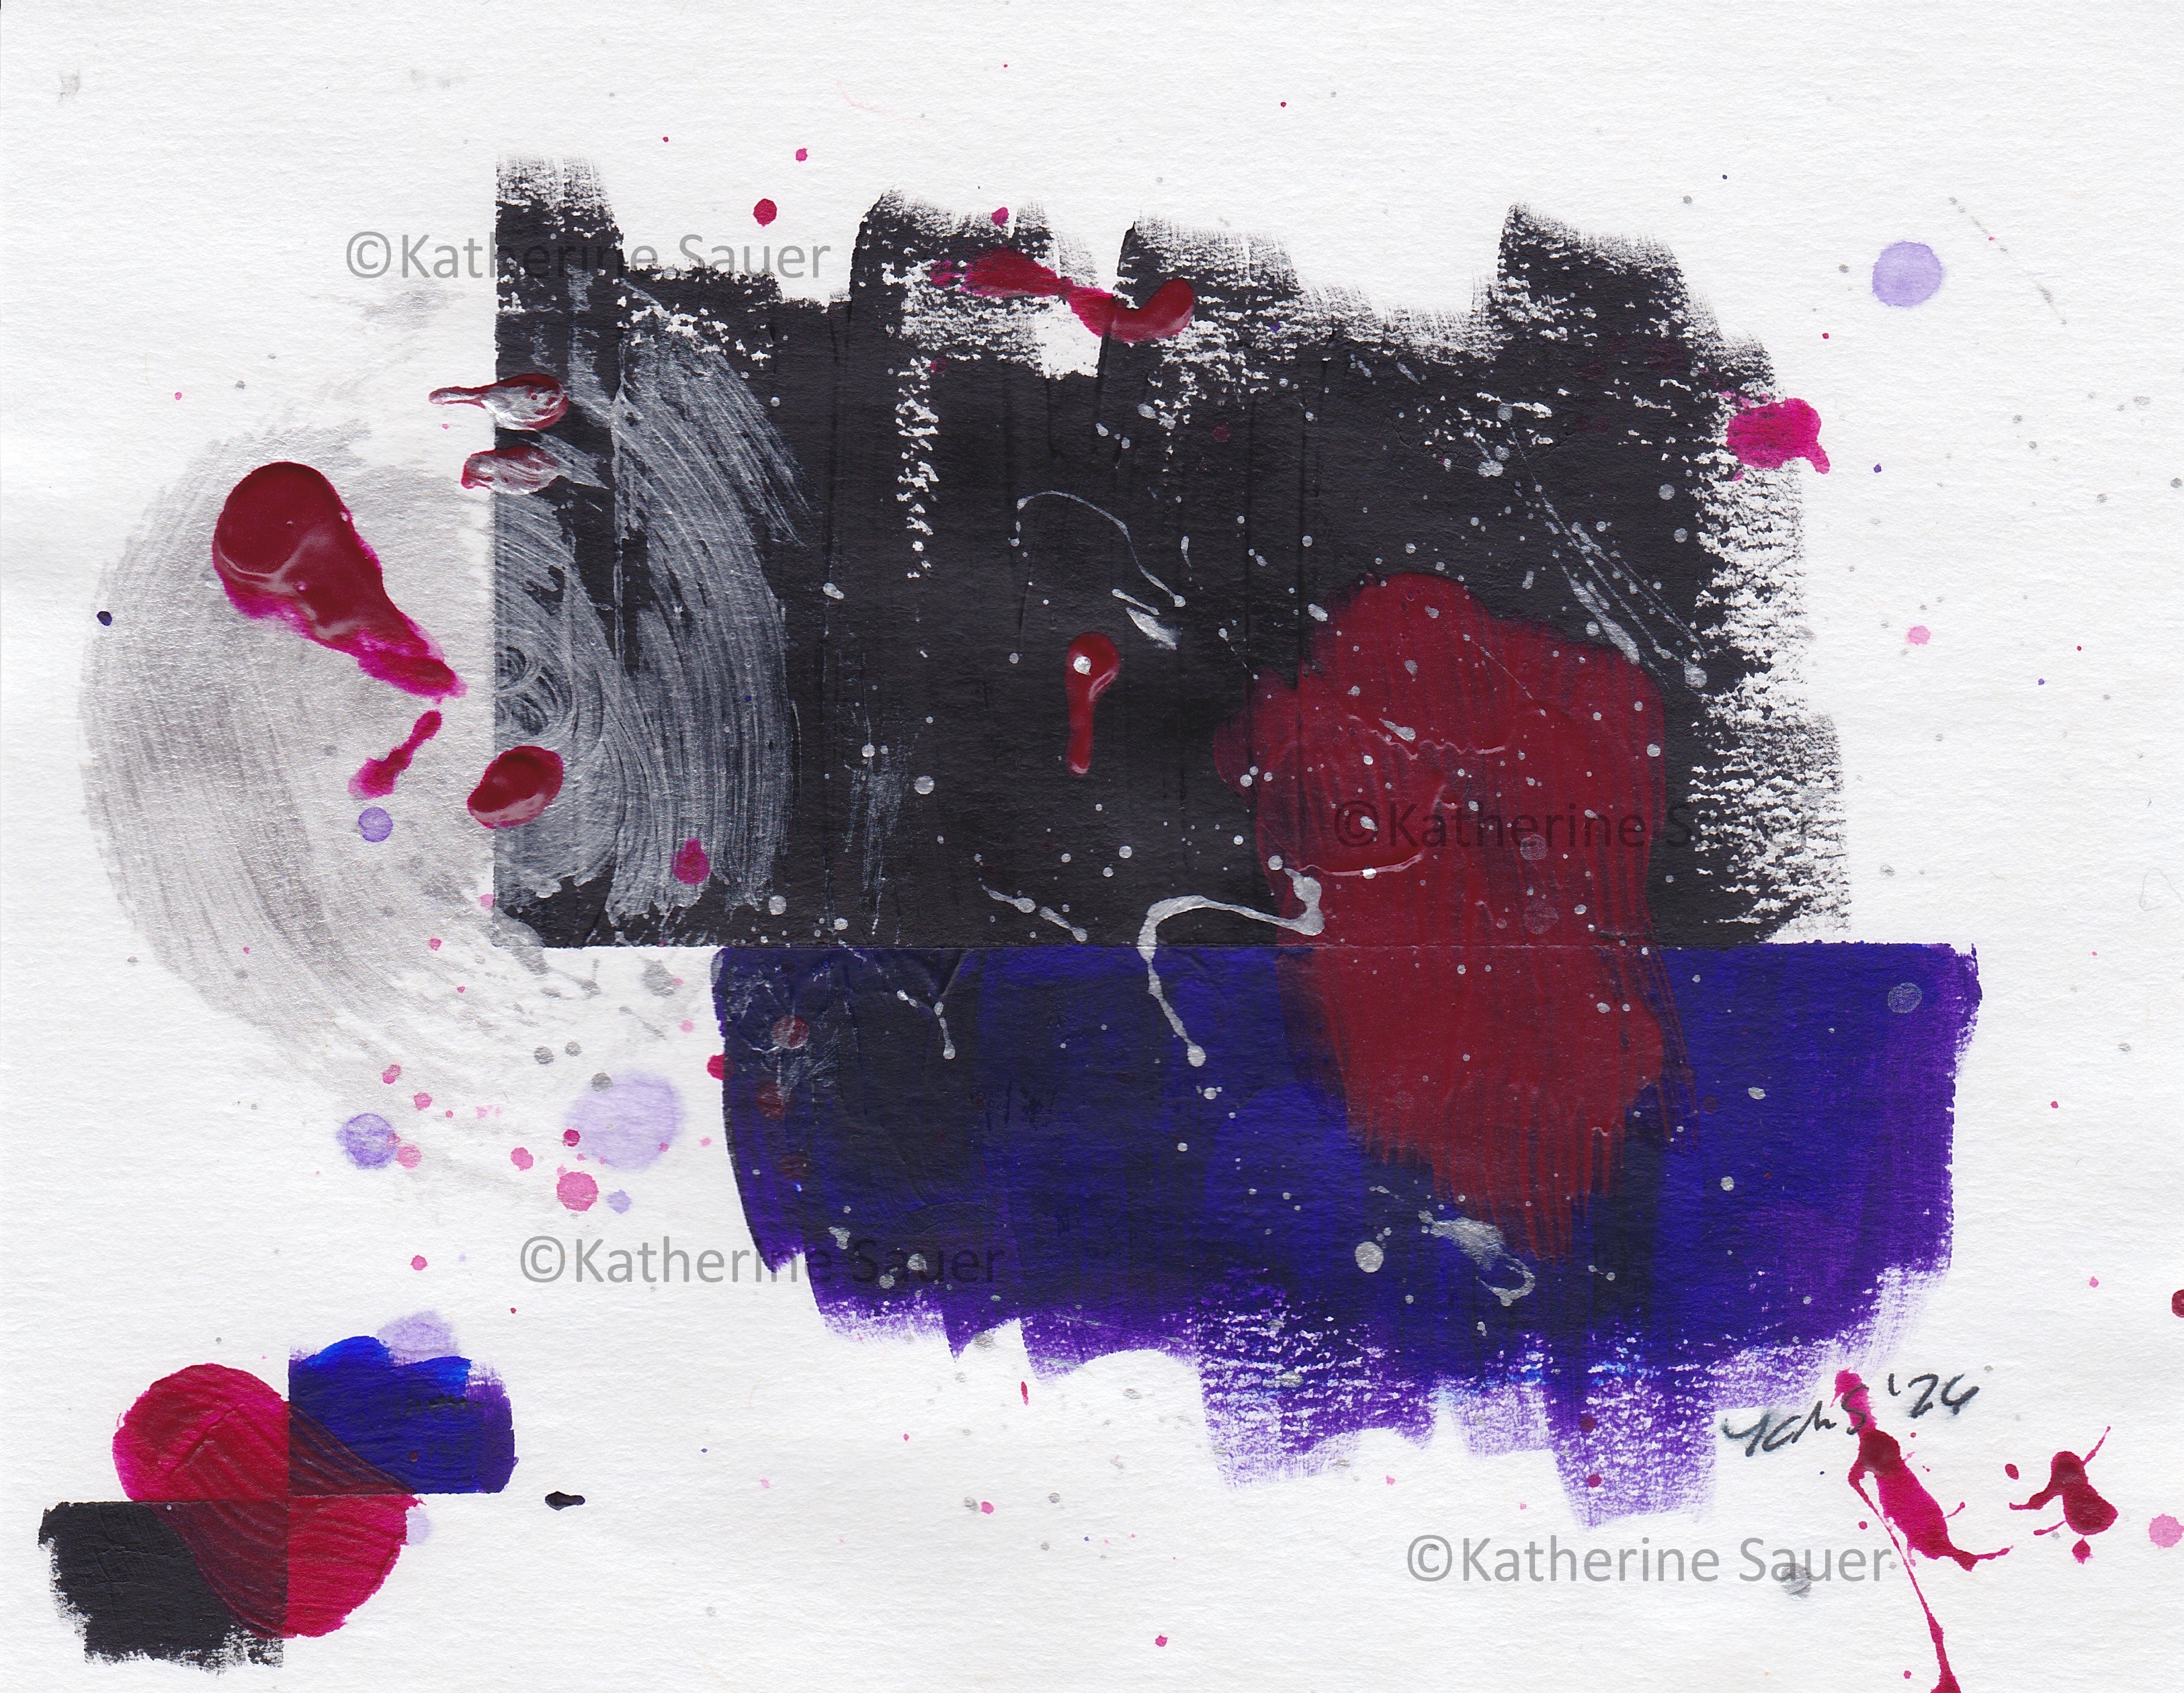
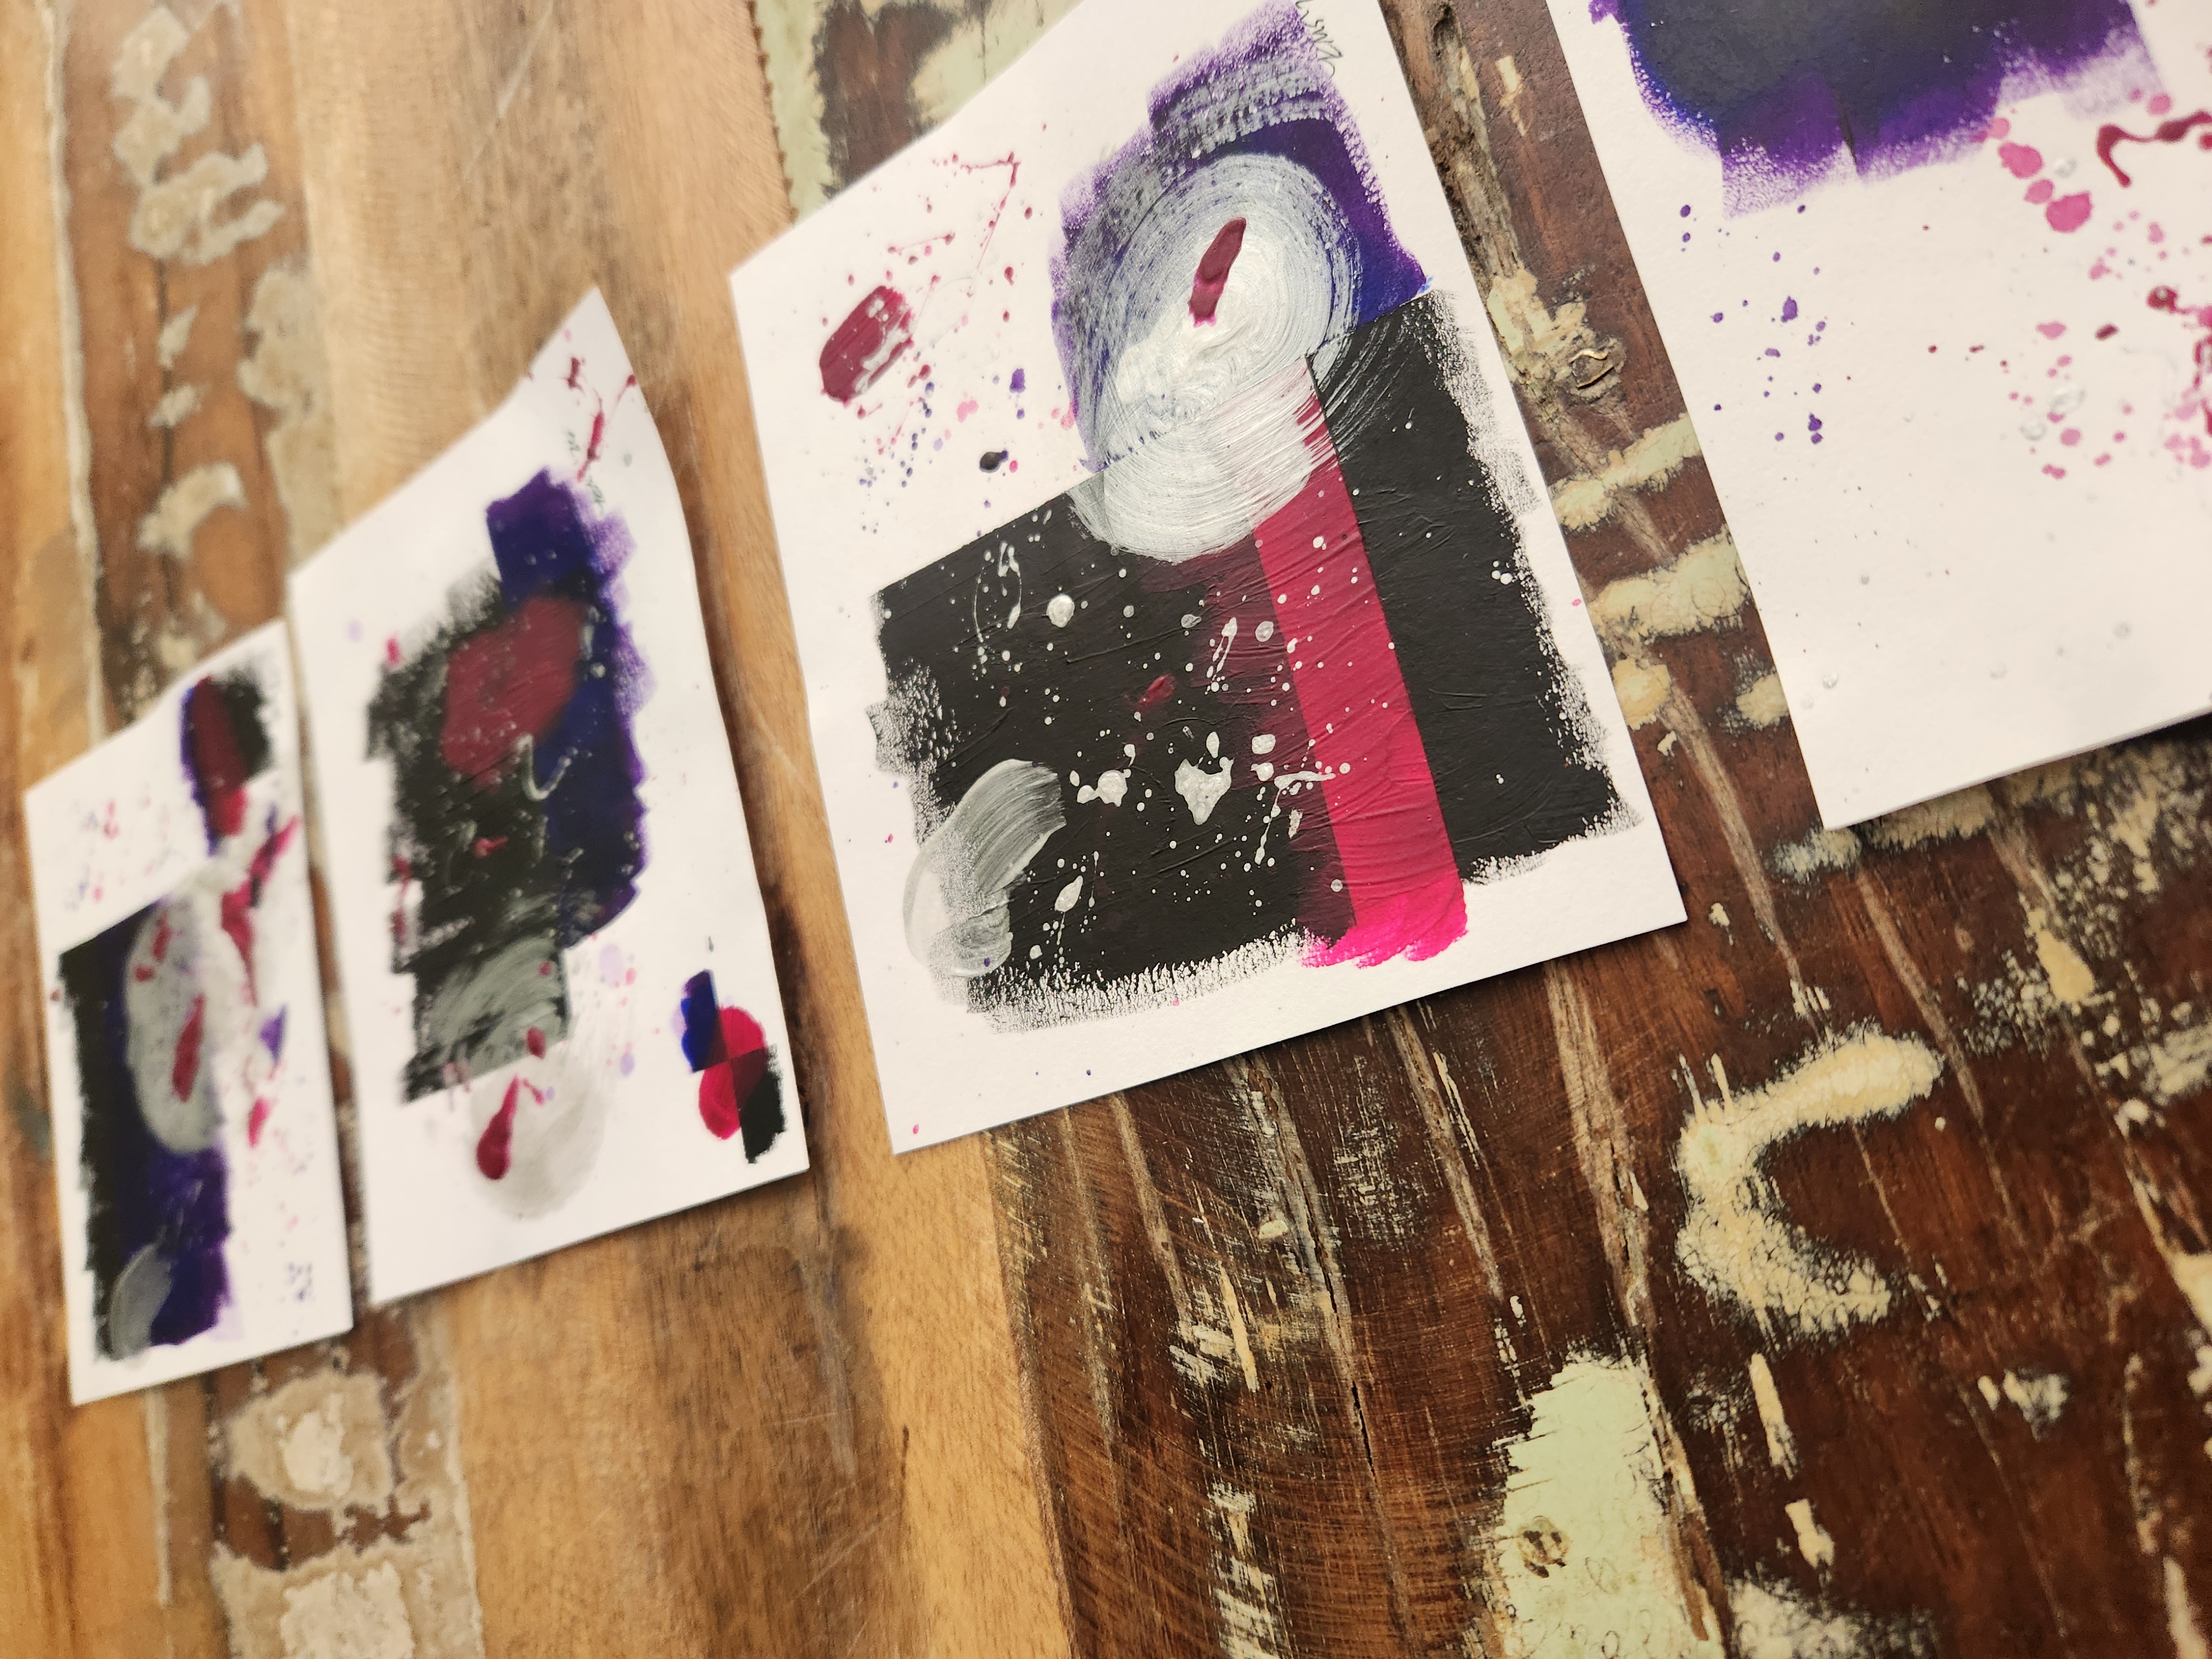
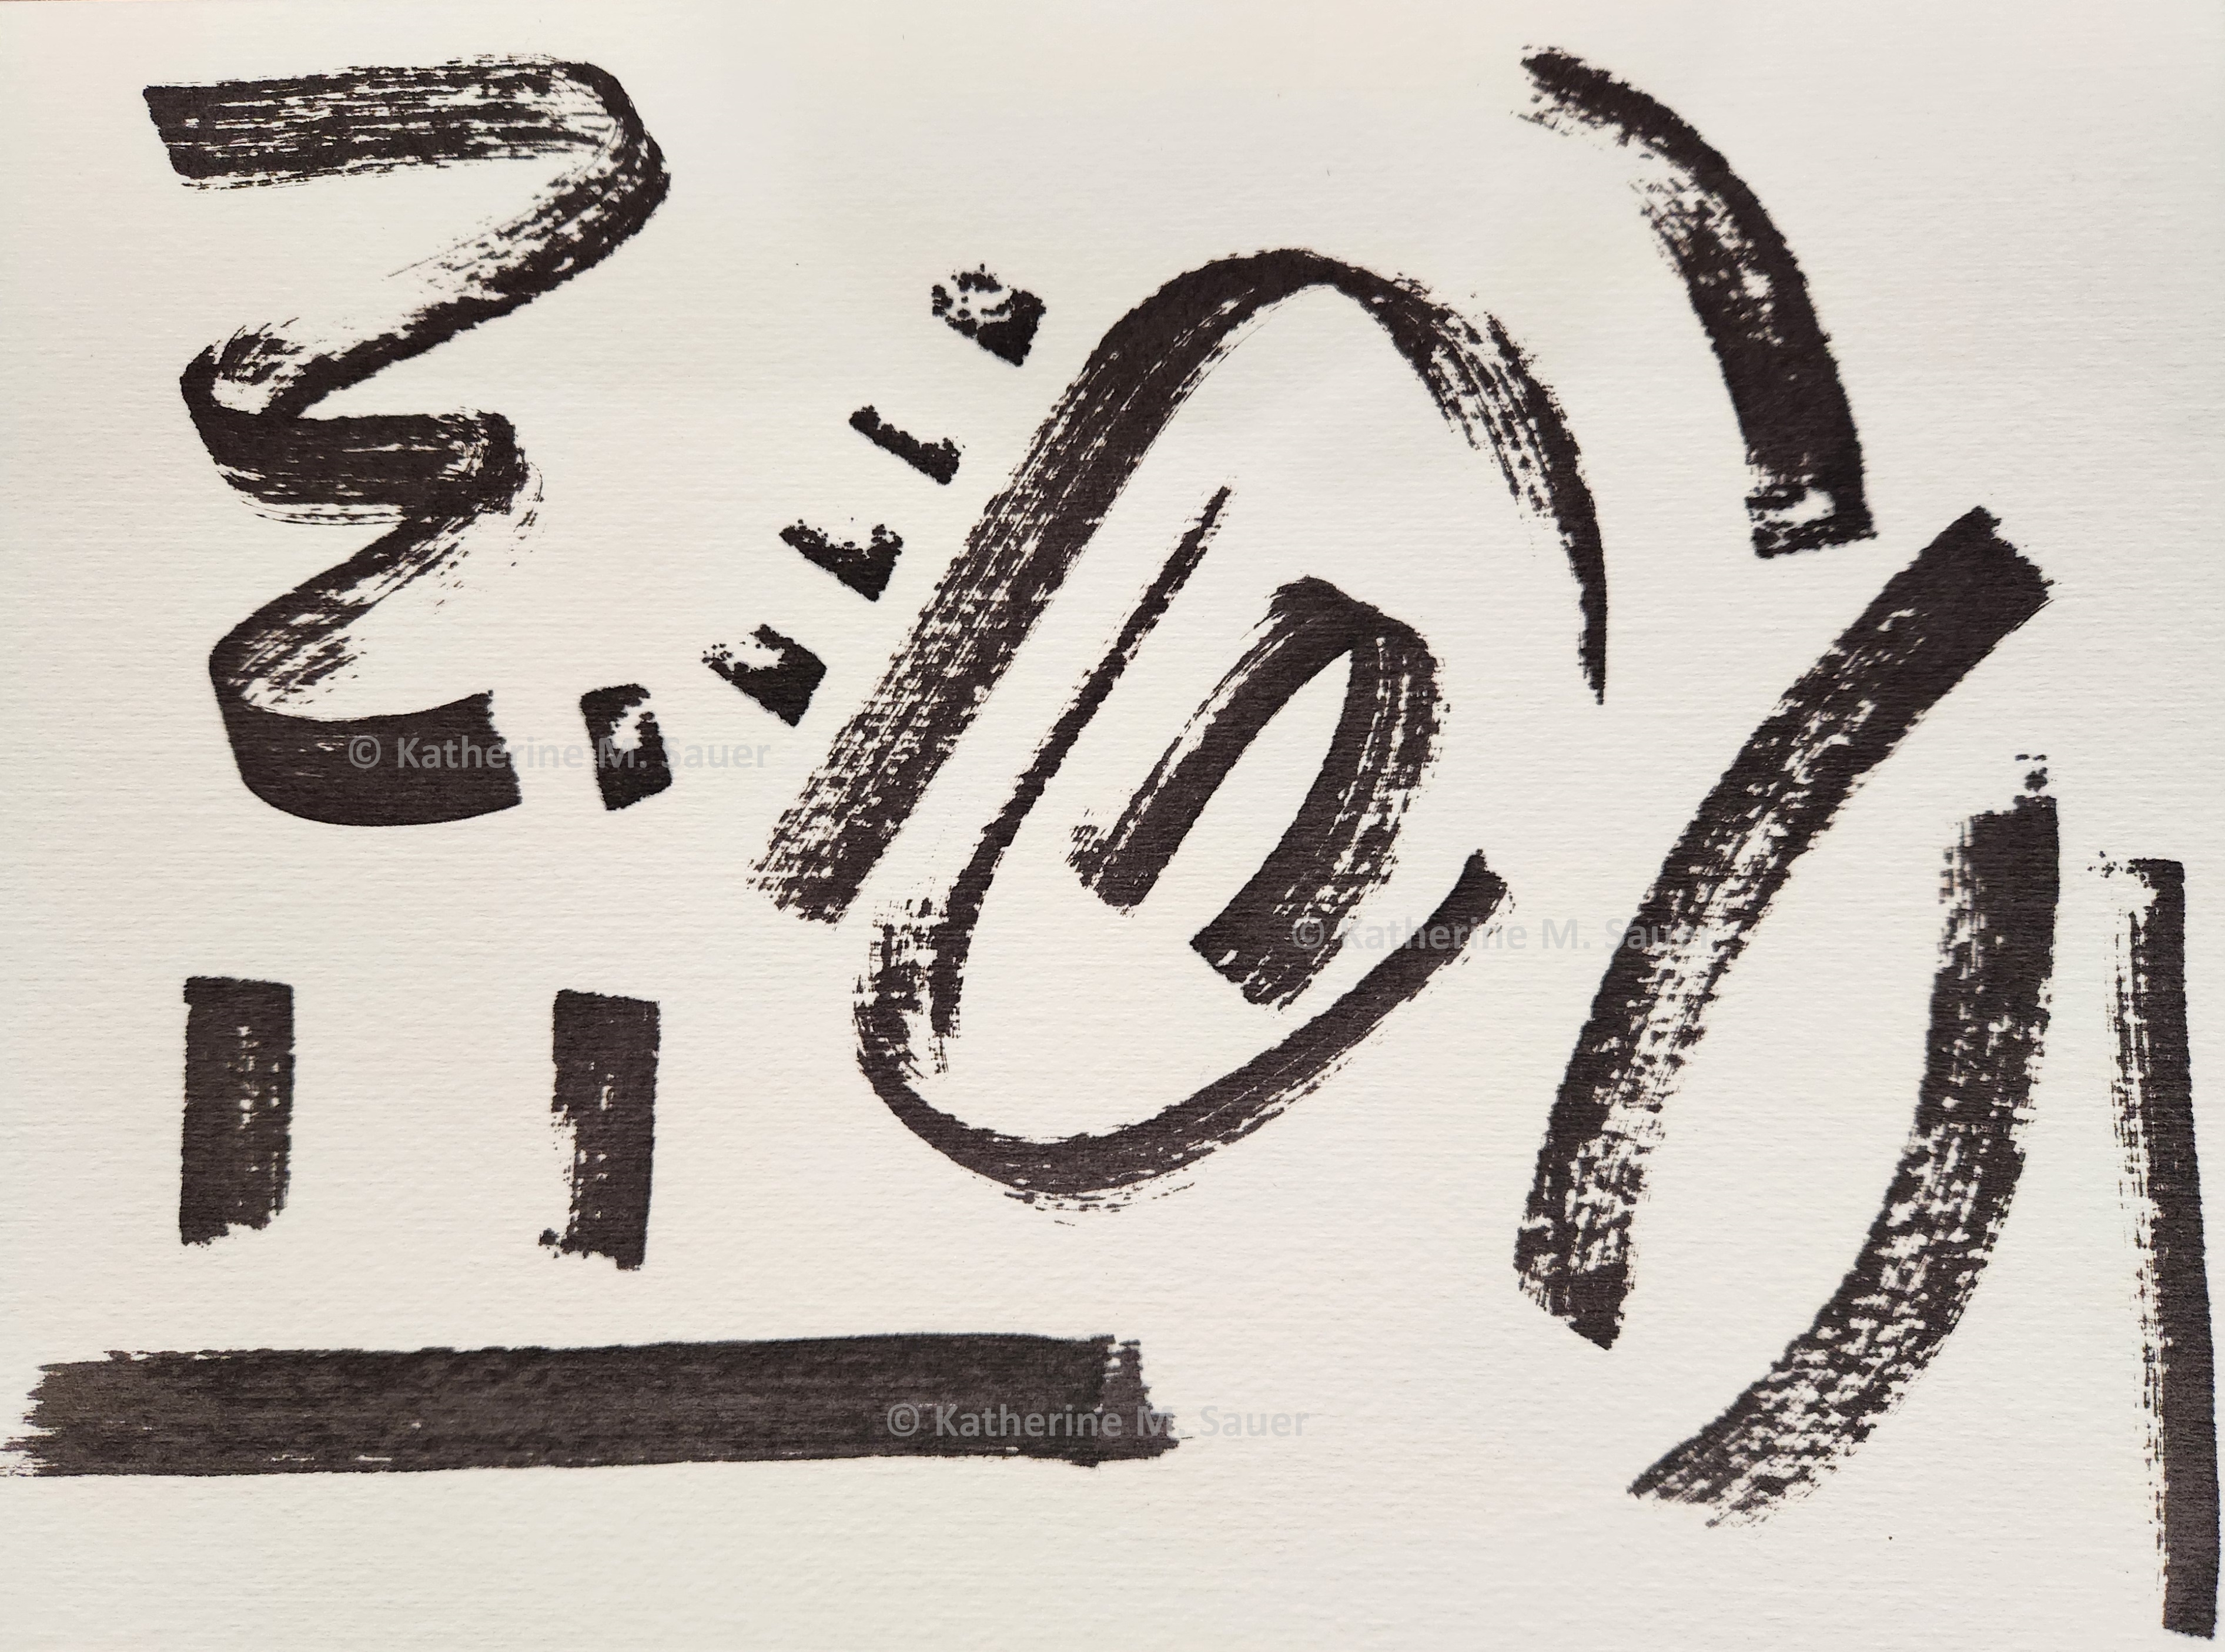
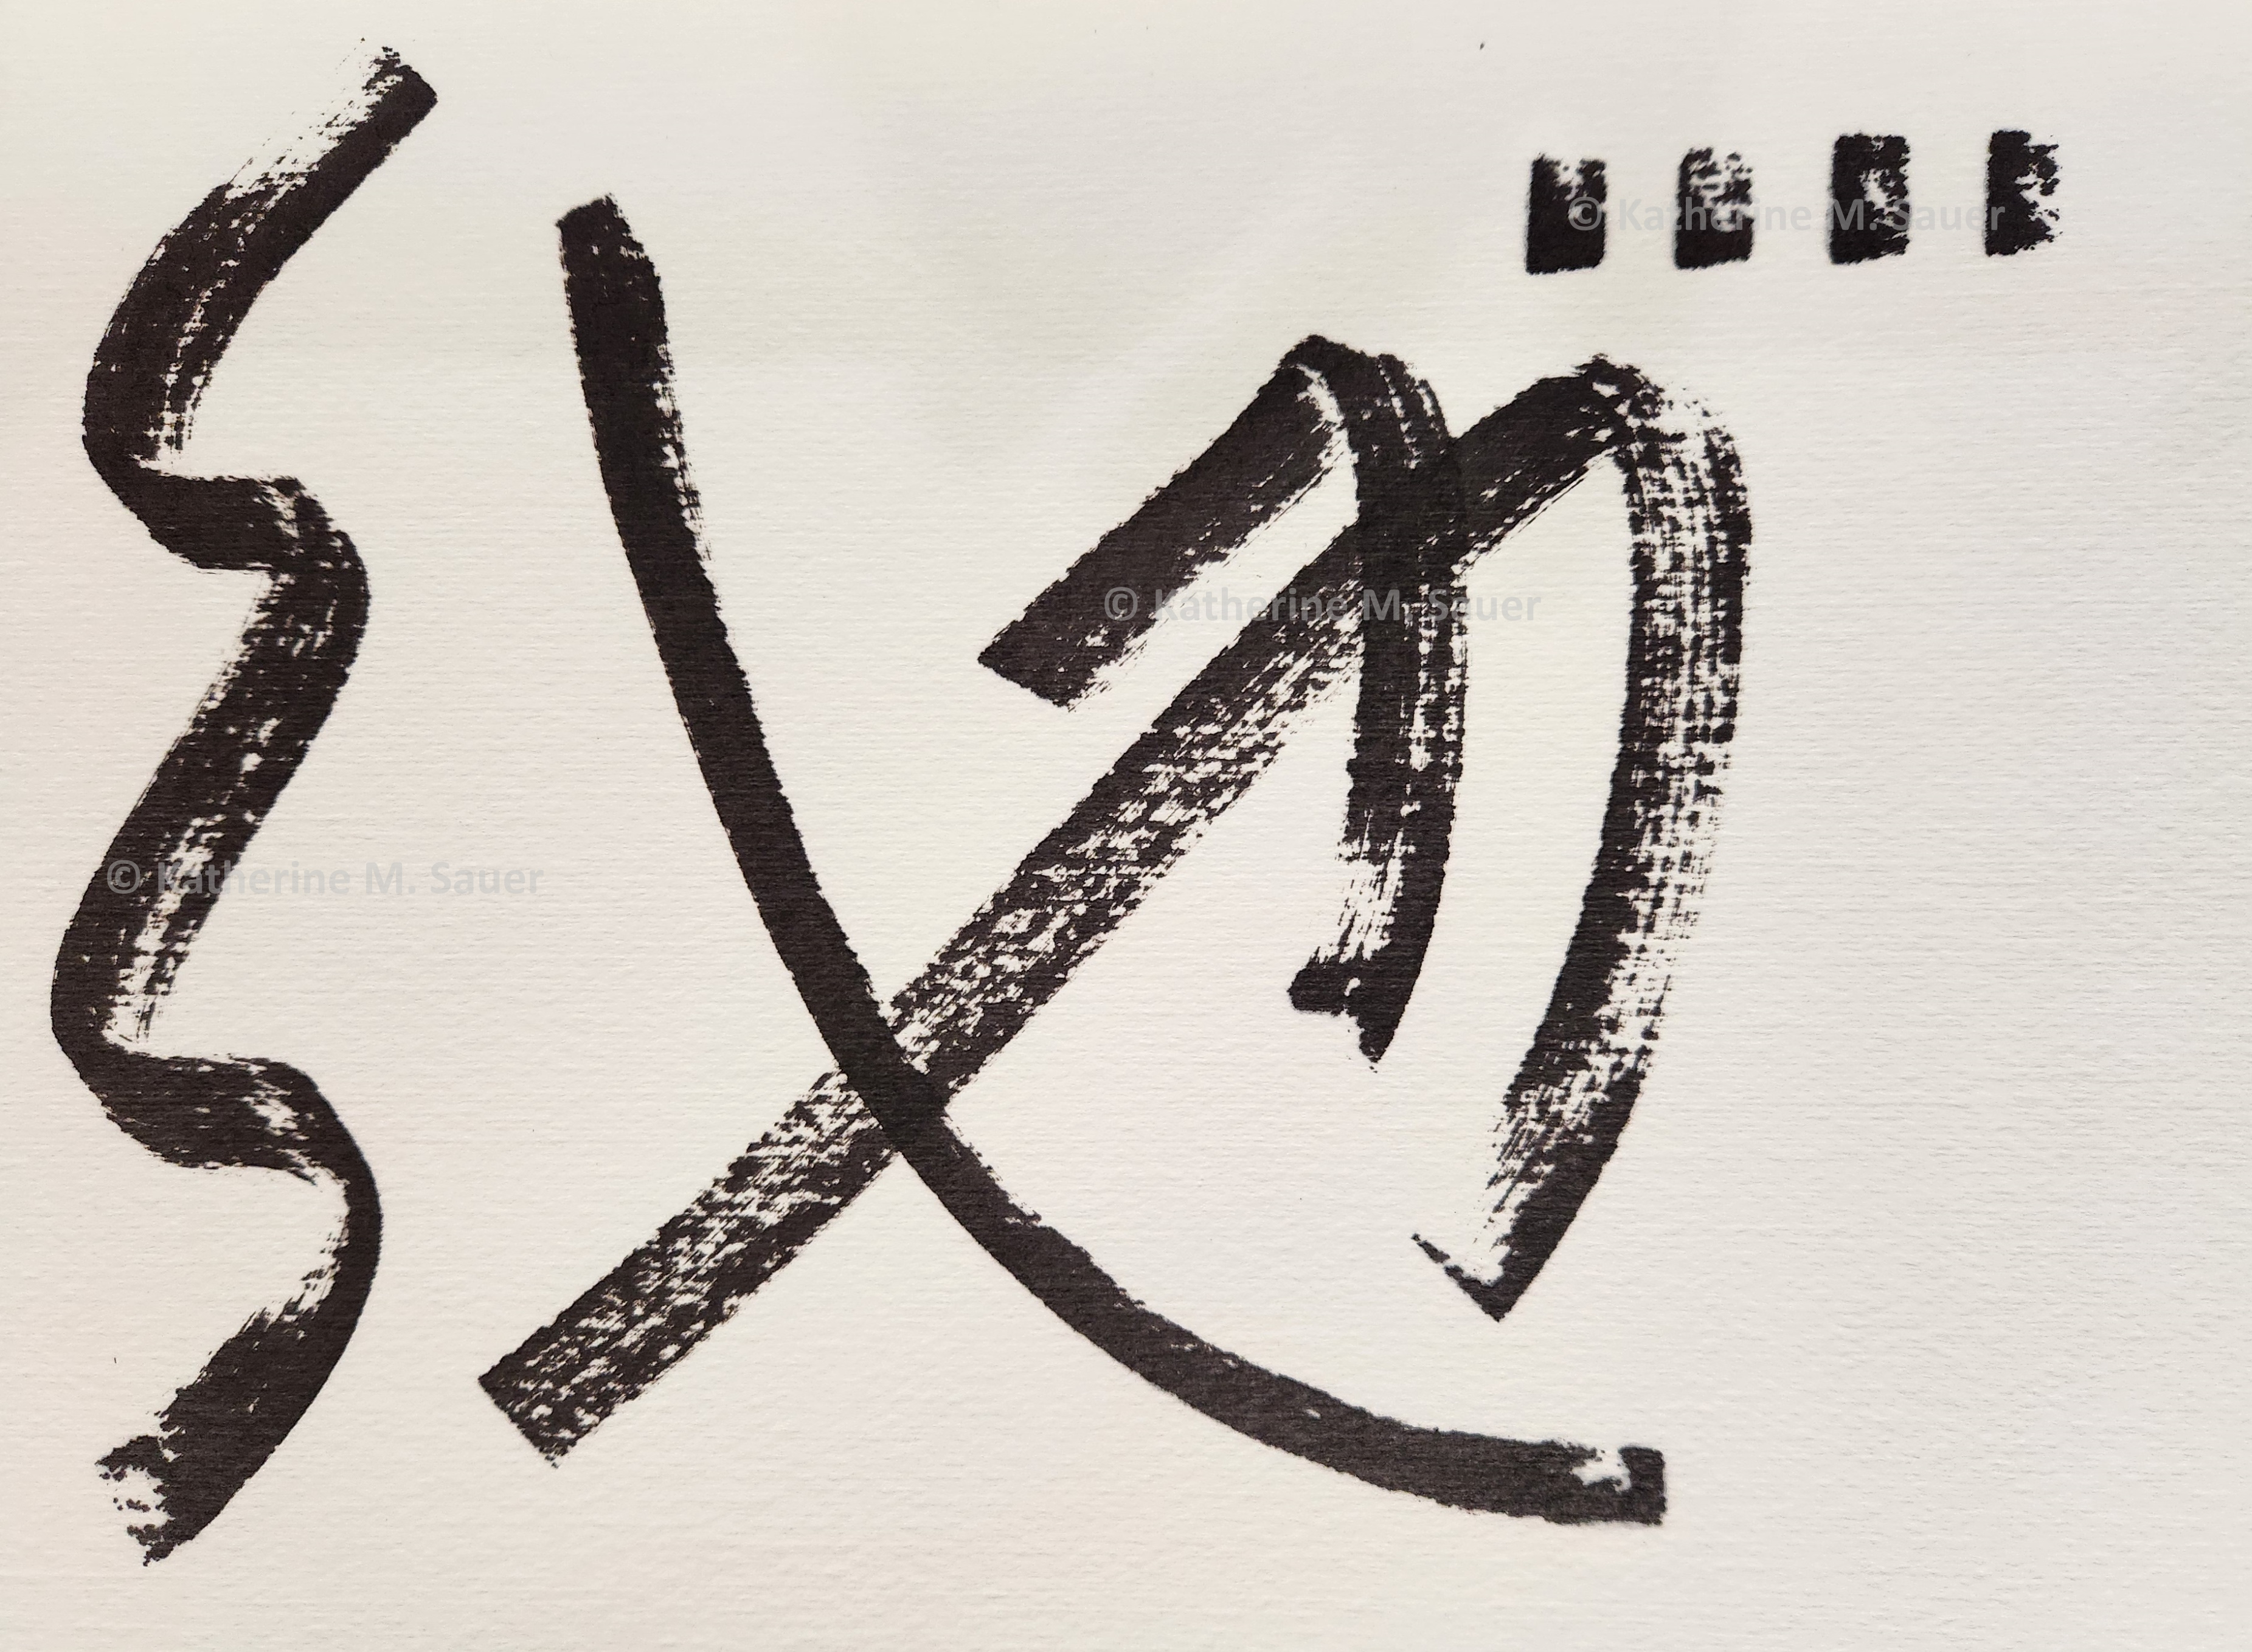
each 5.5" x 4.25" | acrylic on everyday, ligthweight cardstock
This 4-piece series is born of unscripted expression while using up the last bits of paint in tubes, on paper not intended for a paint medium.
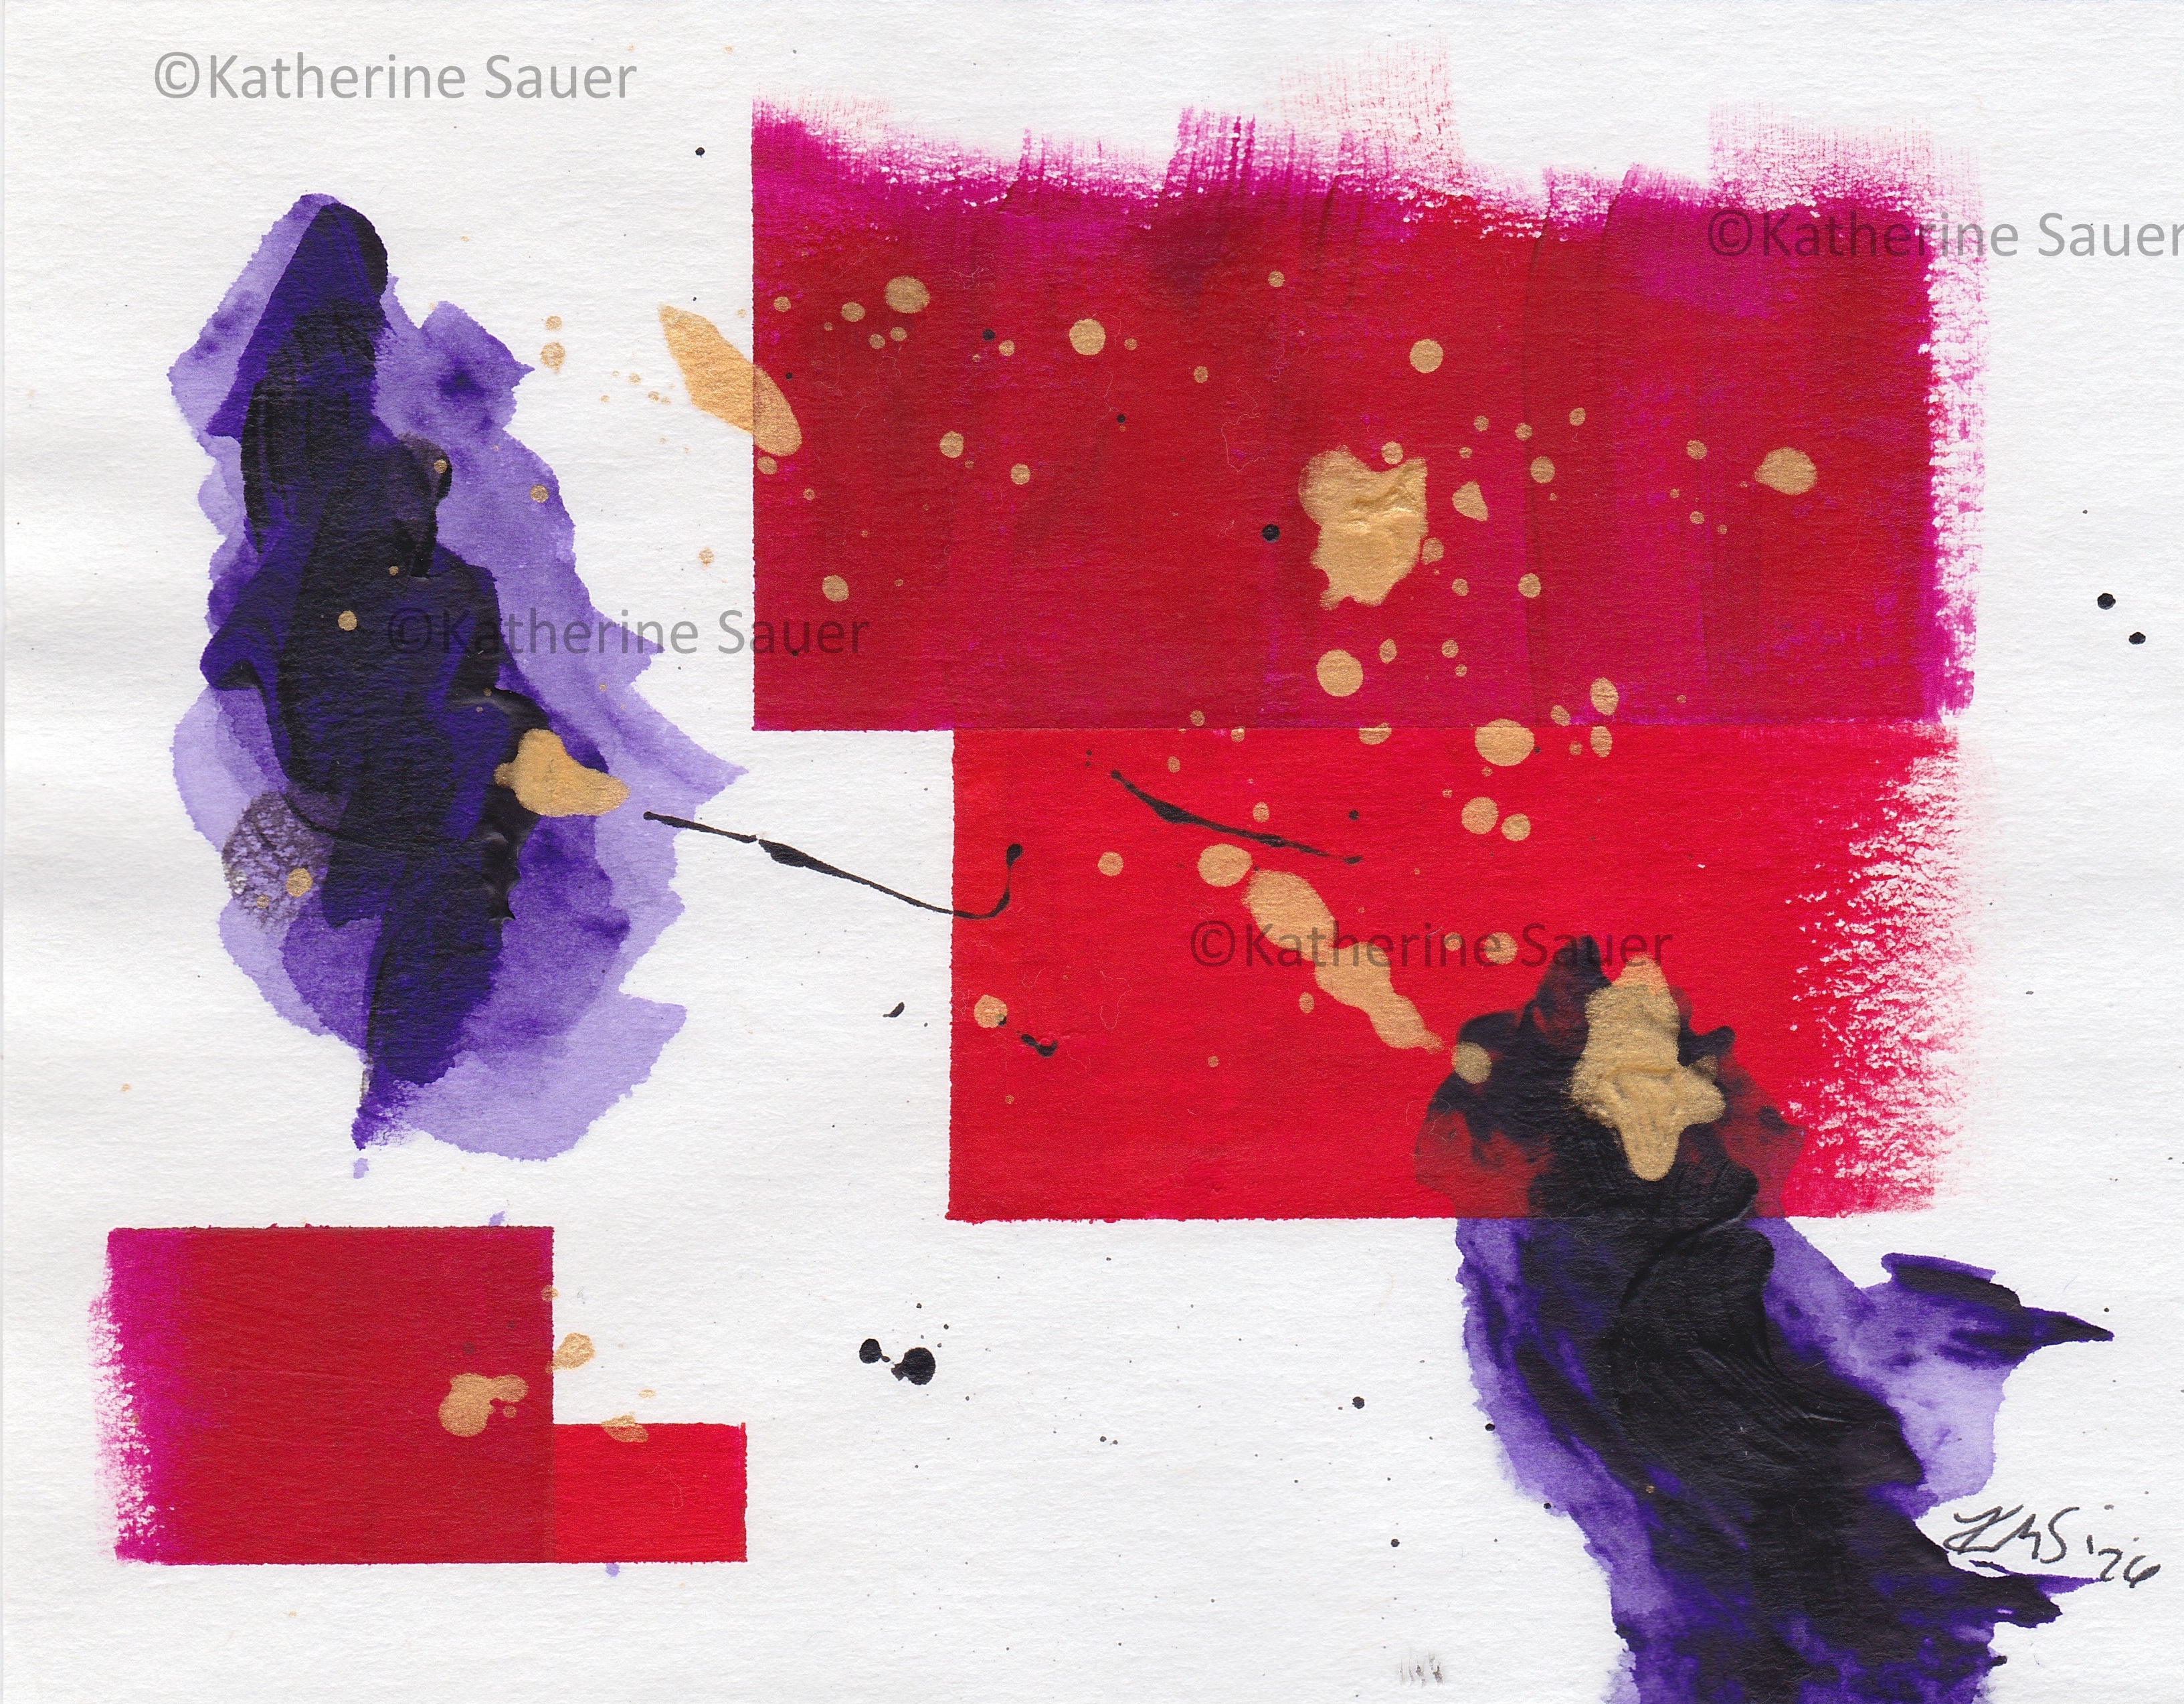
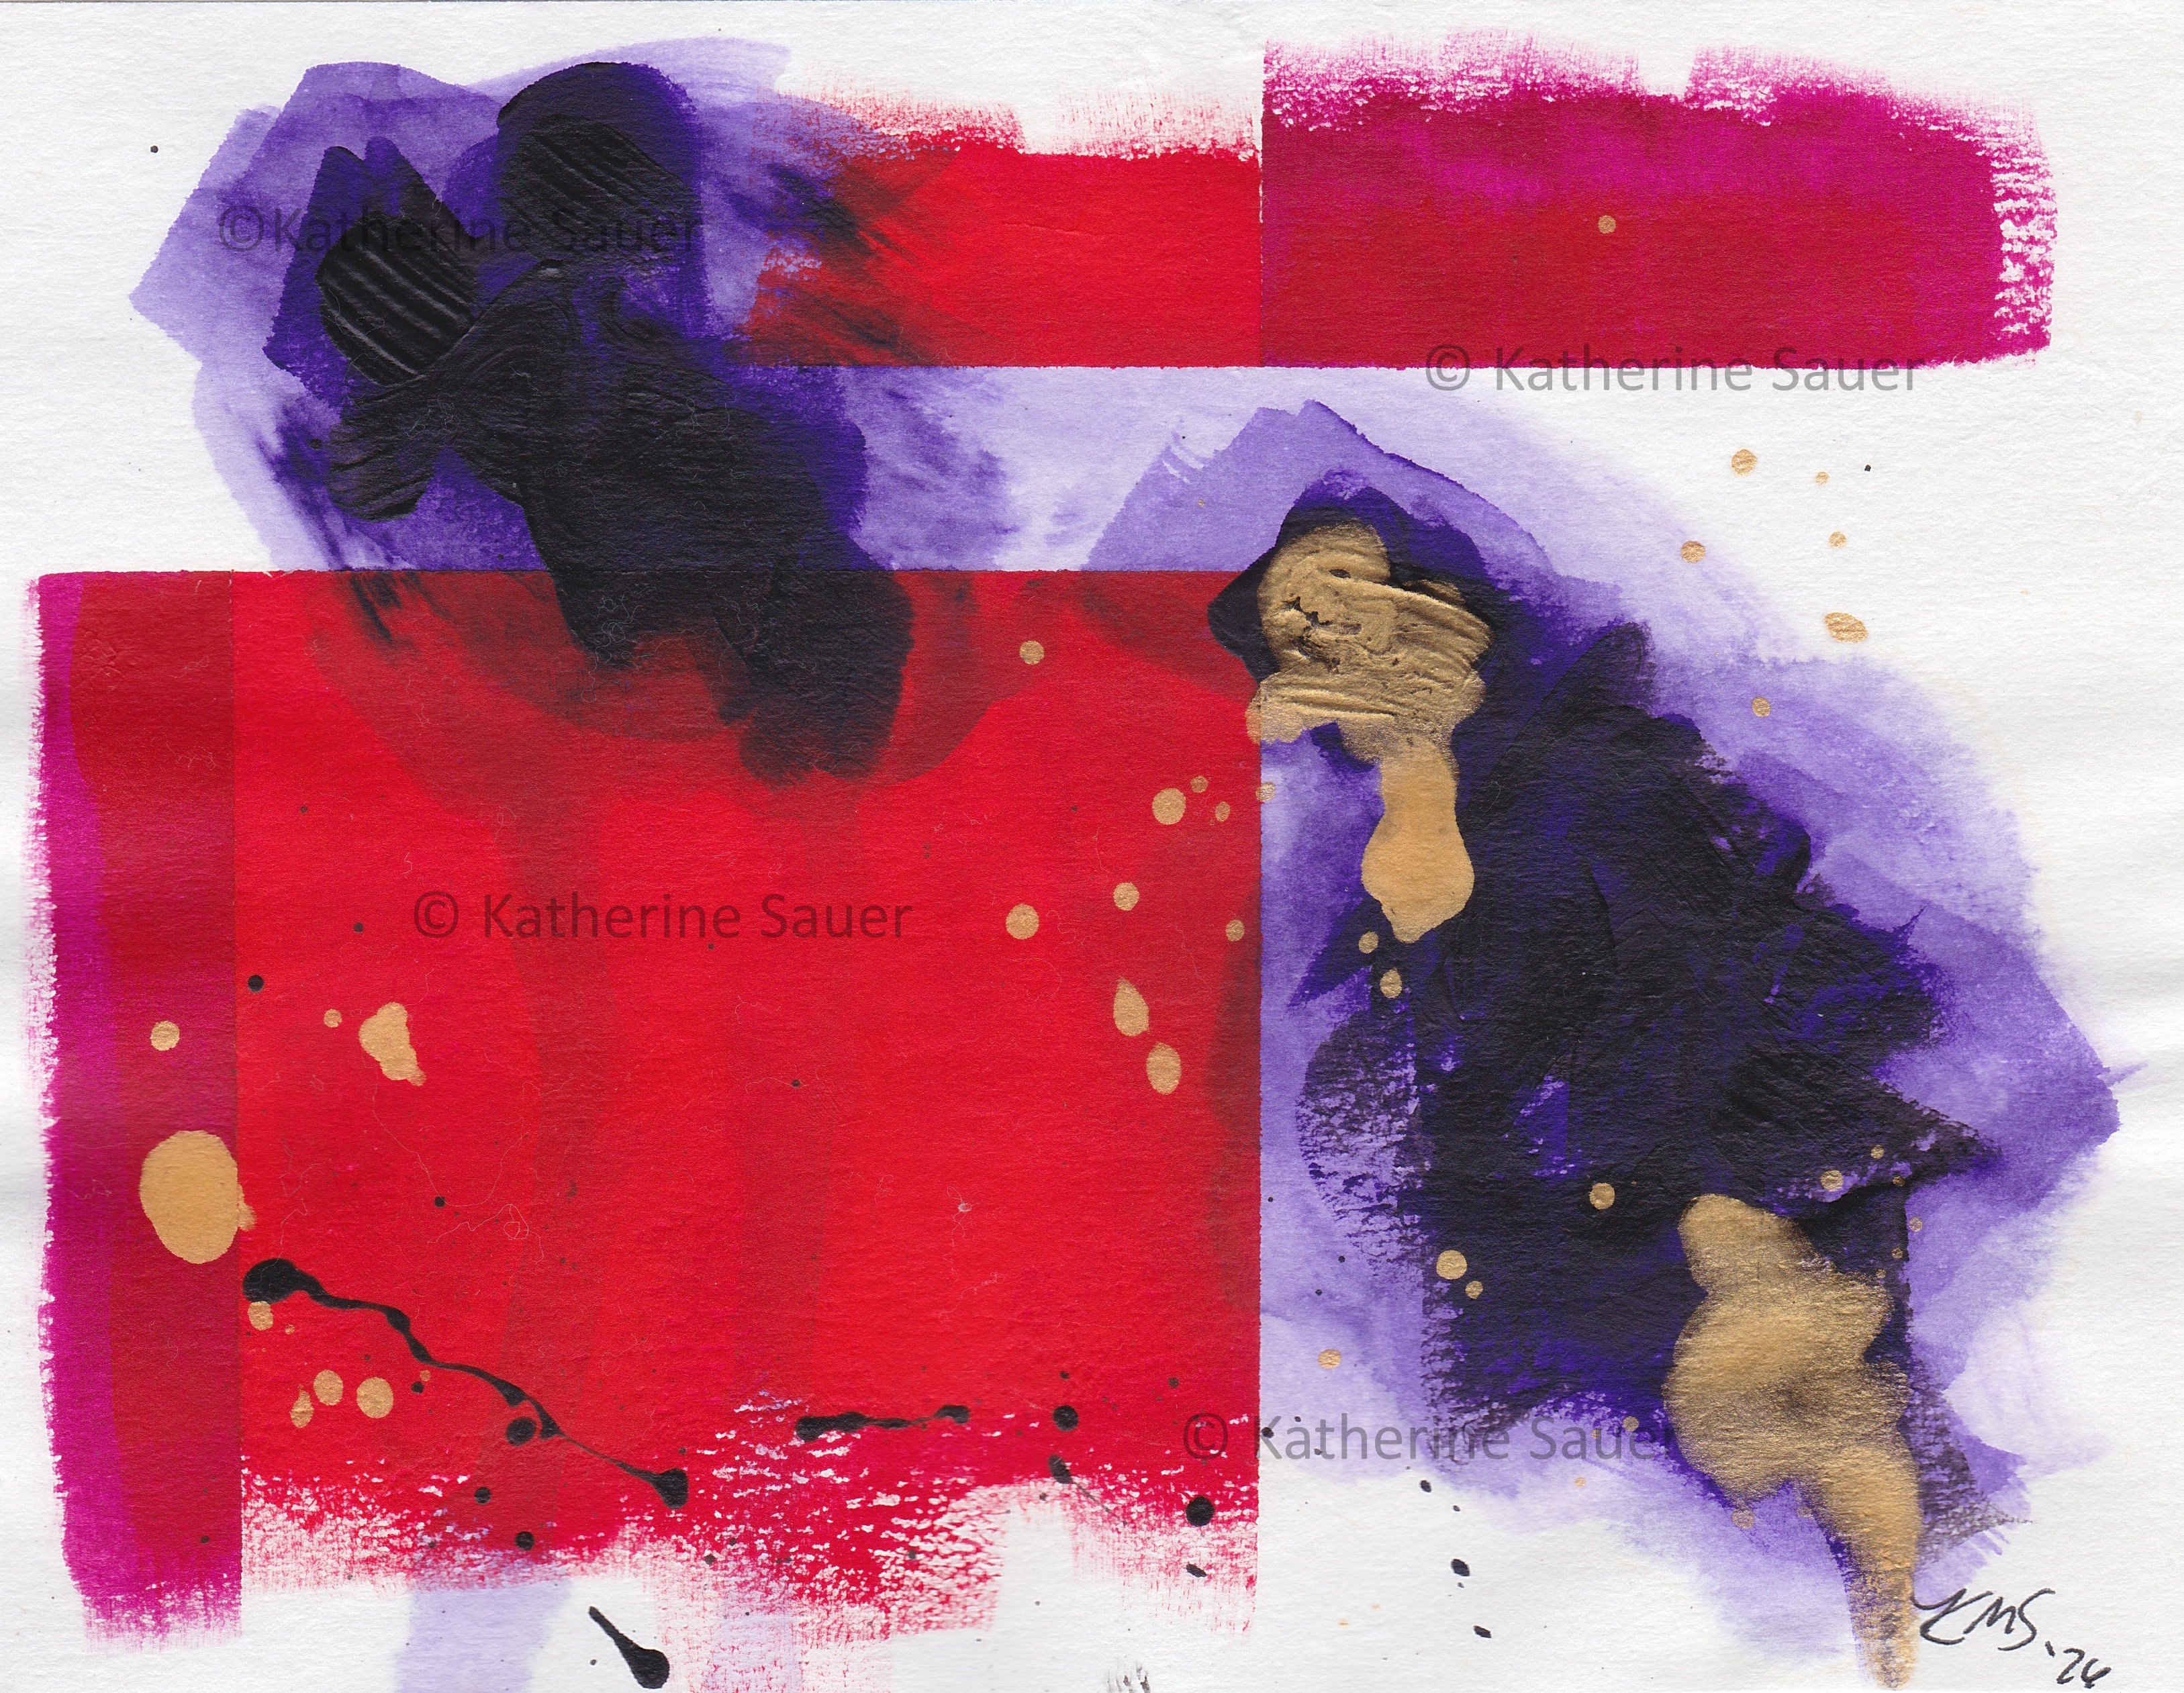
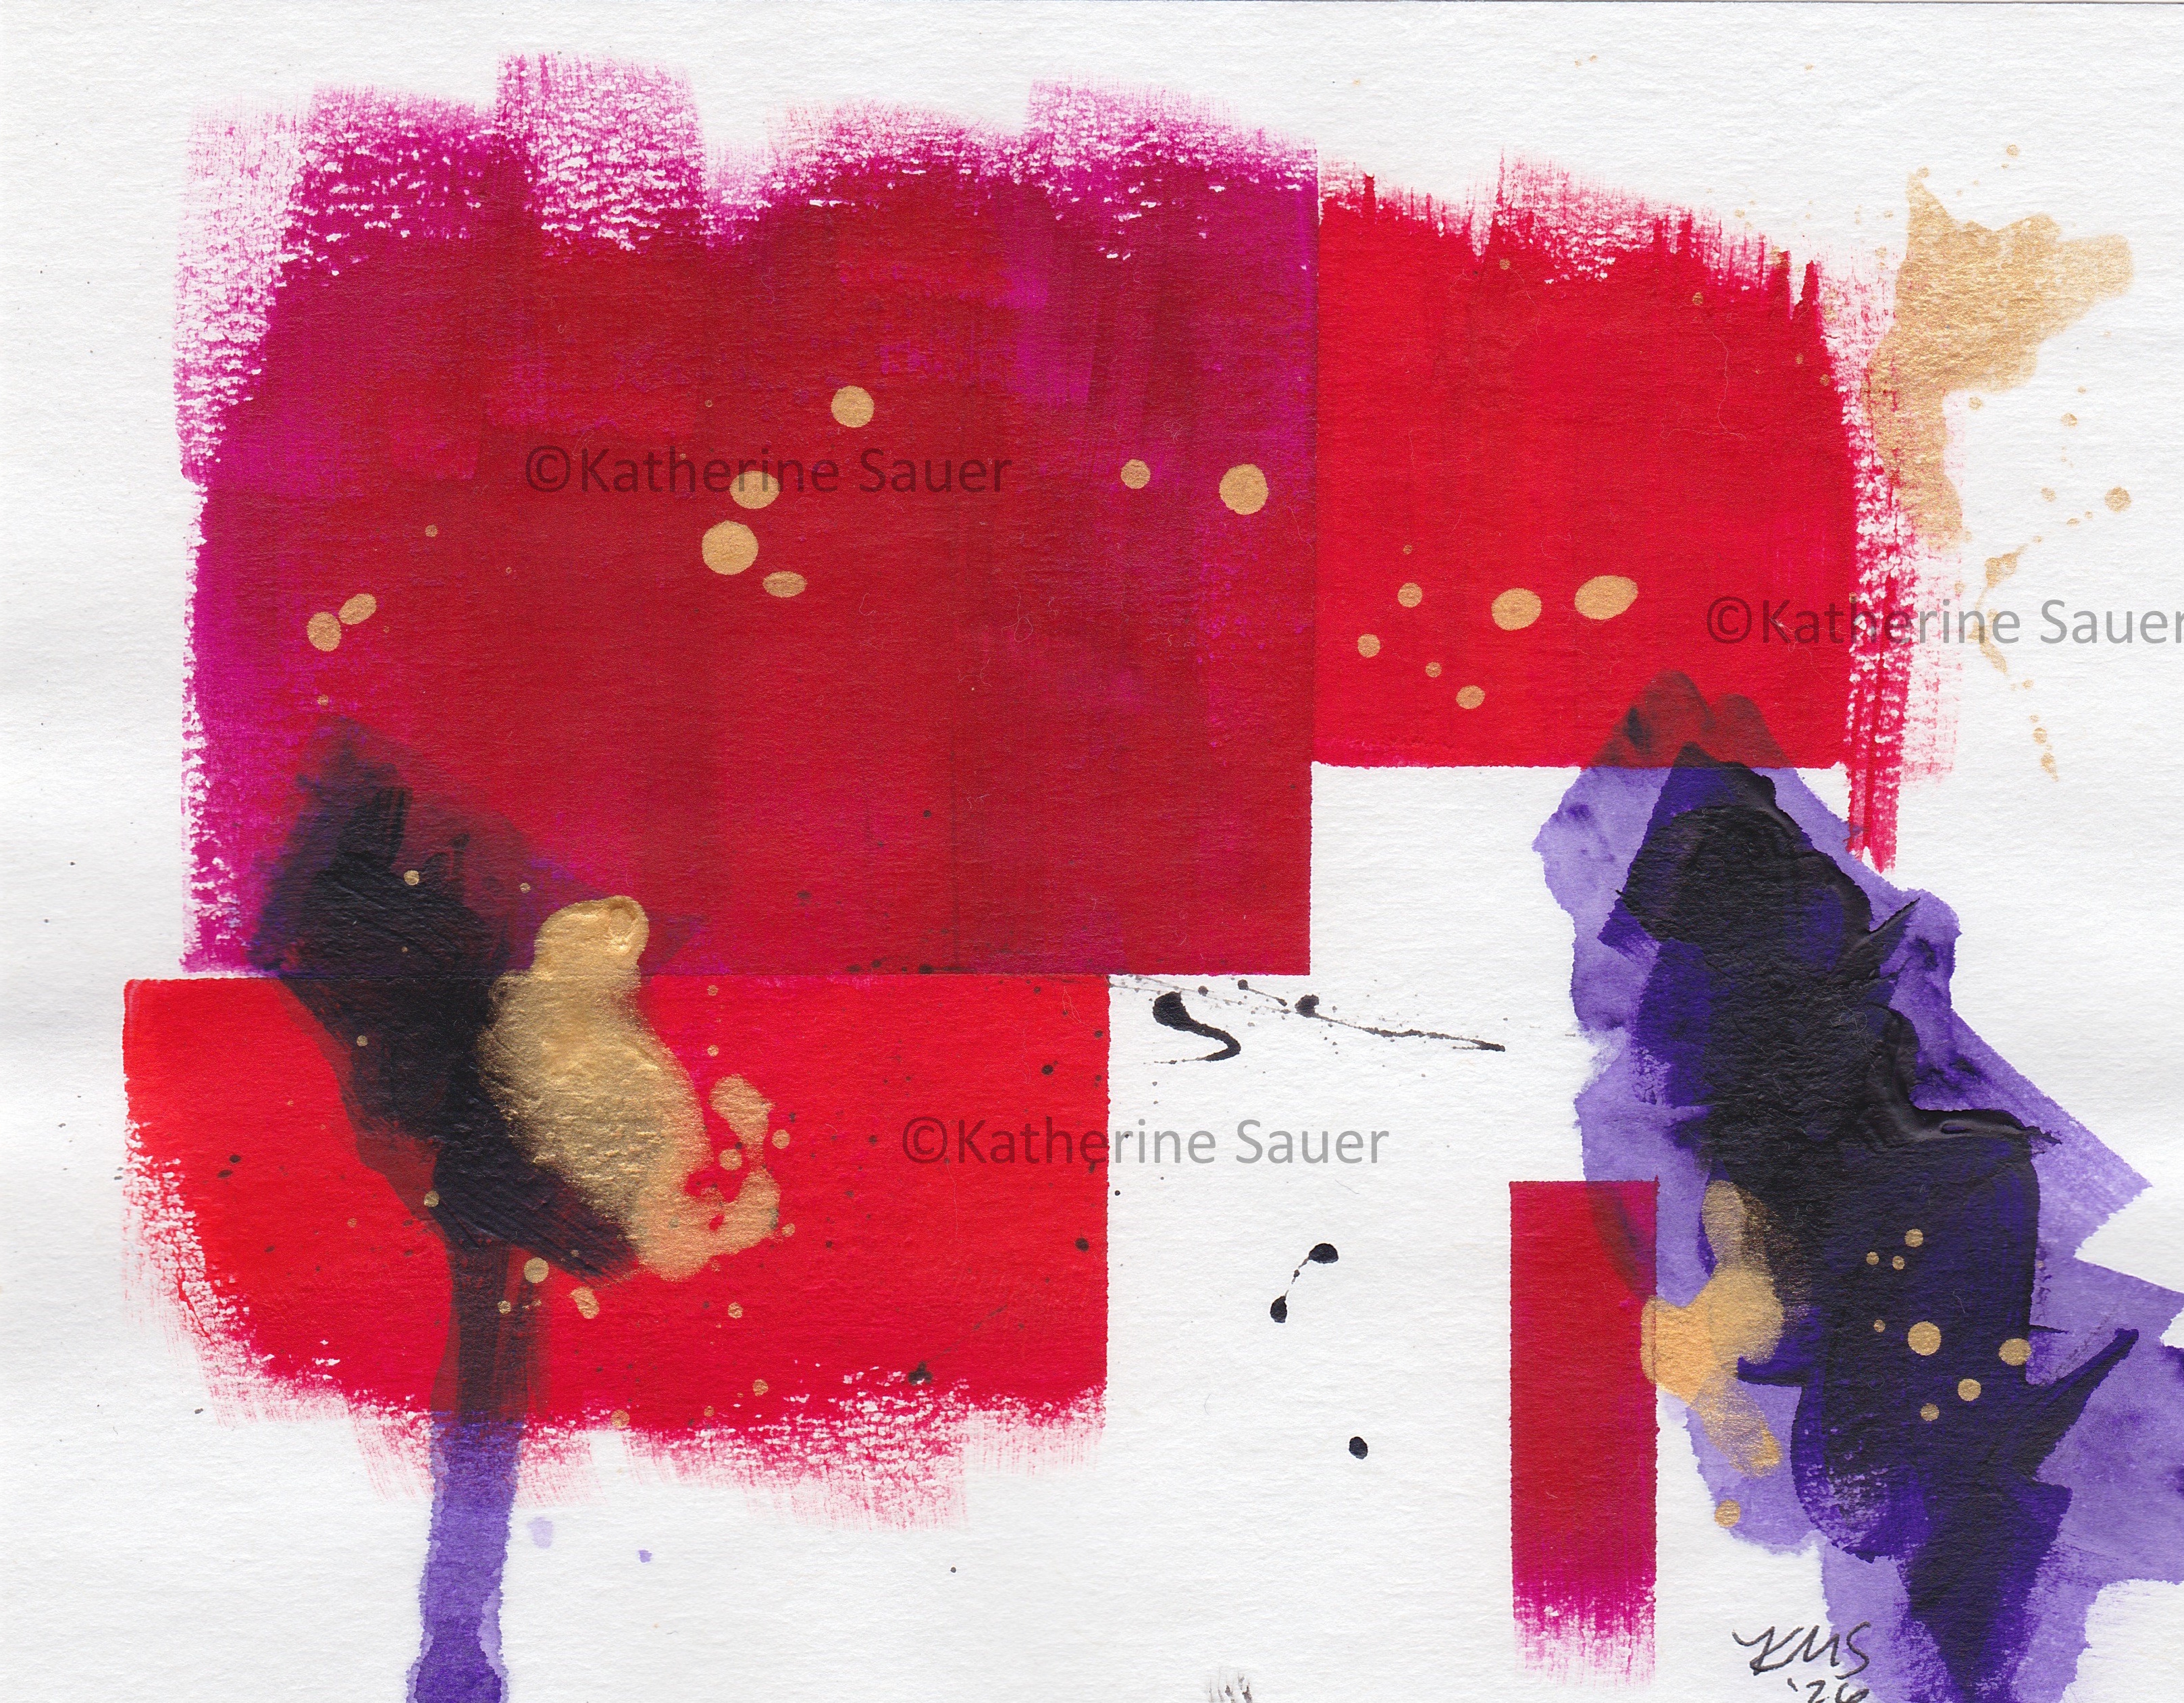
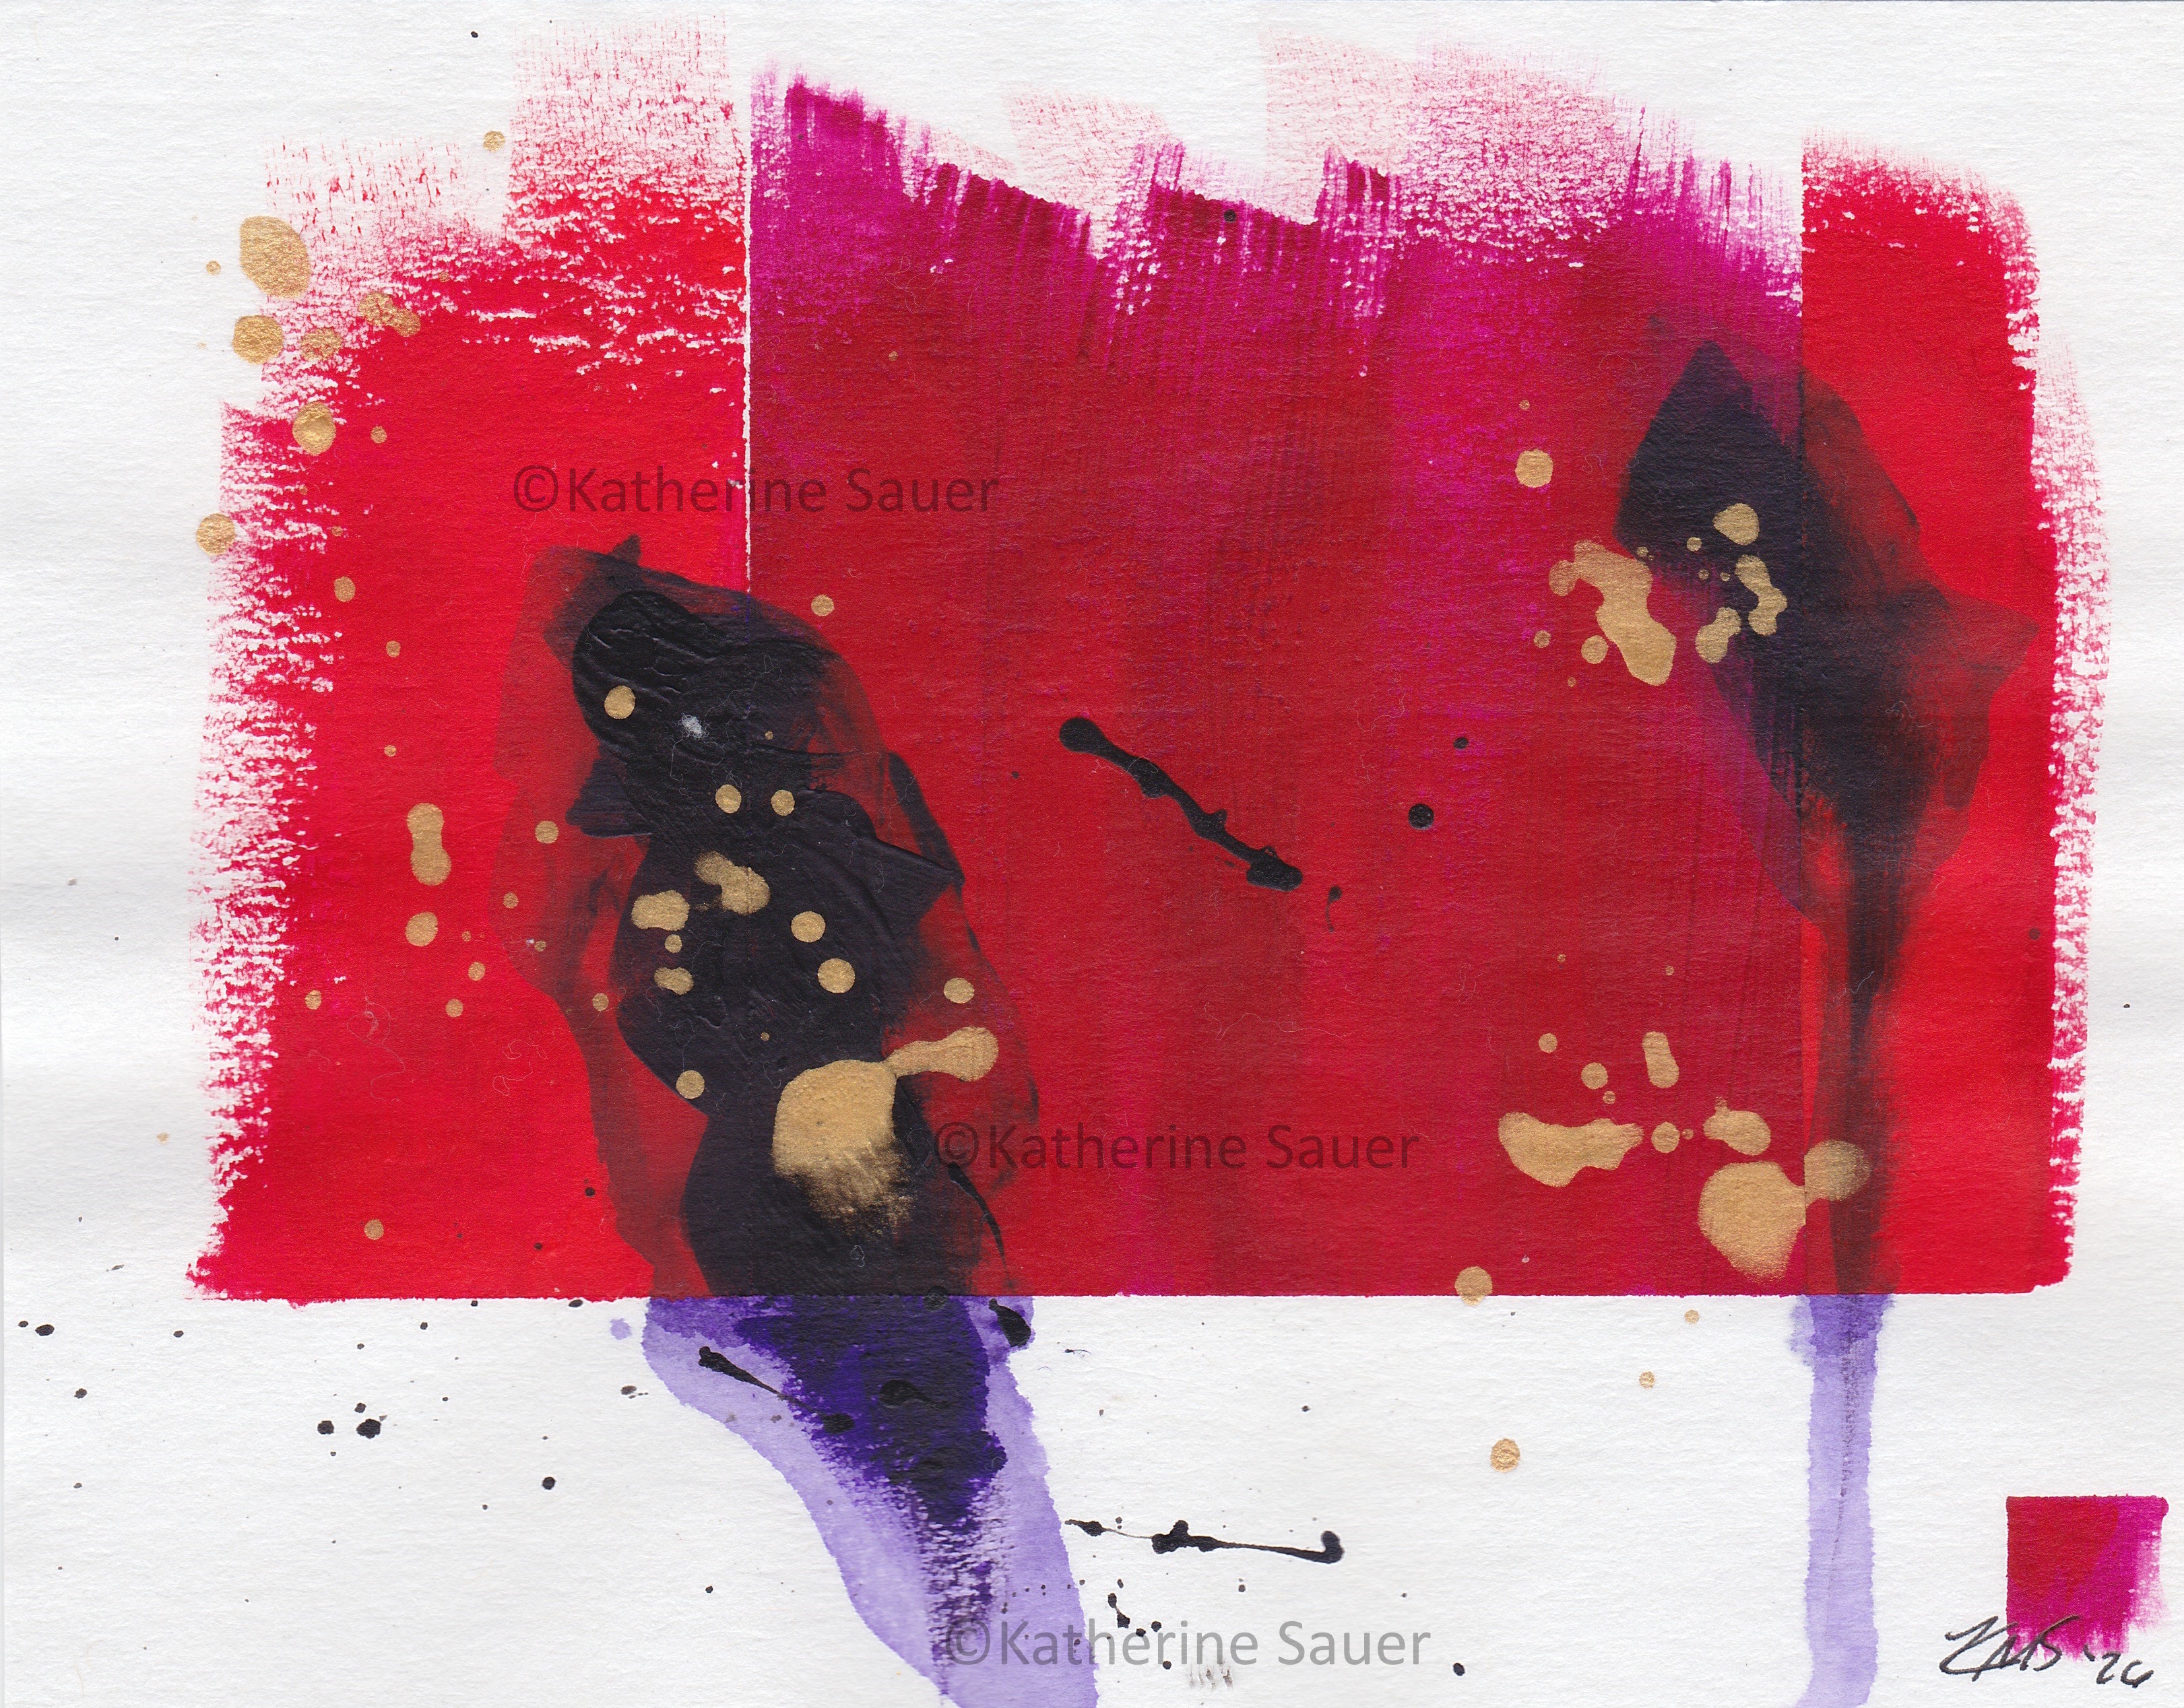
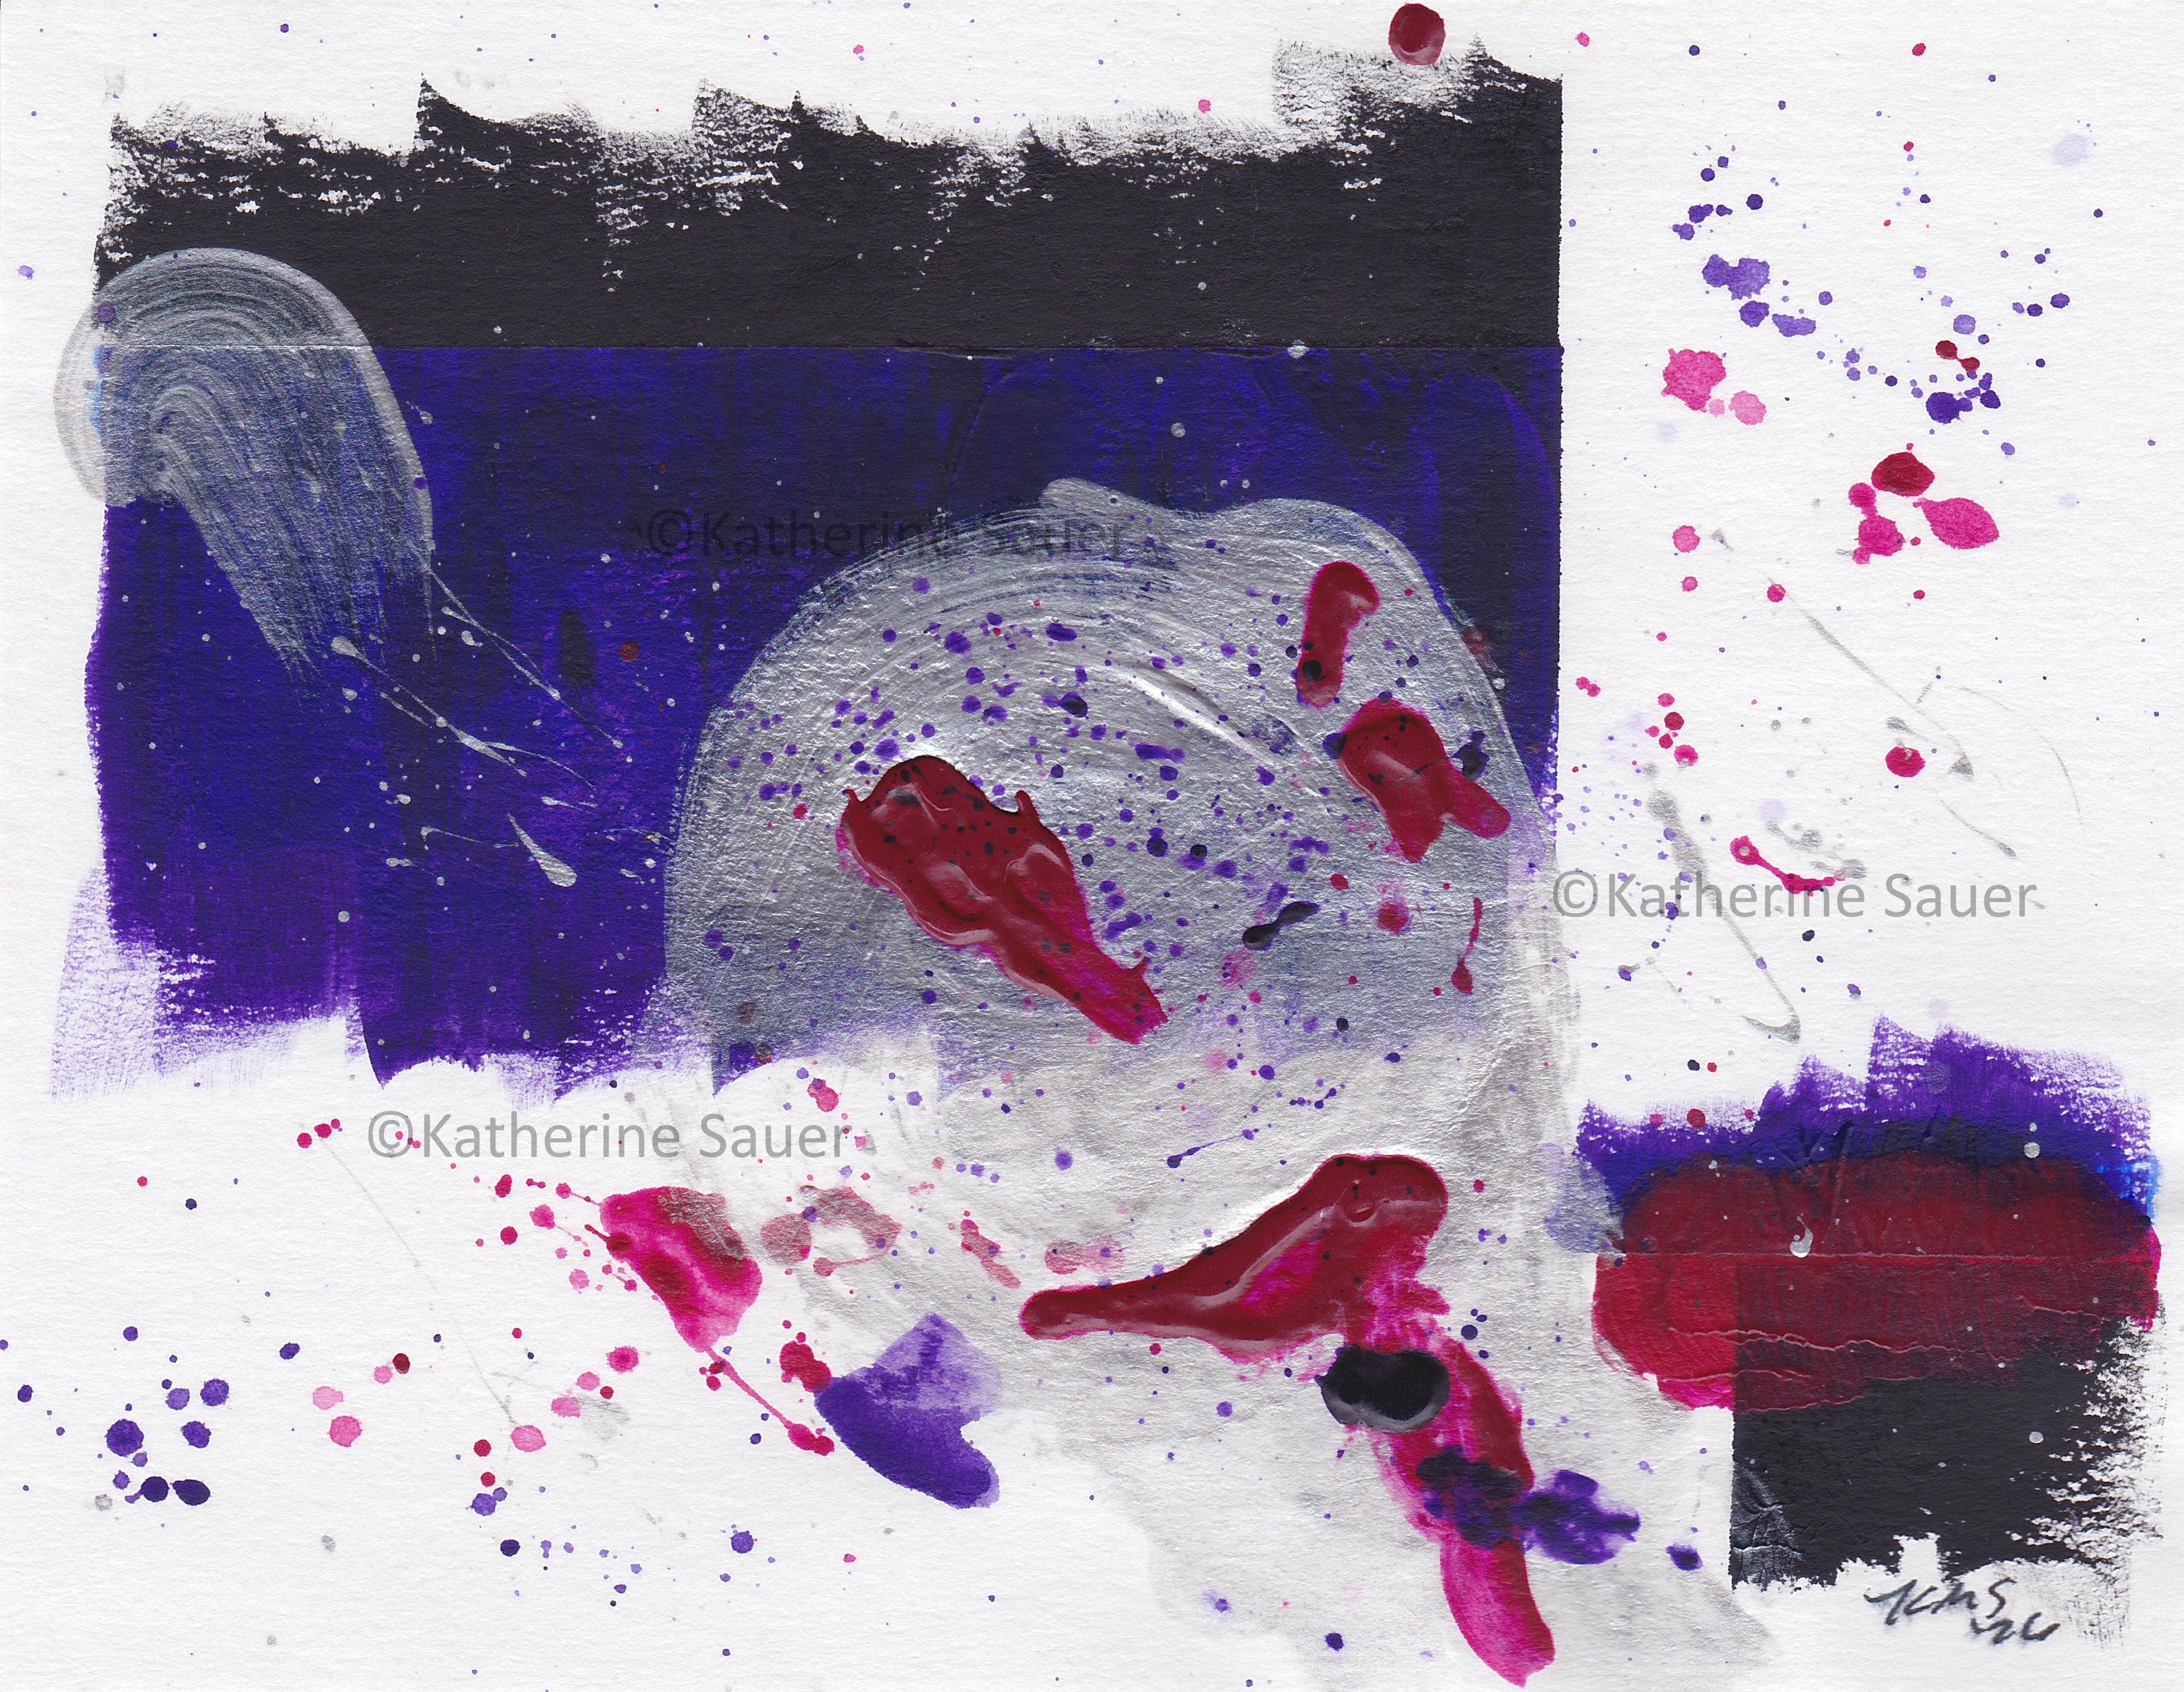
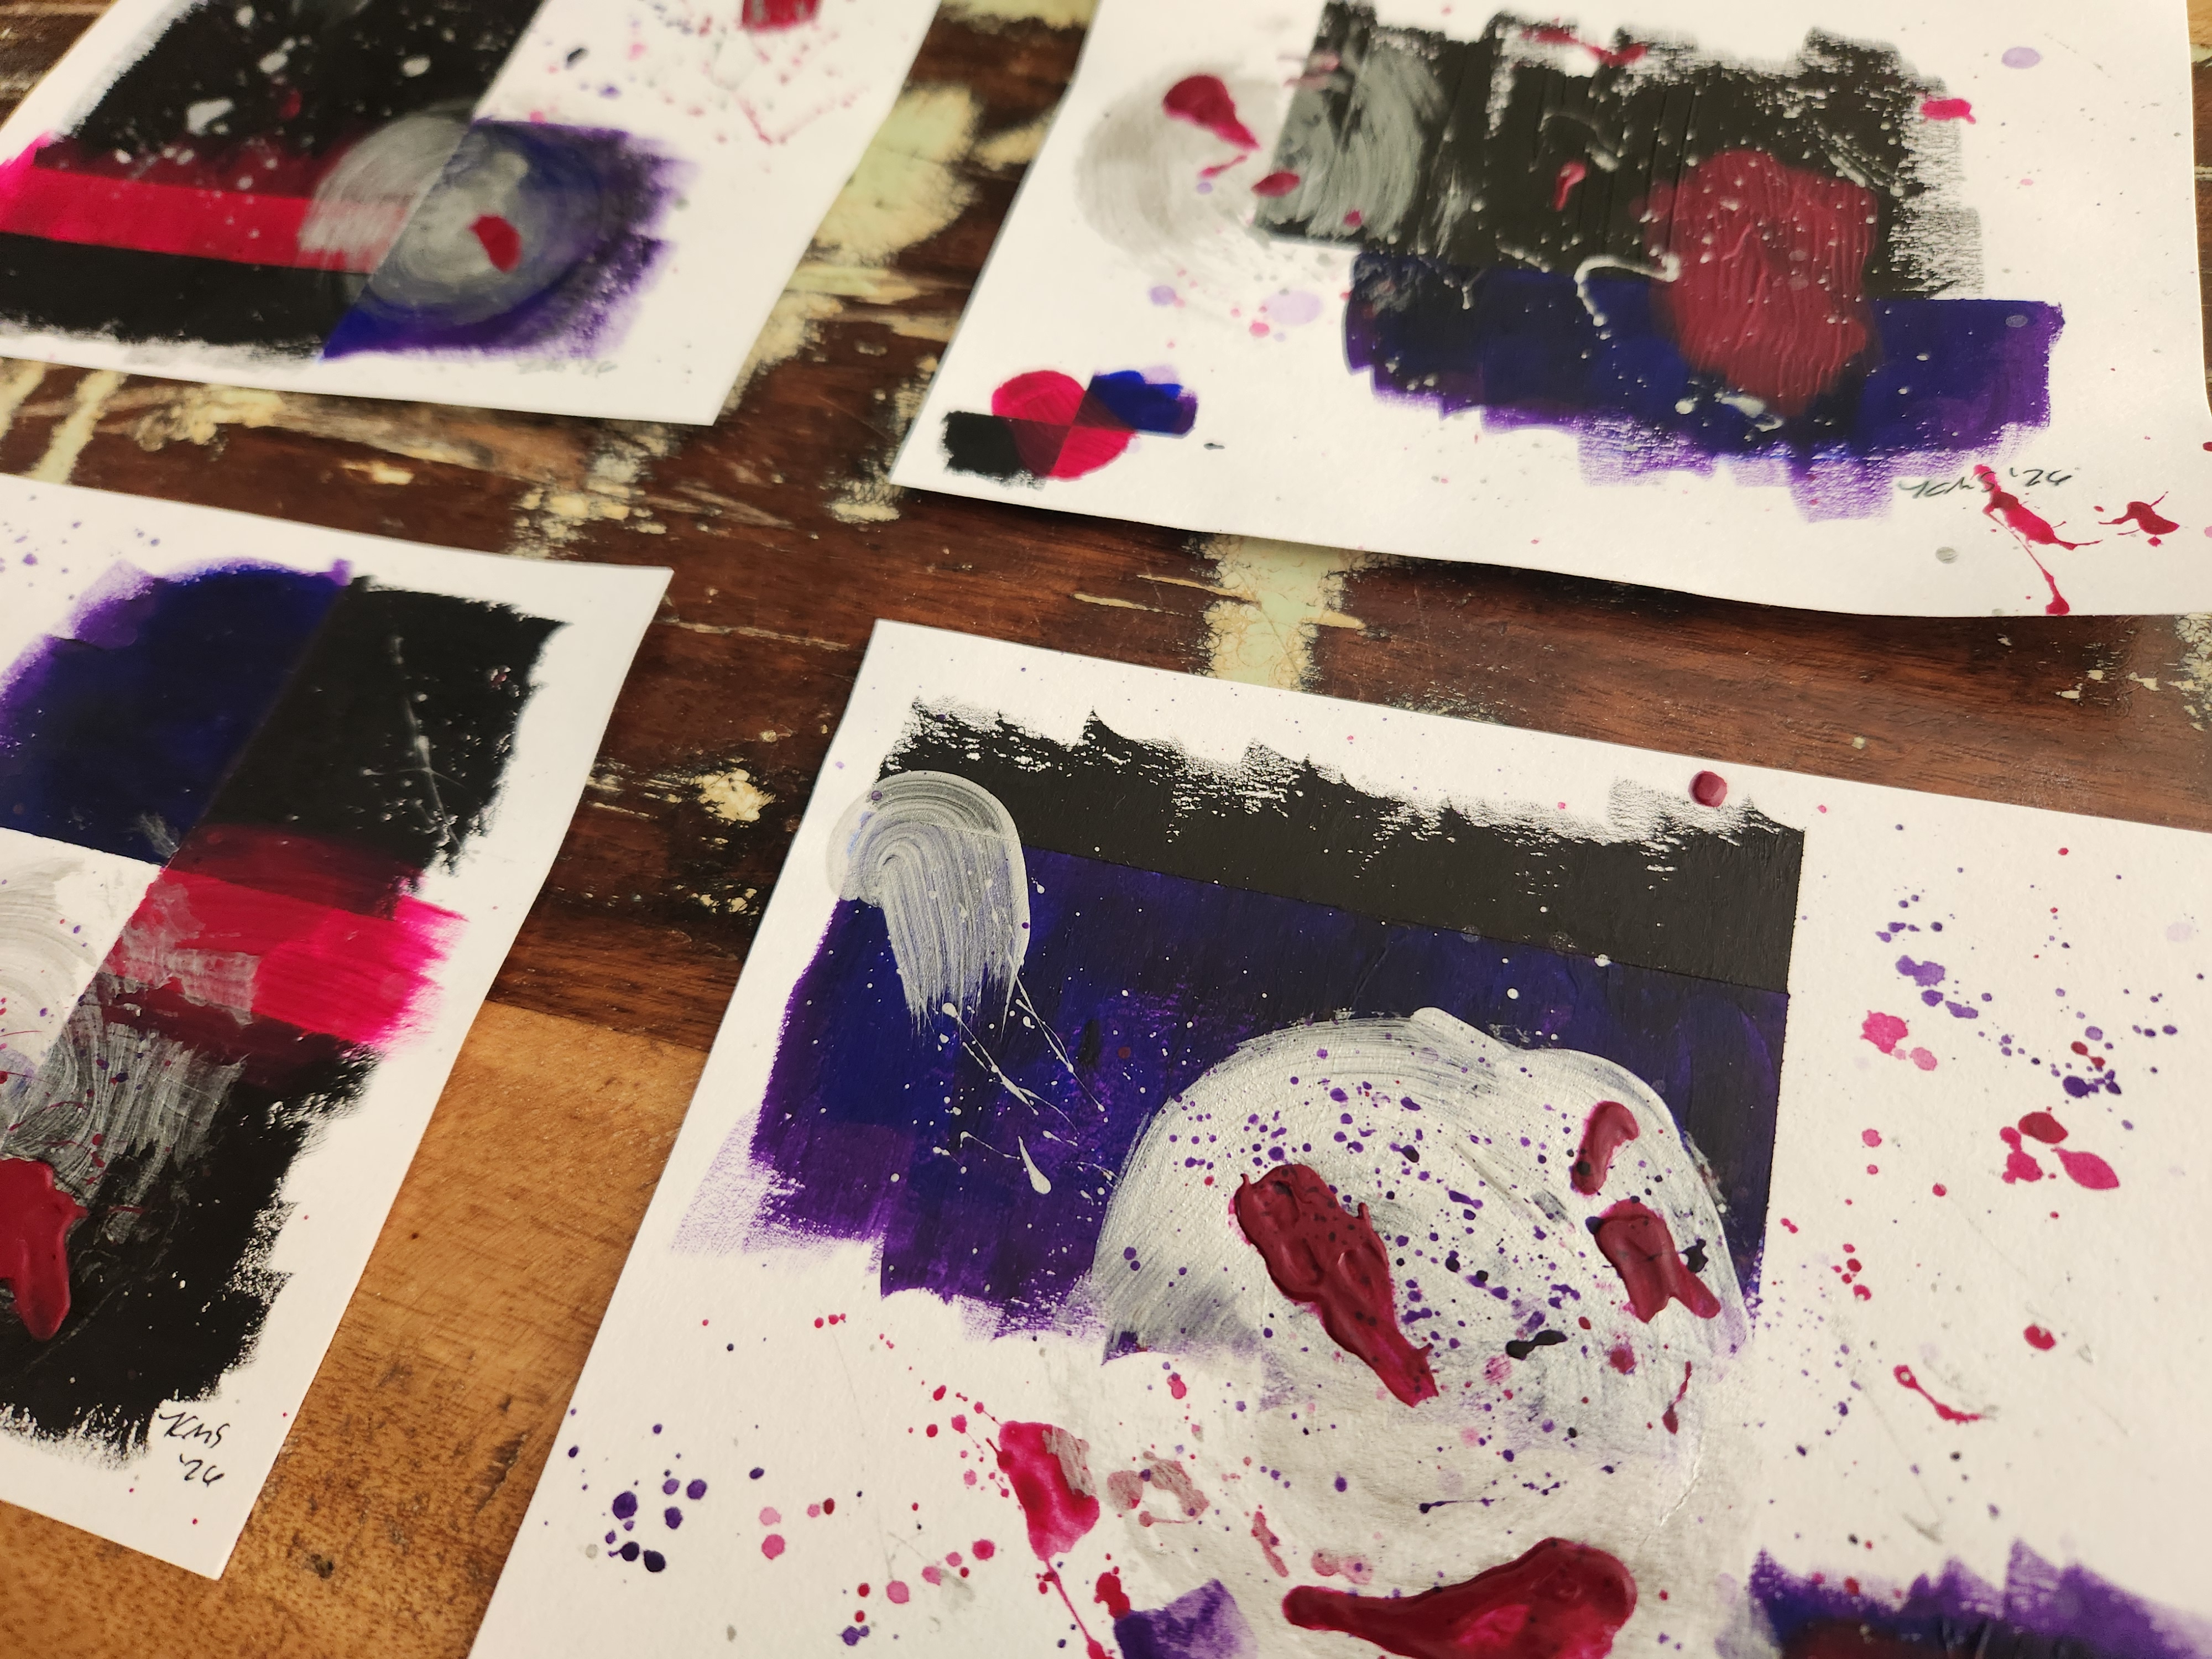
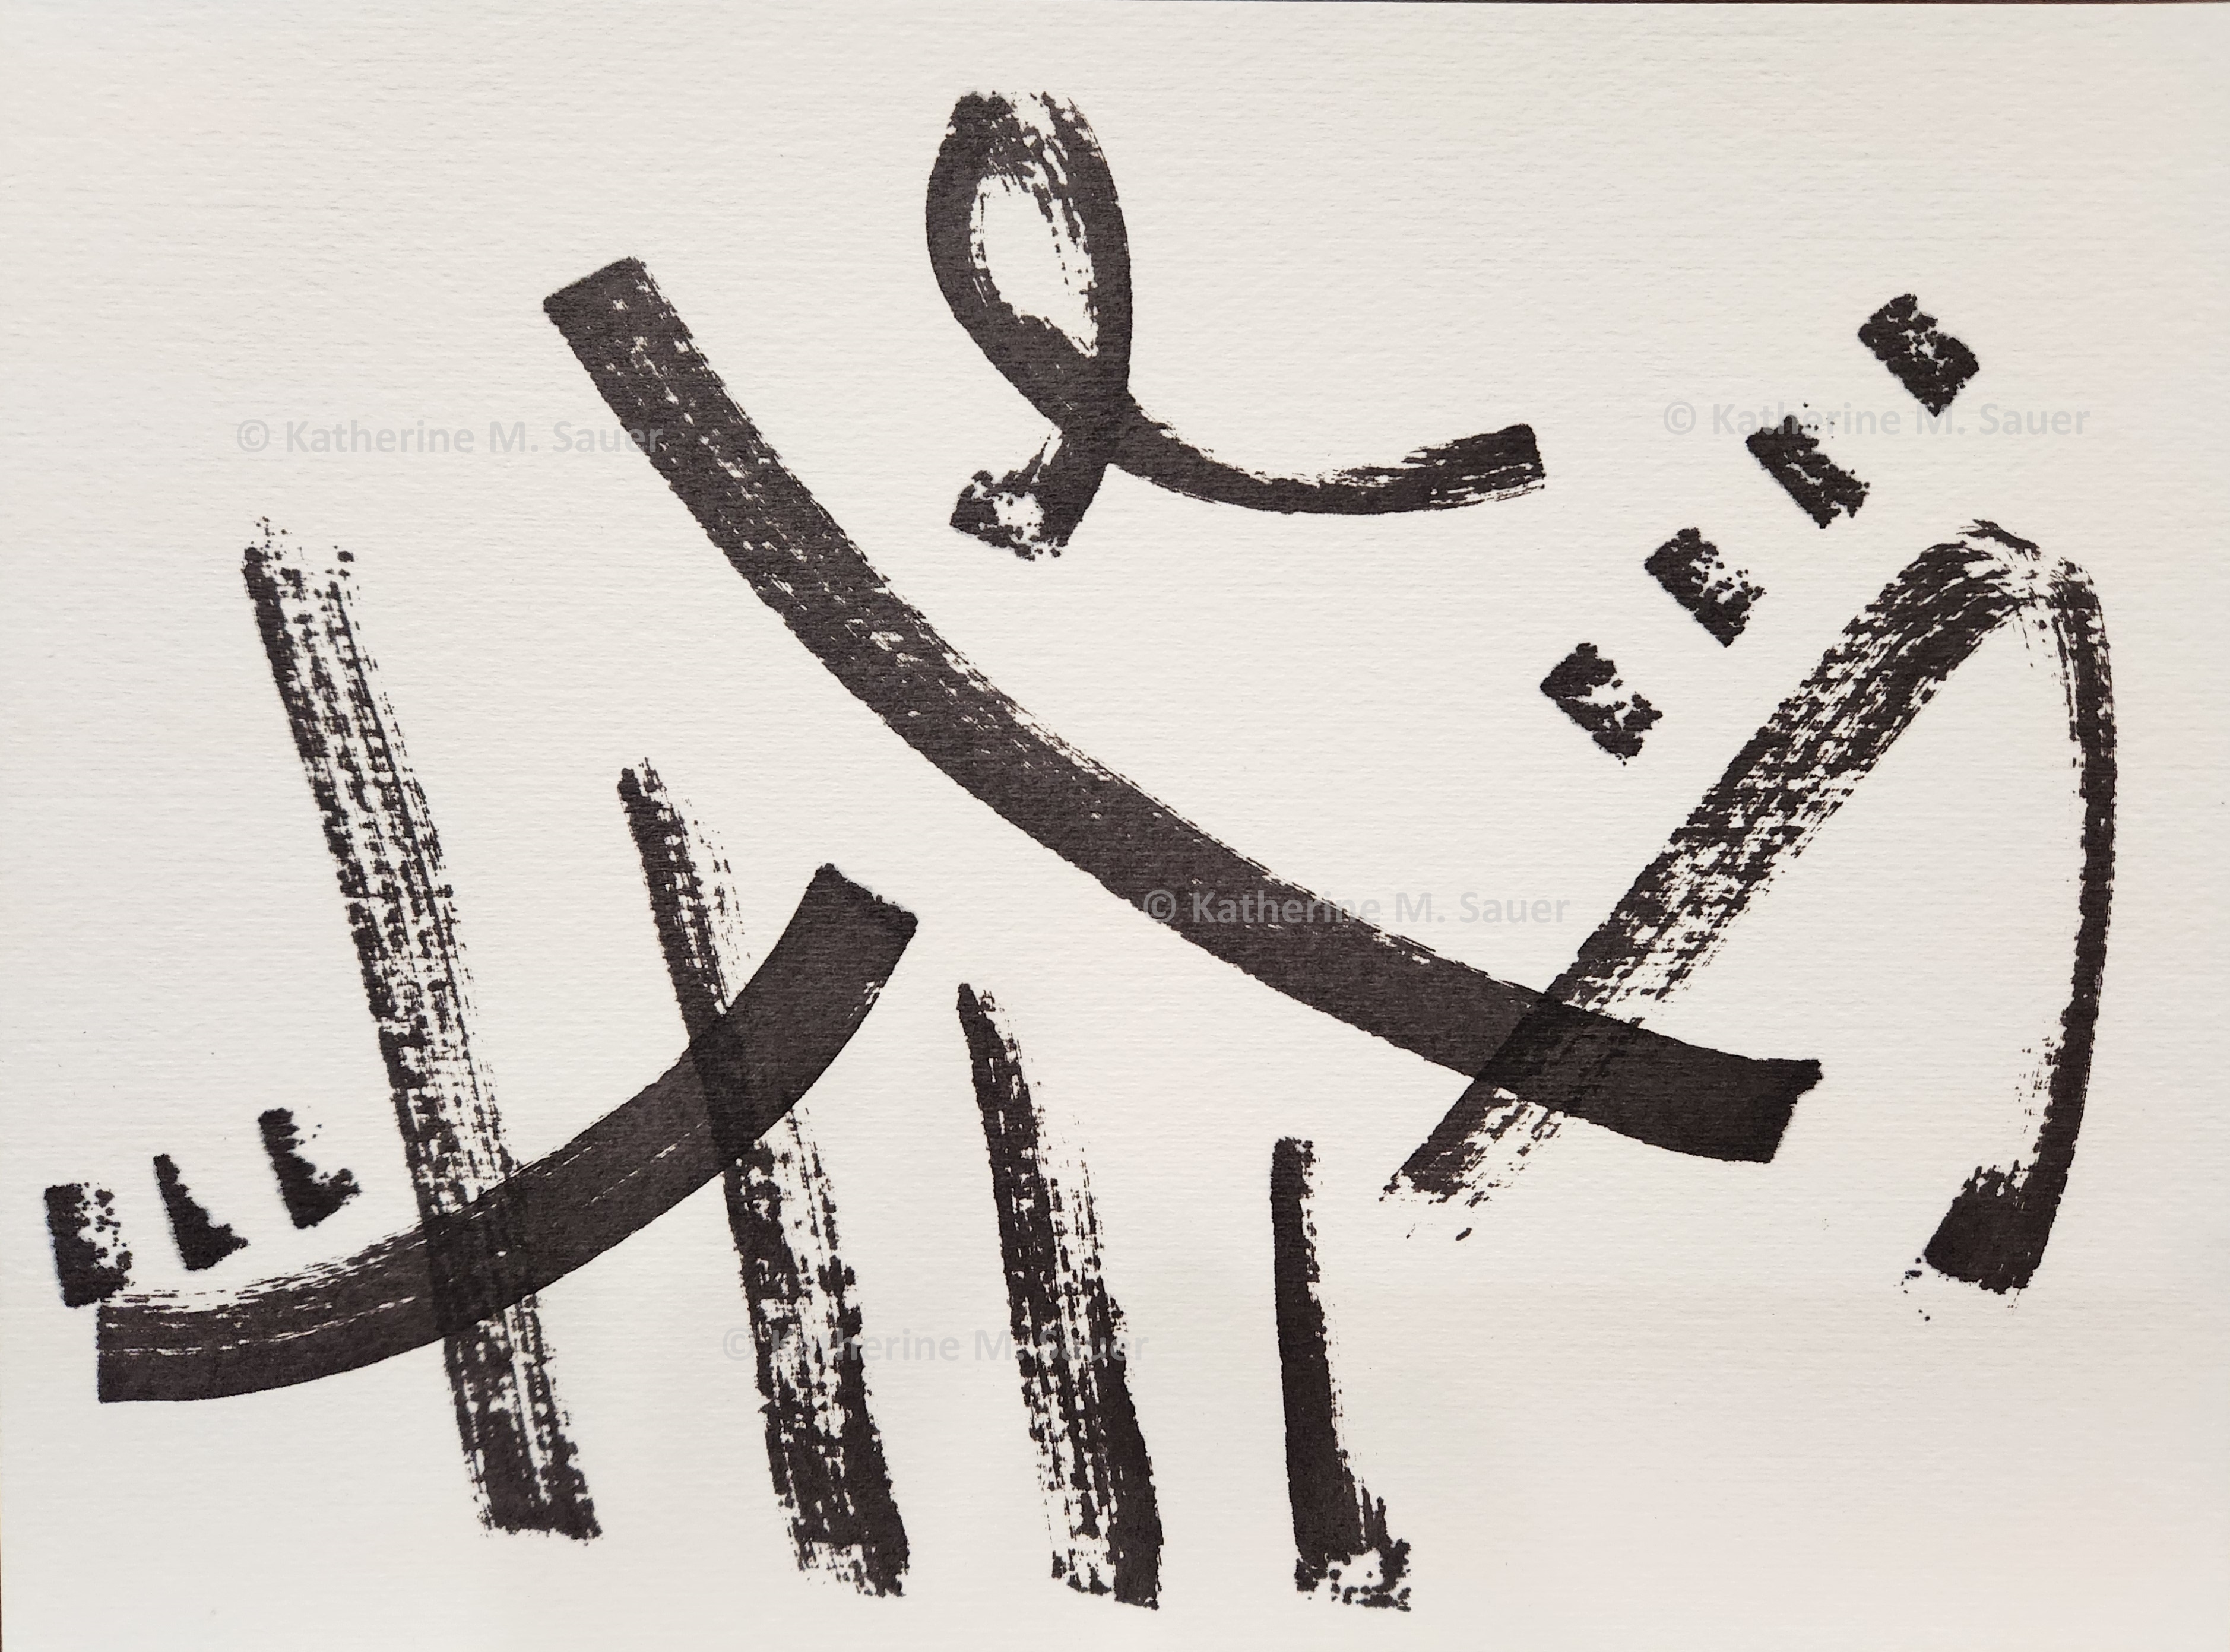
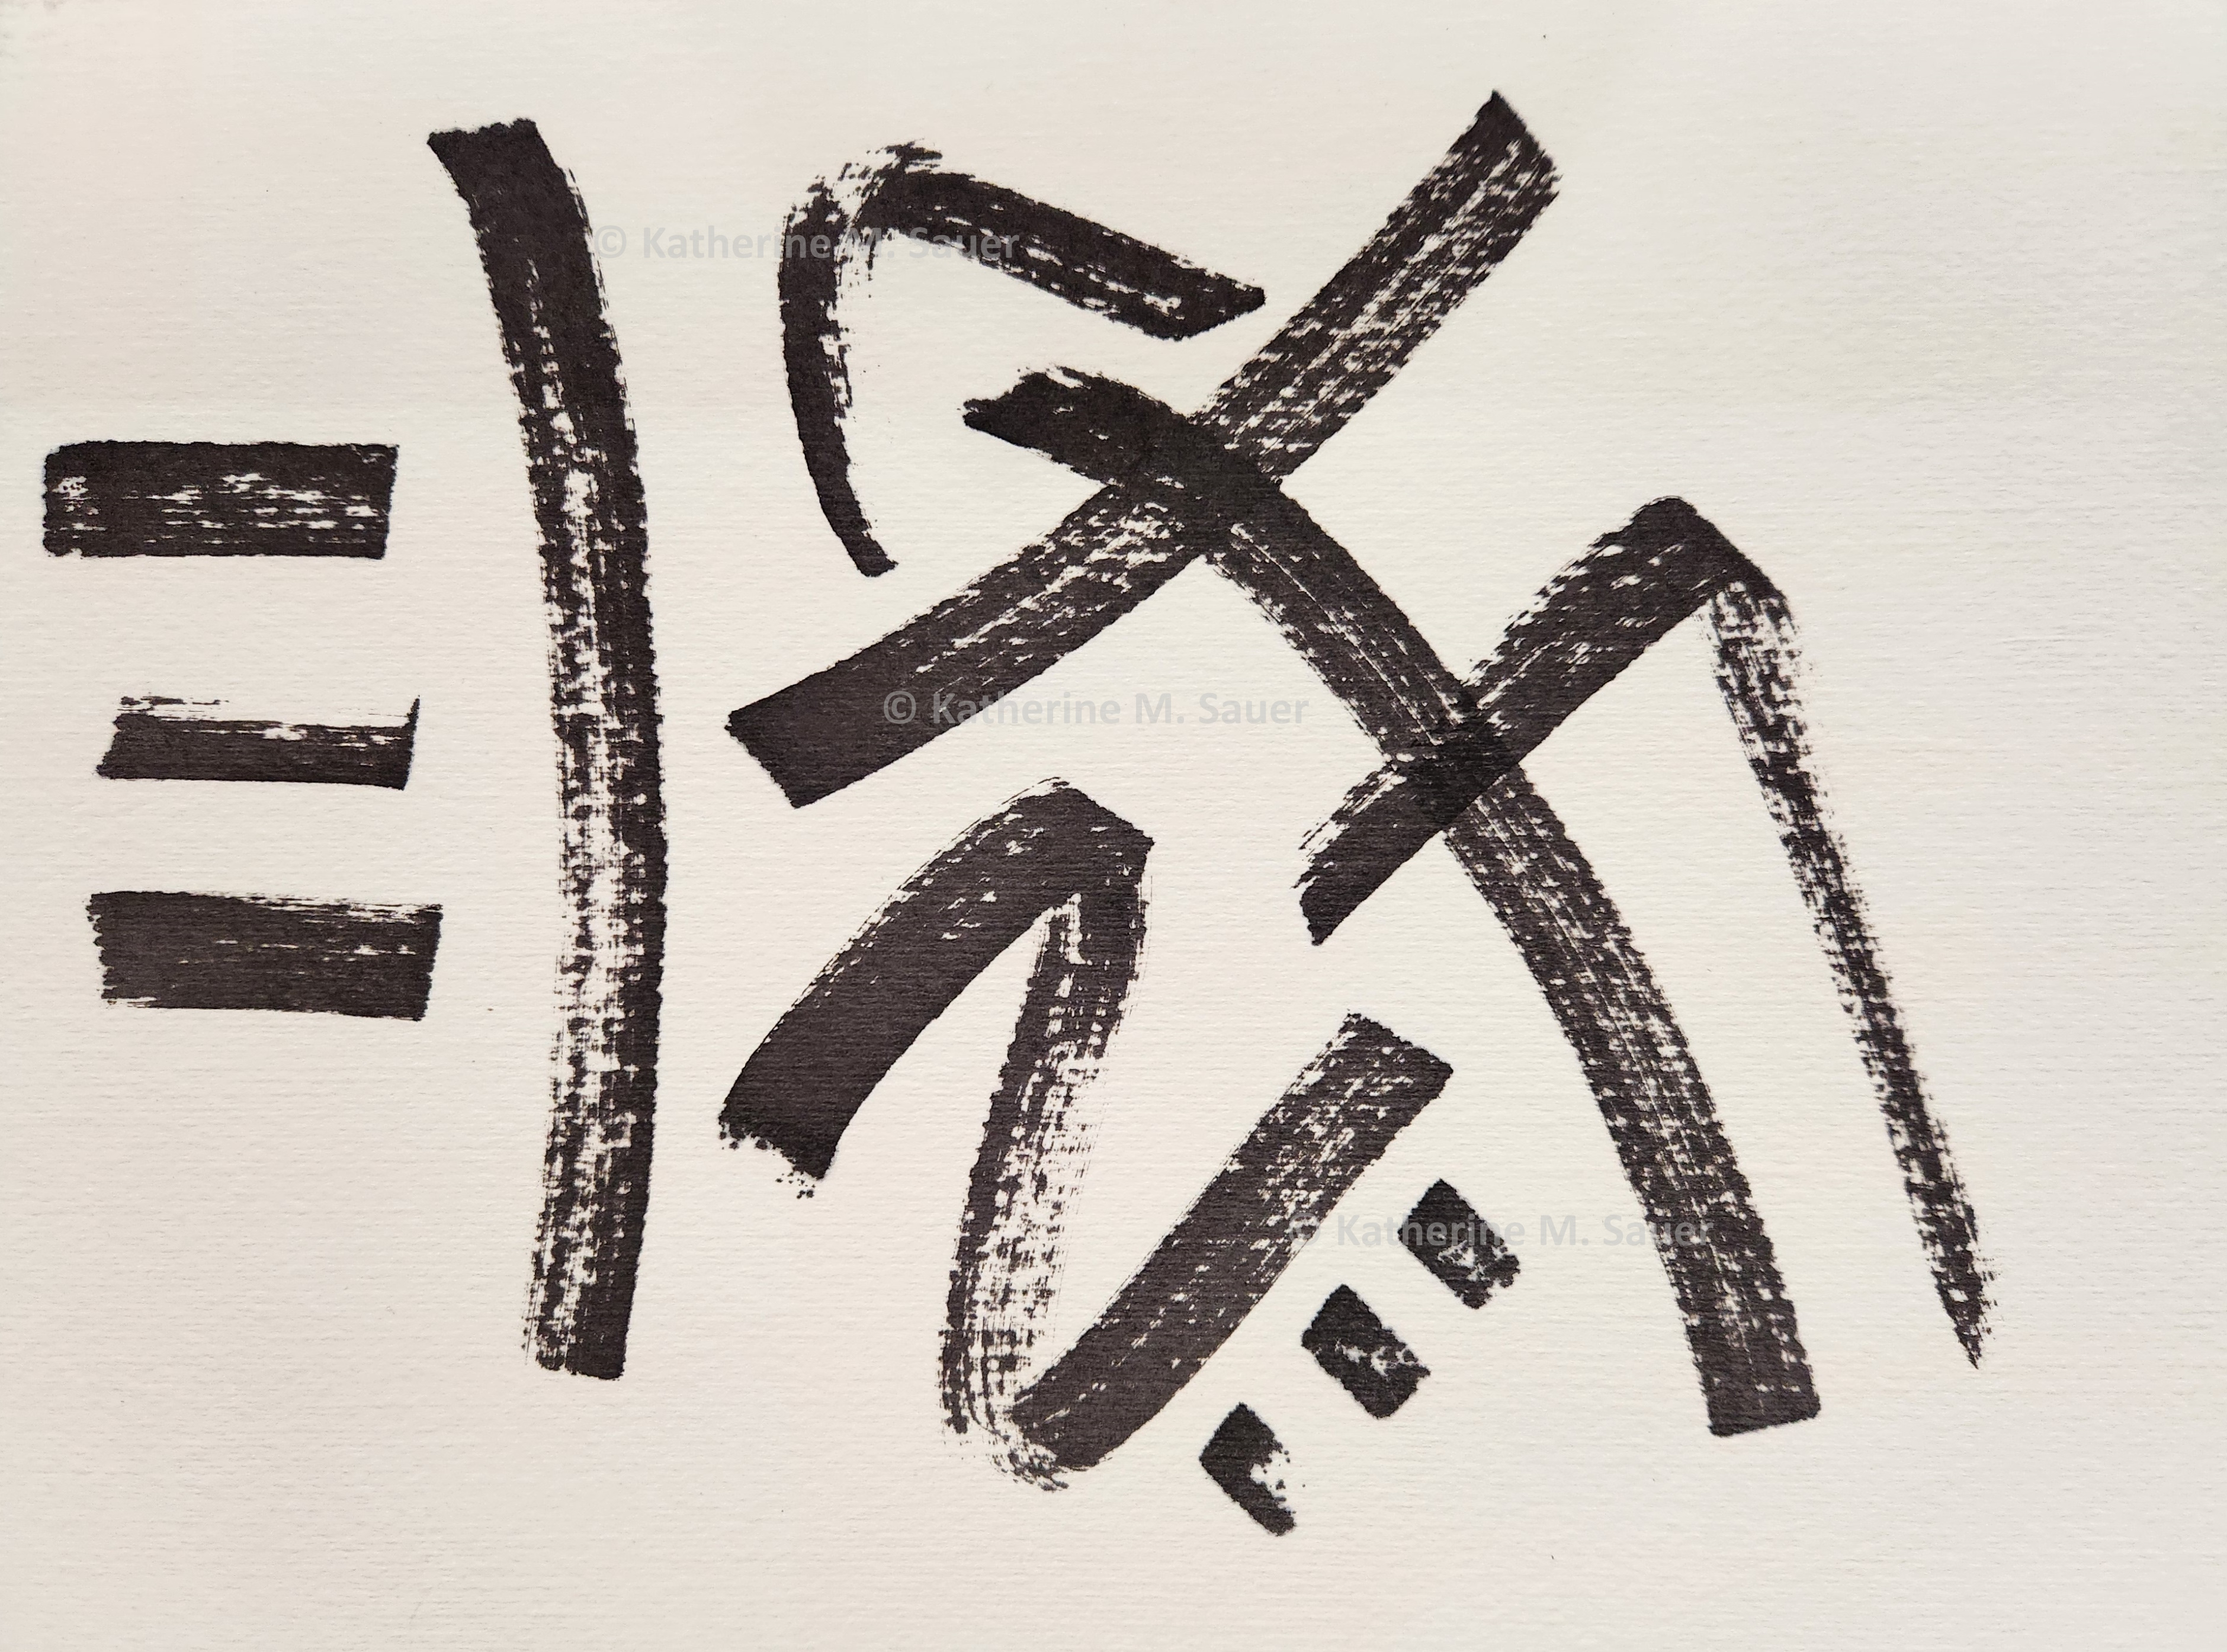
each 5.5" x 4.25" | acrylic on everyday, ligthweight cardstock
This 4-piece series is born of unscripted expression while using up the last bits of paint in tubes, on paper not intended for a paint medium.
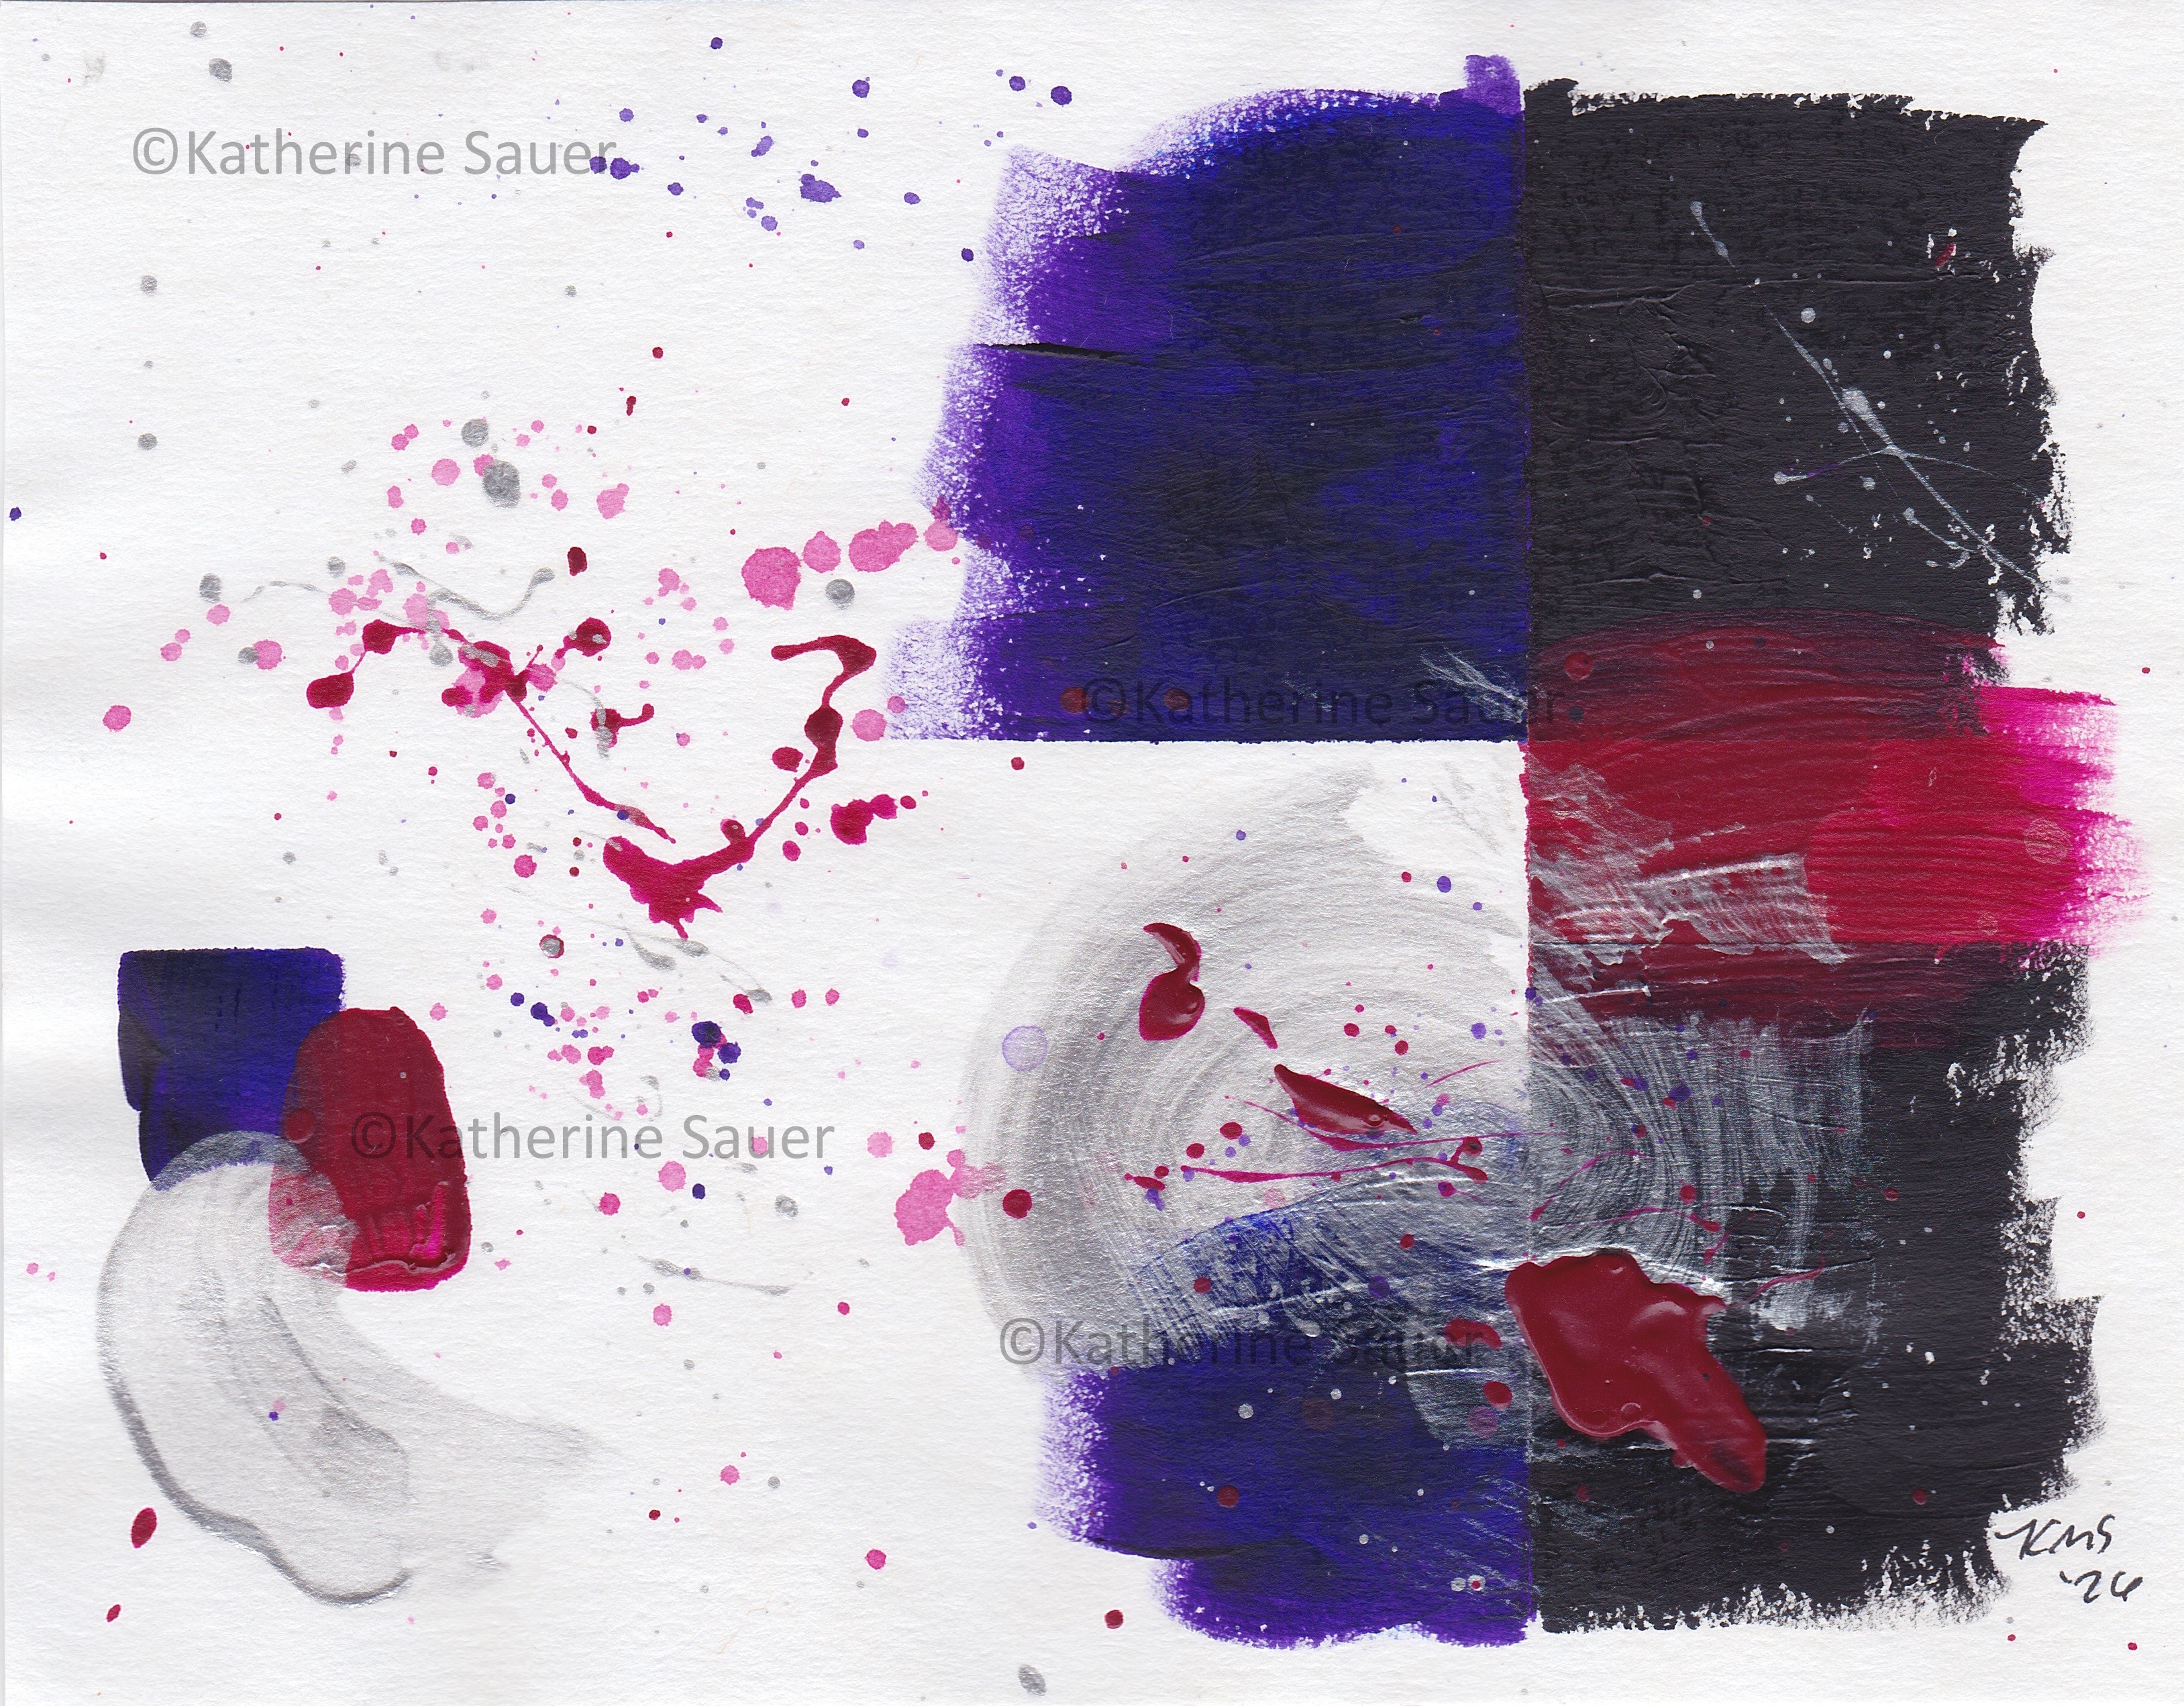
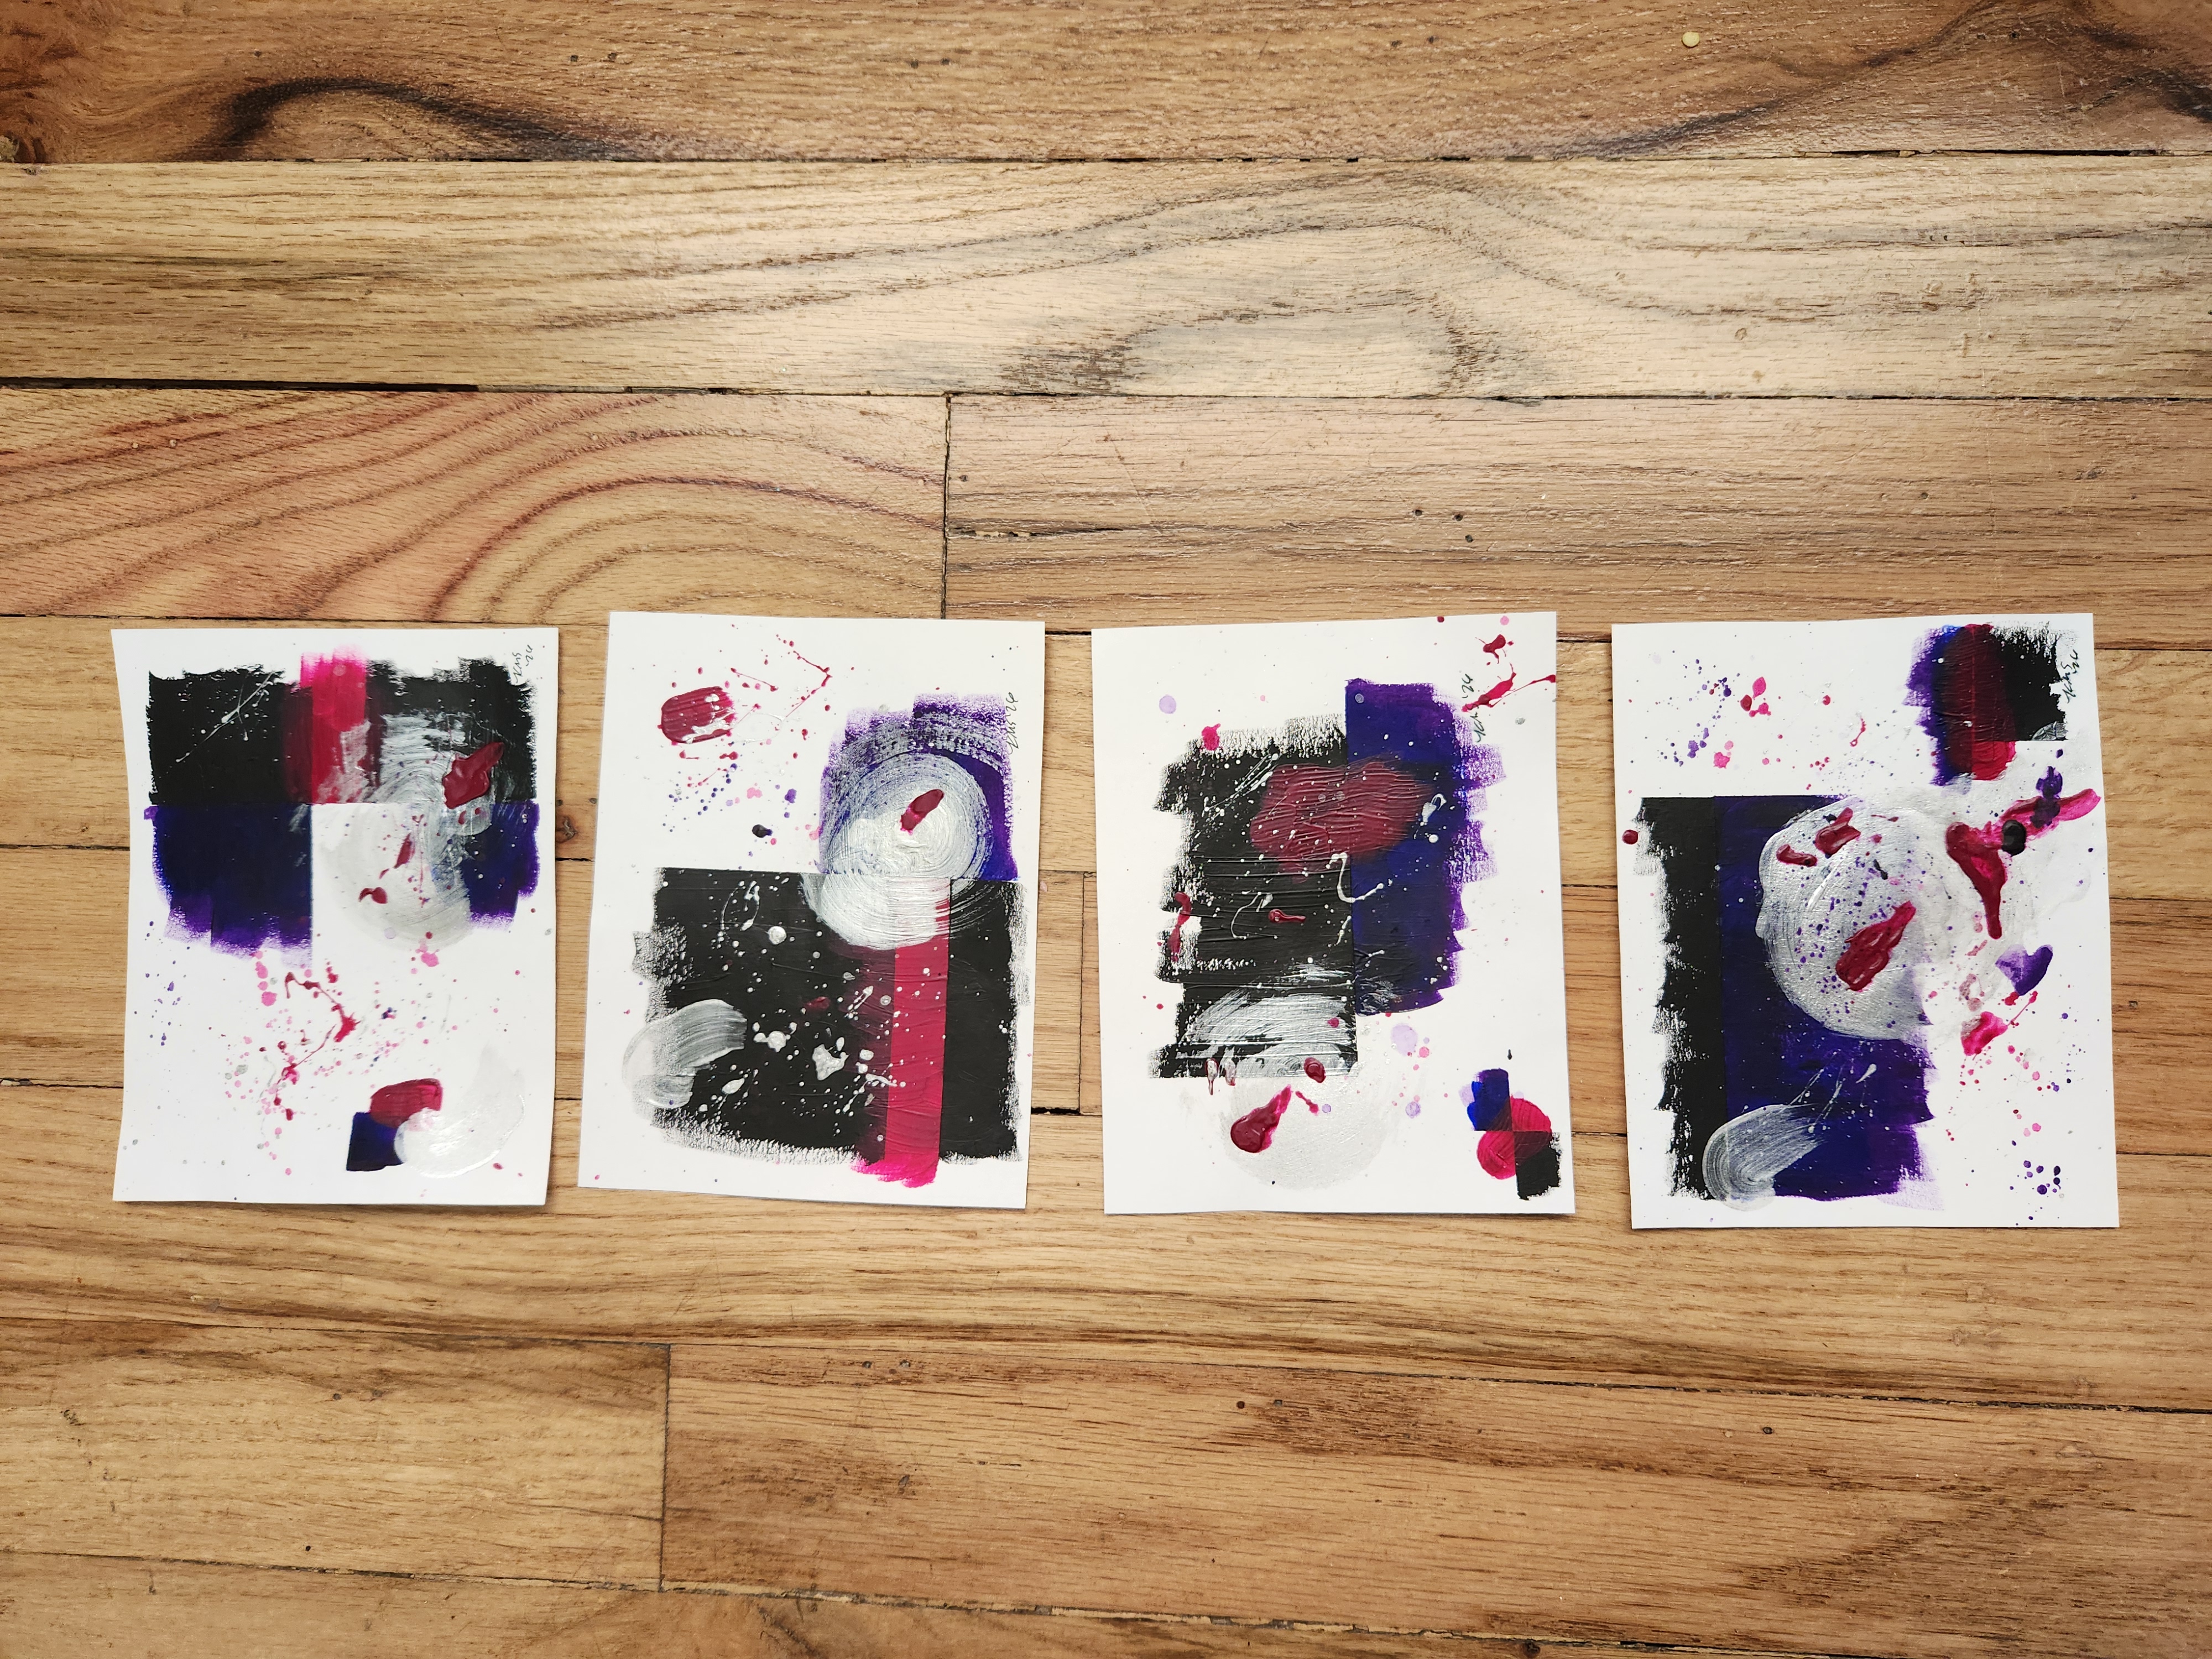
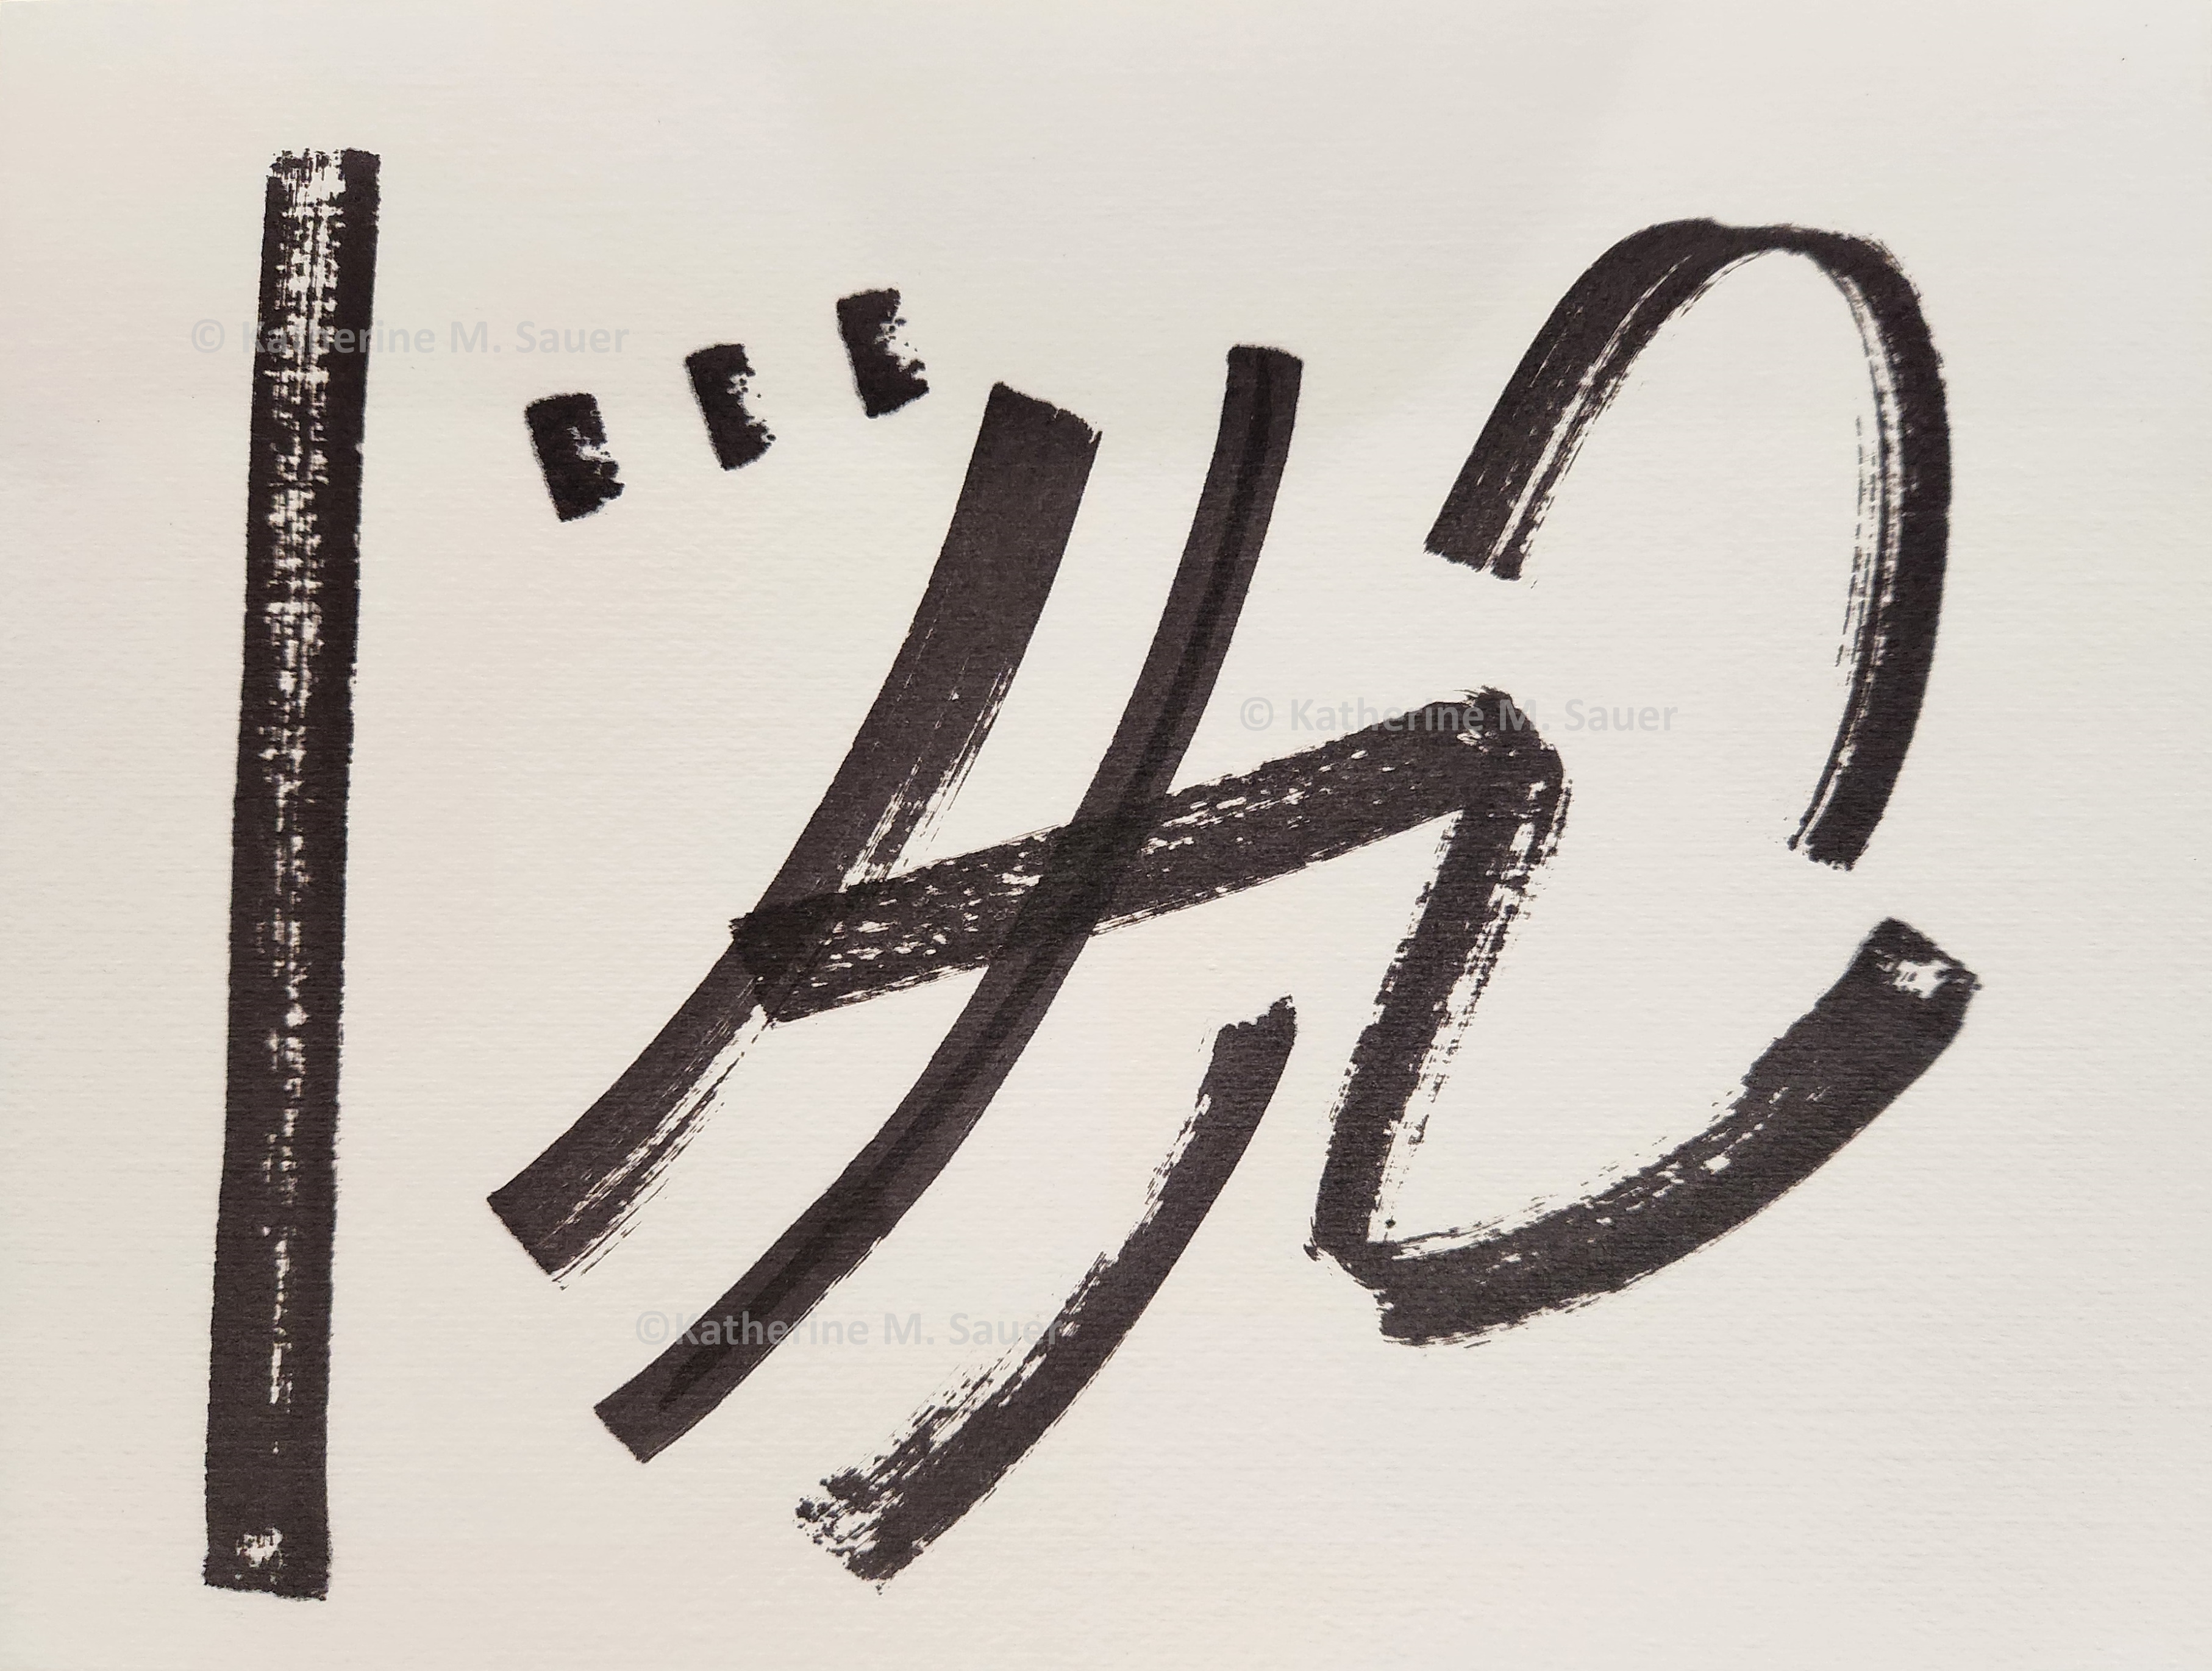
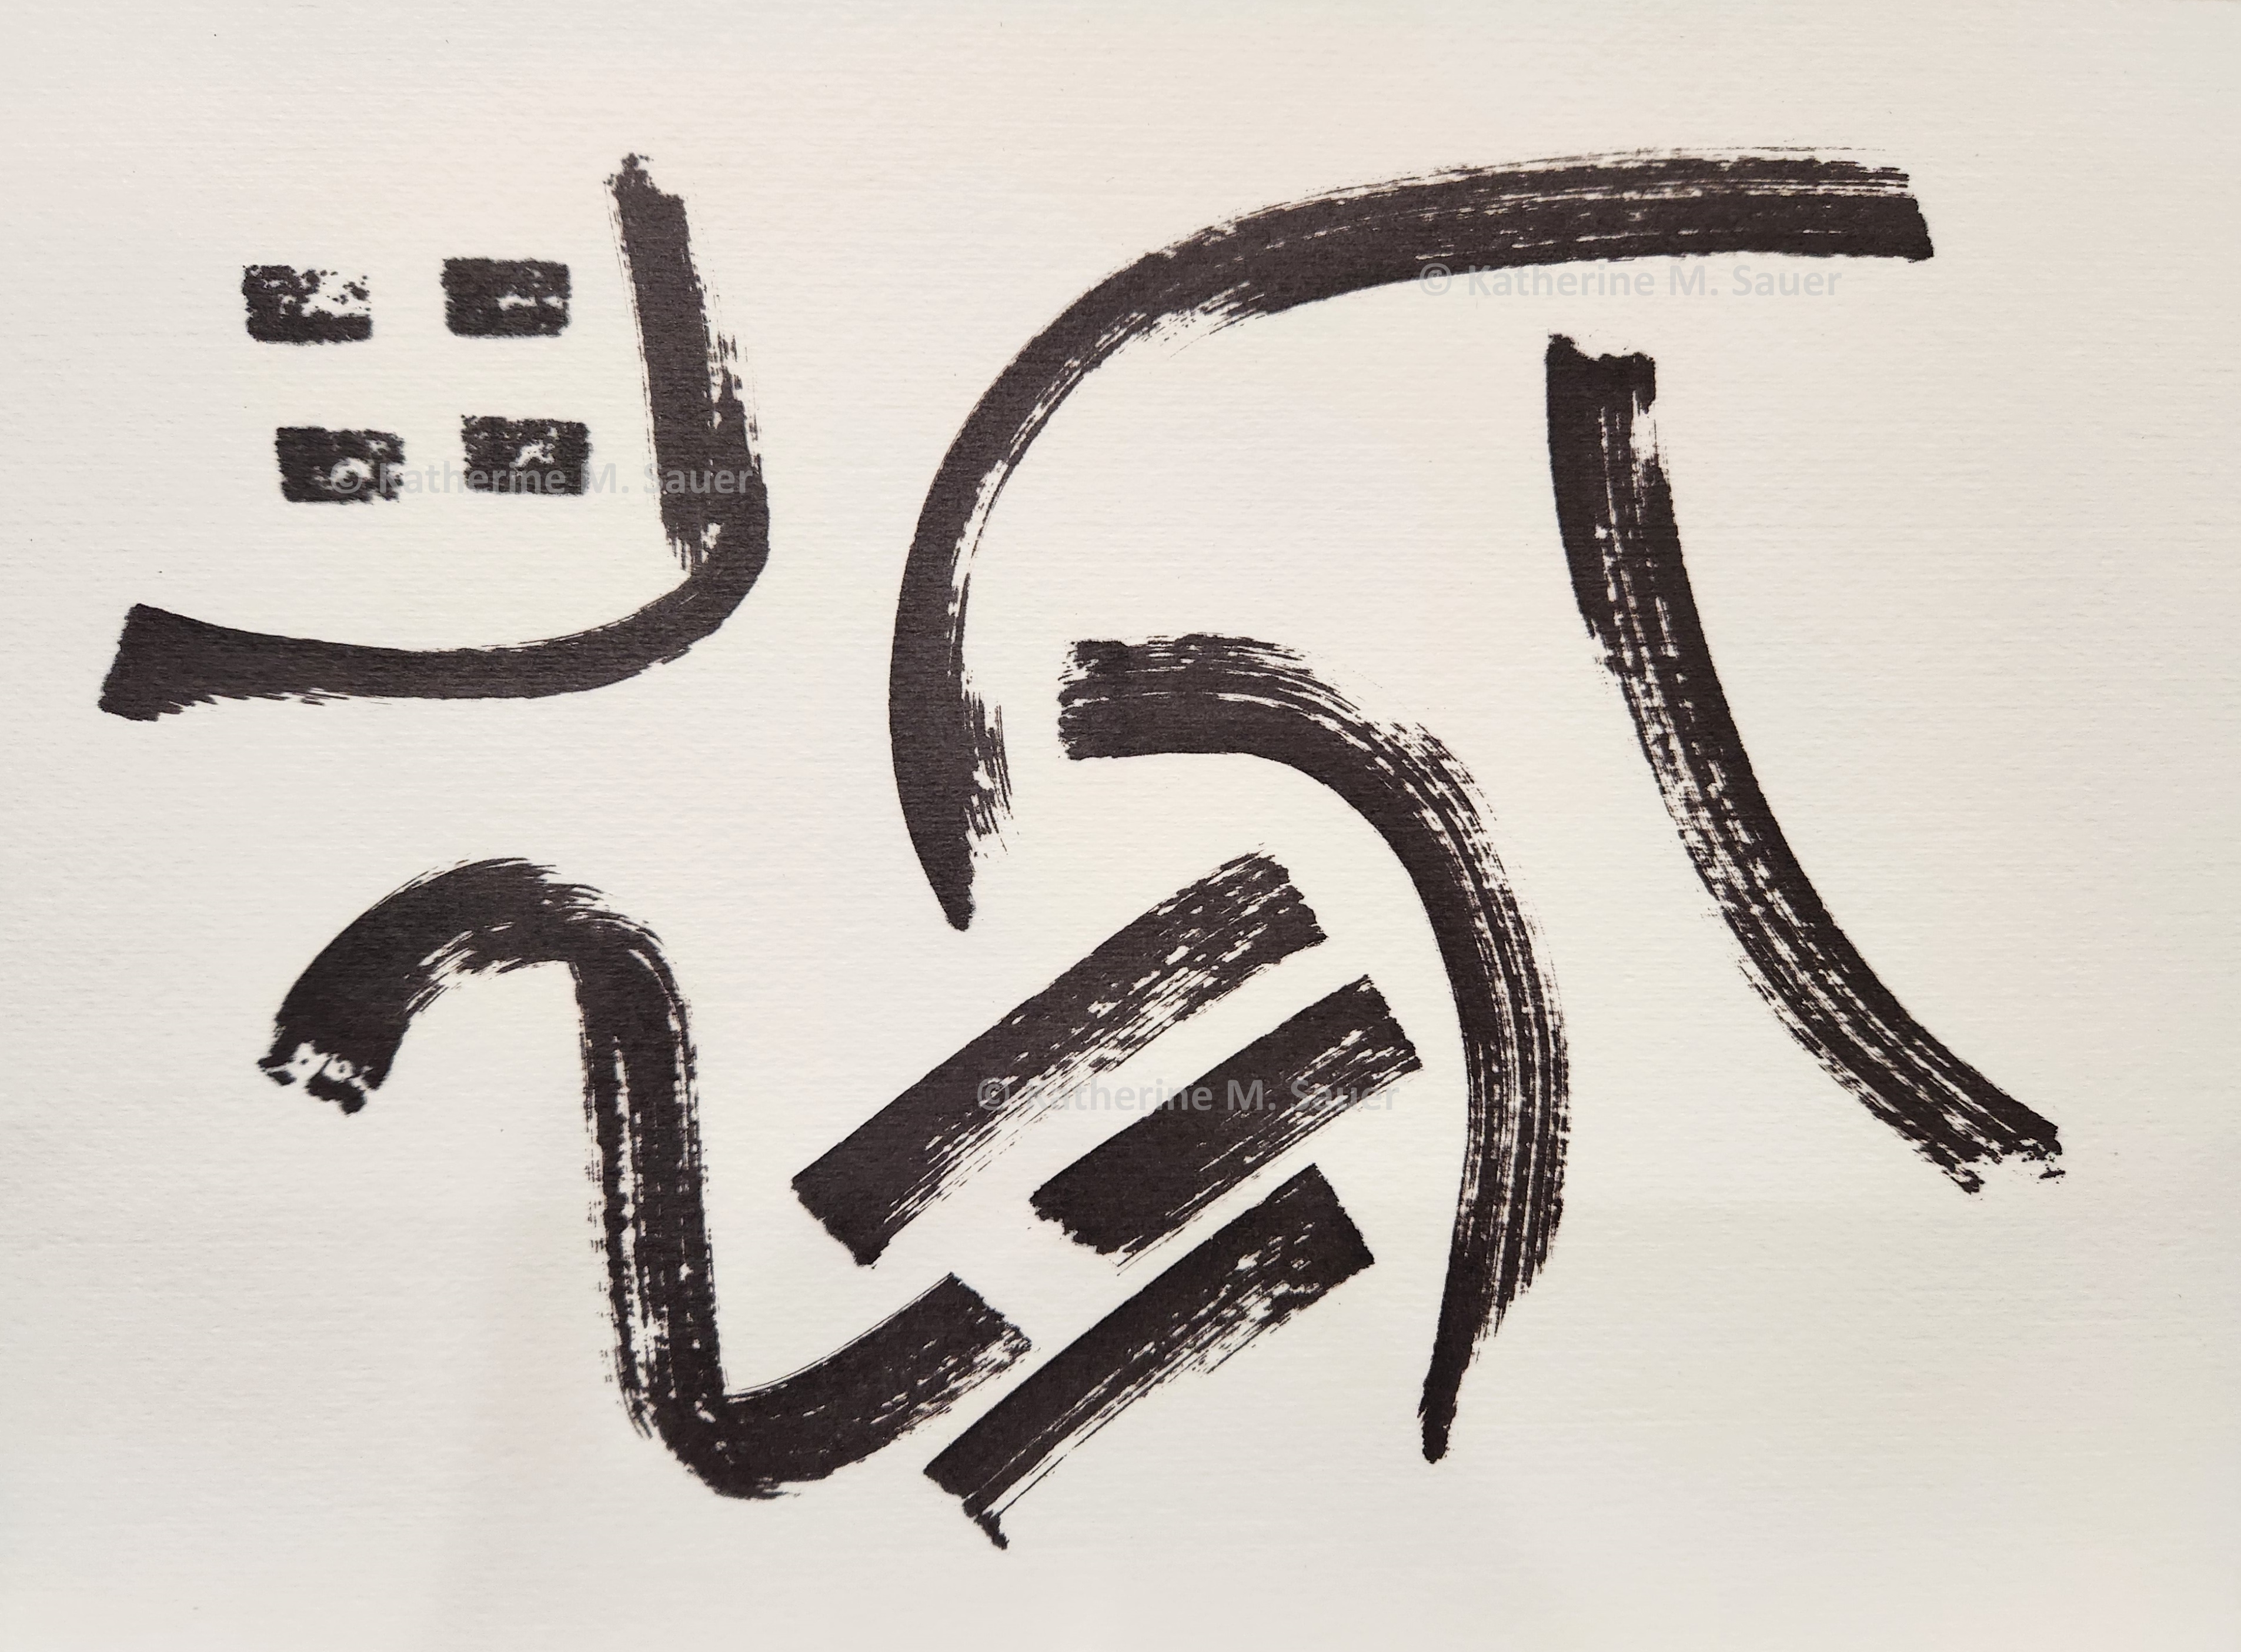
each 5.5" x 4.25" | acrylic on everyday, ligthweight cardstock
This 4-piece series is born of unscripted expression while using up the last bits of paint in tubes, on paper not intended for a paint medium.
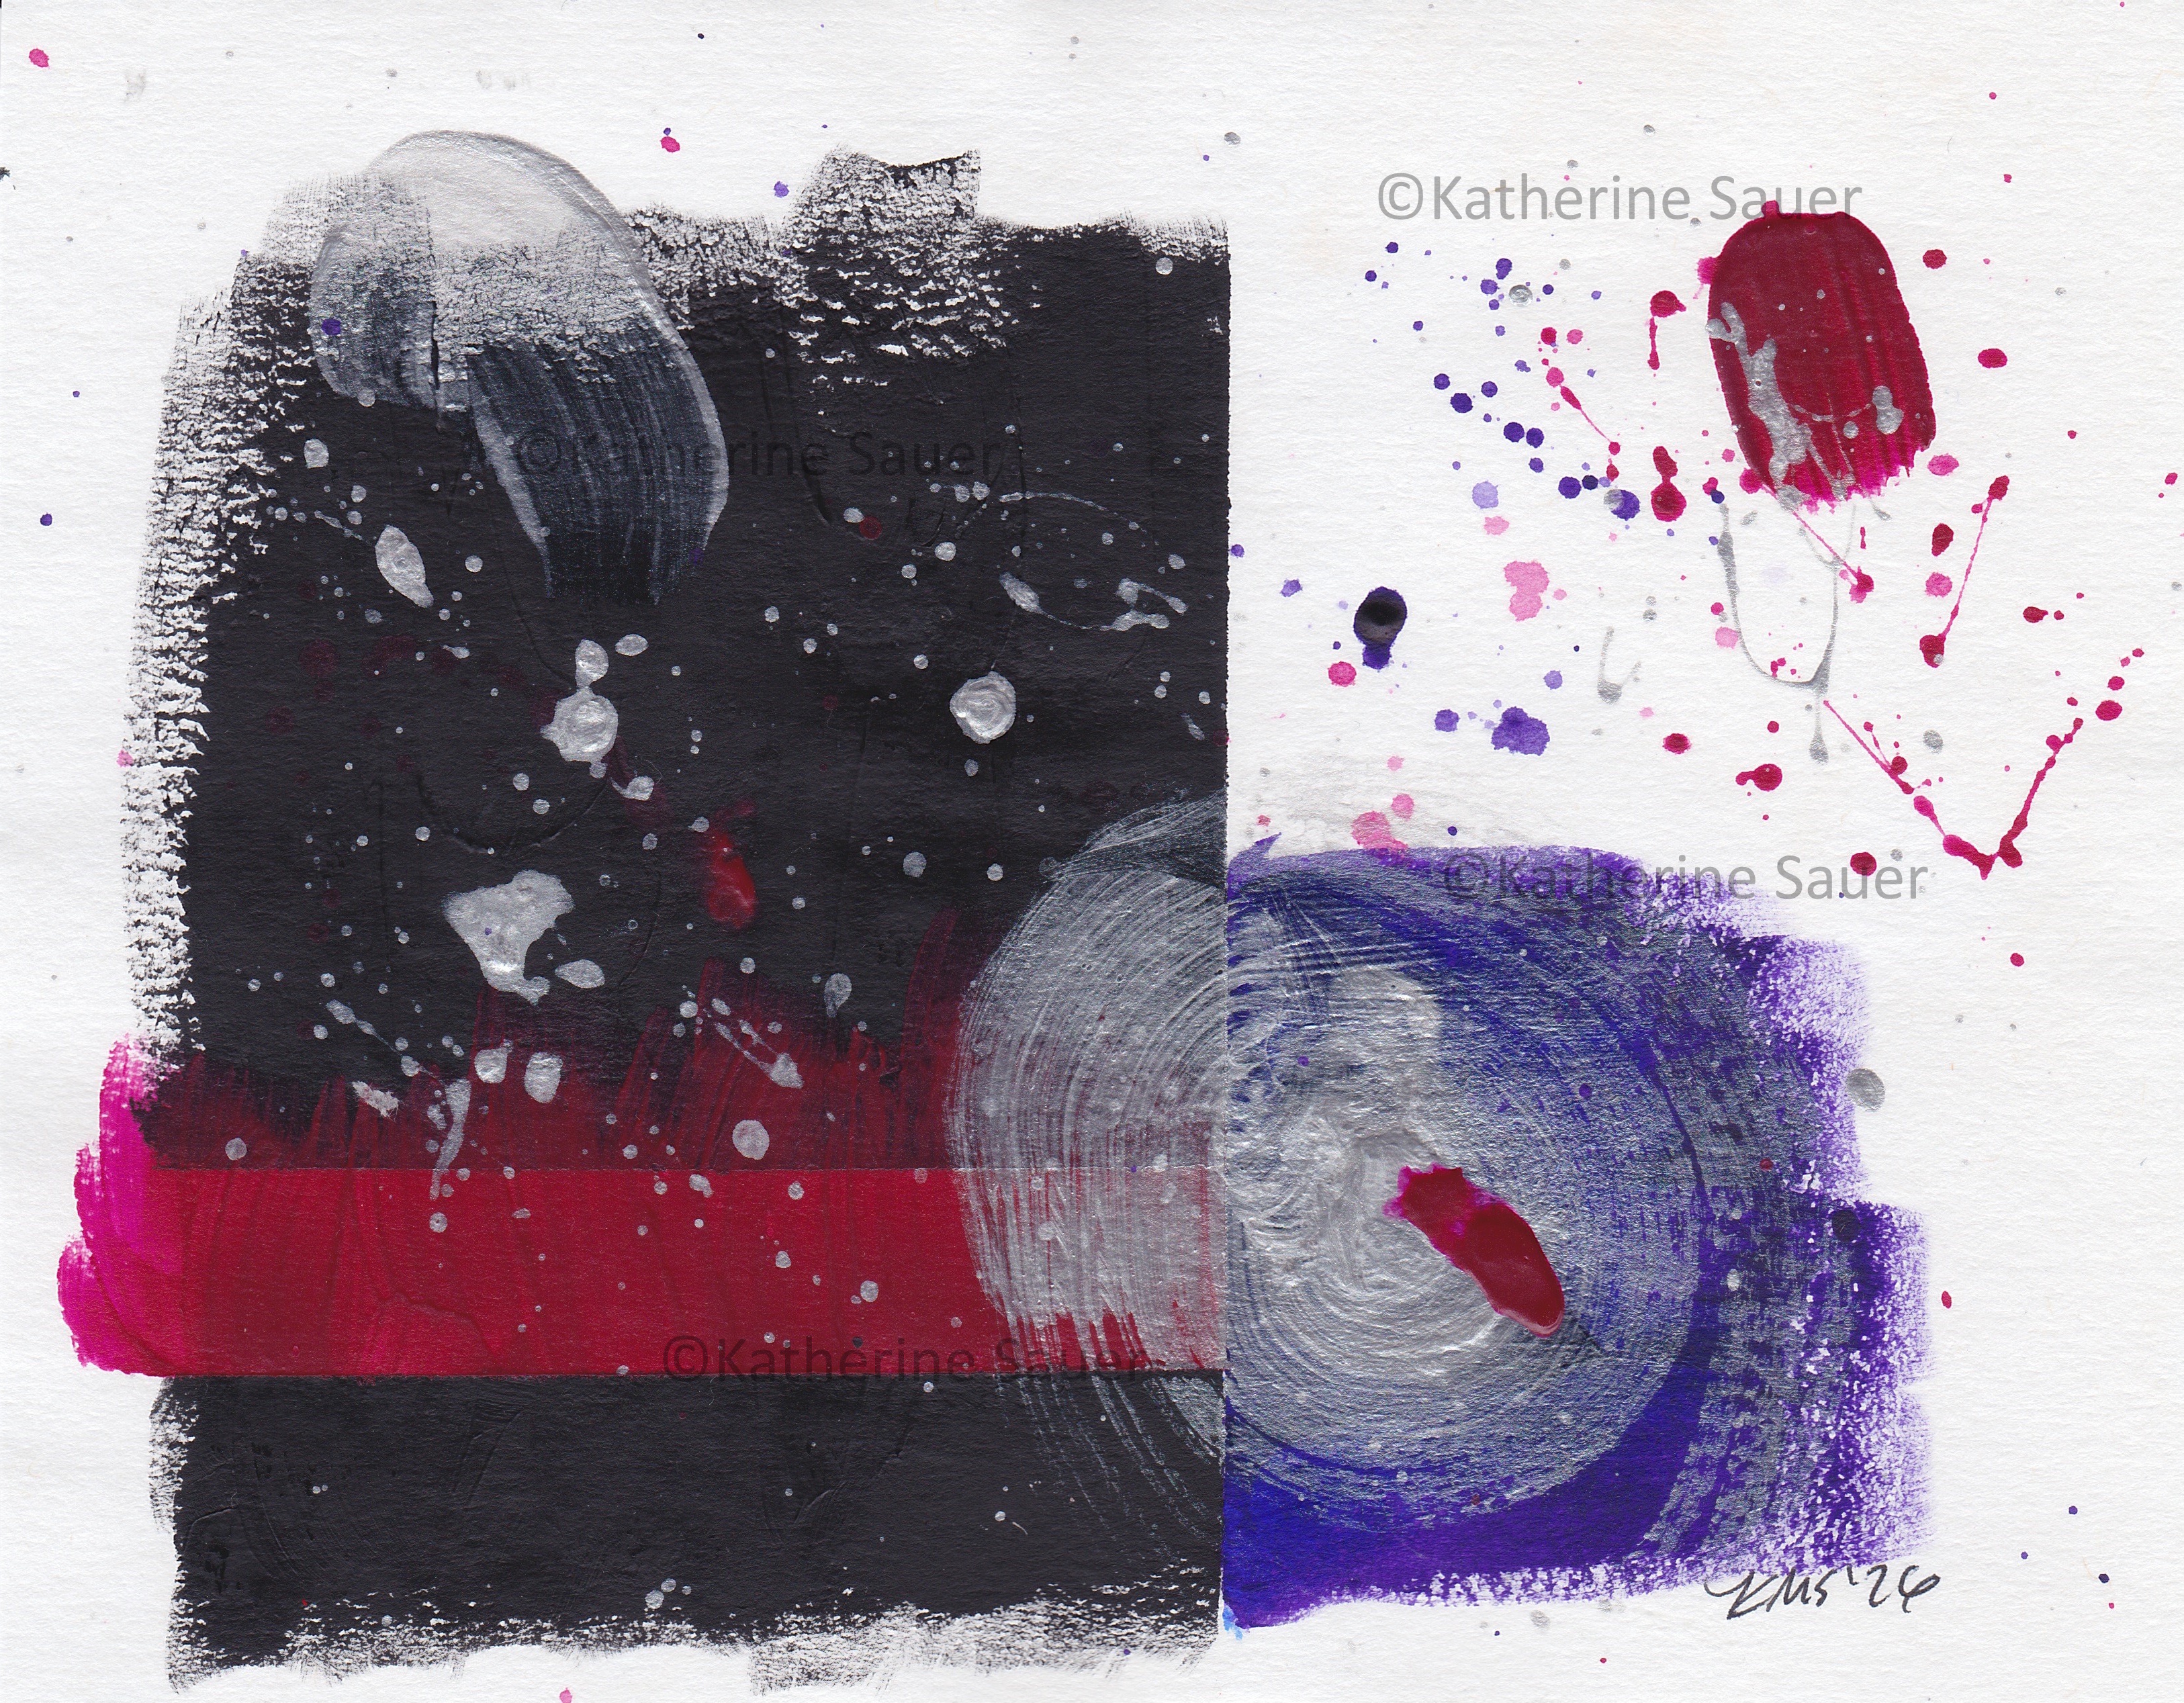
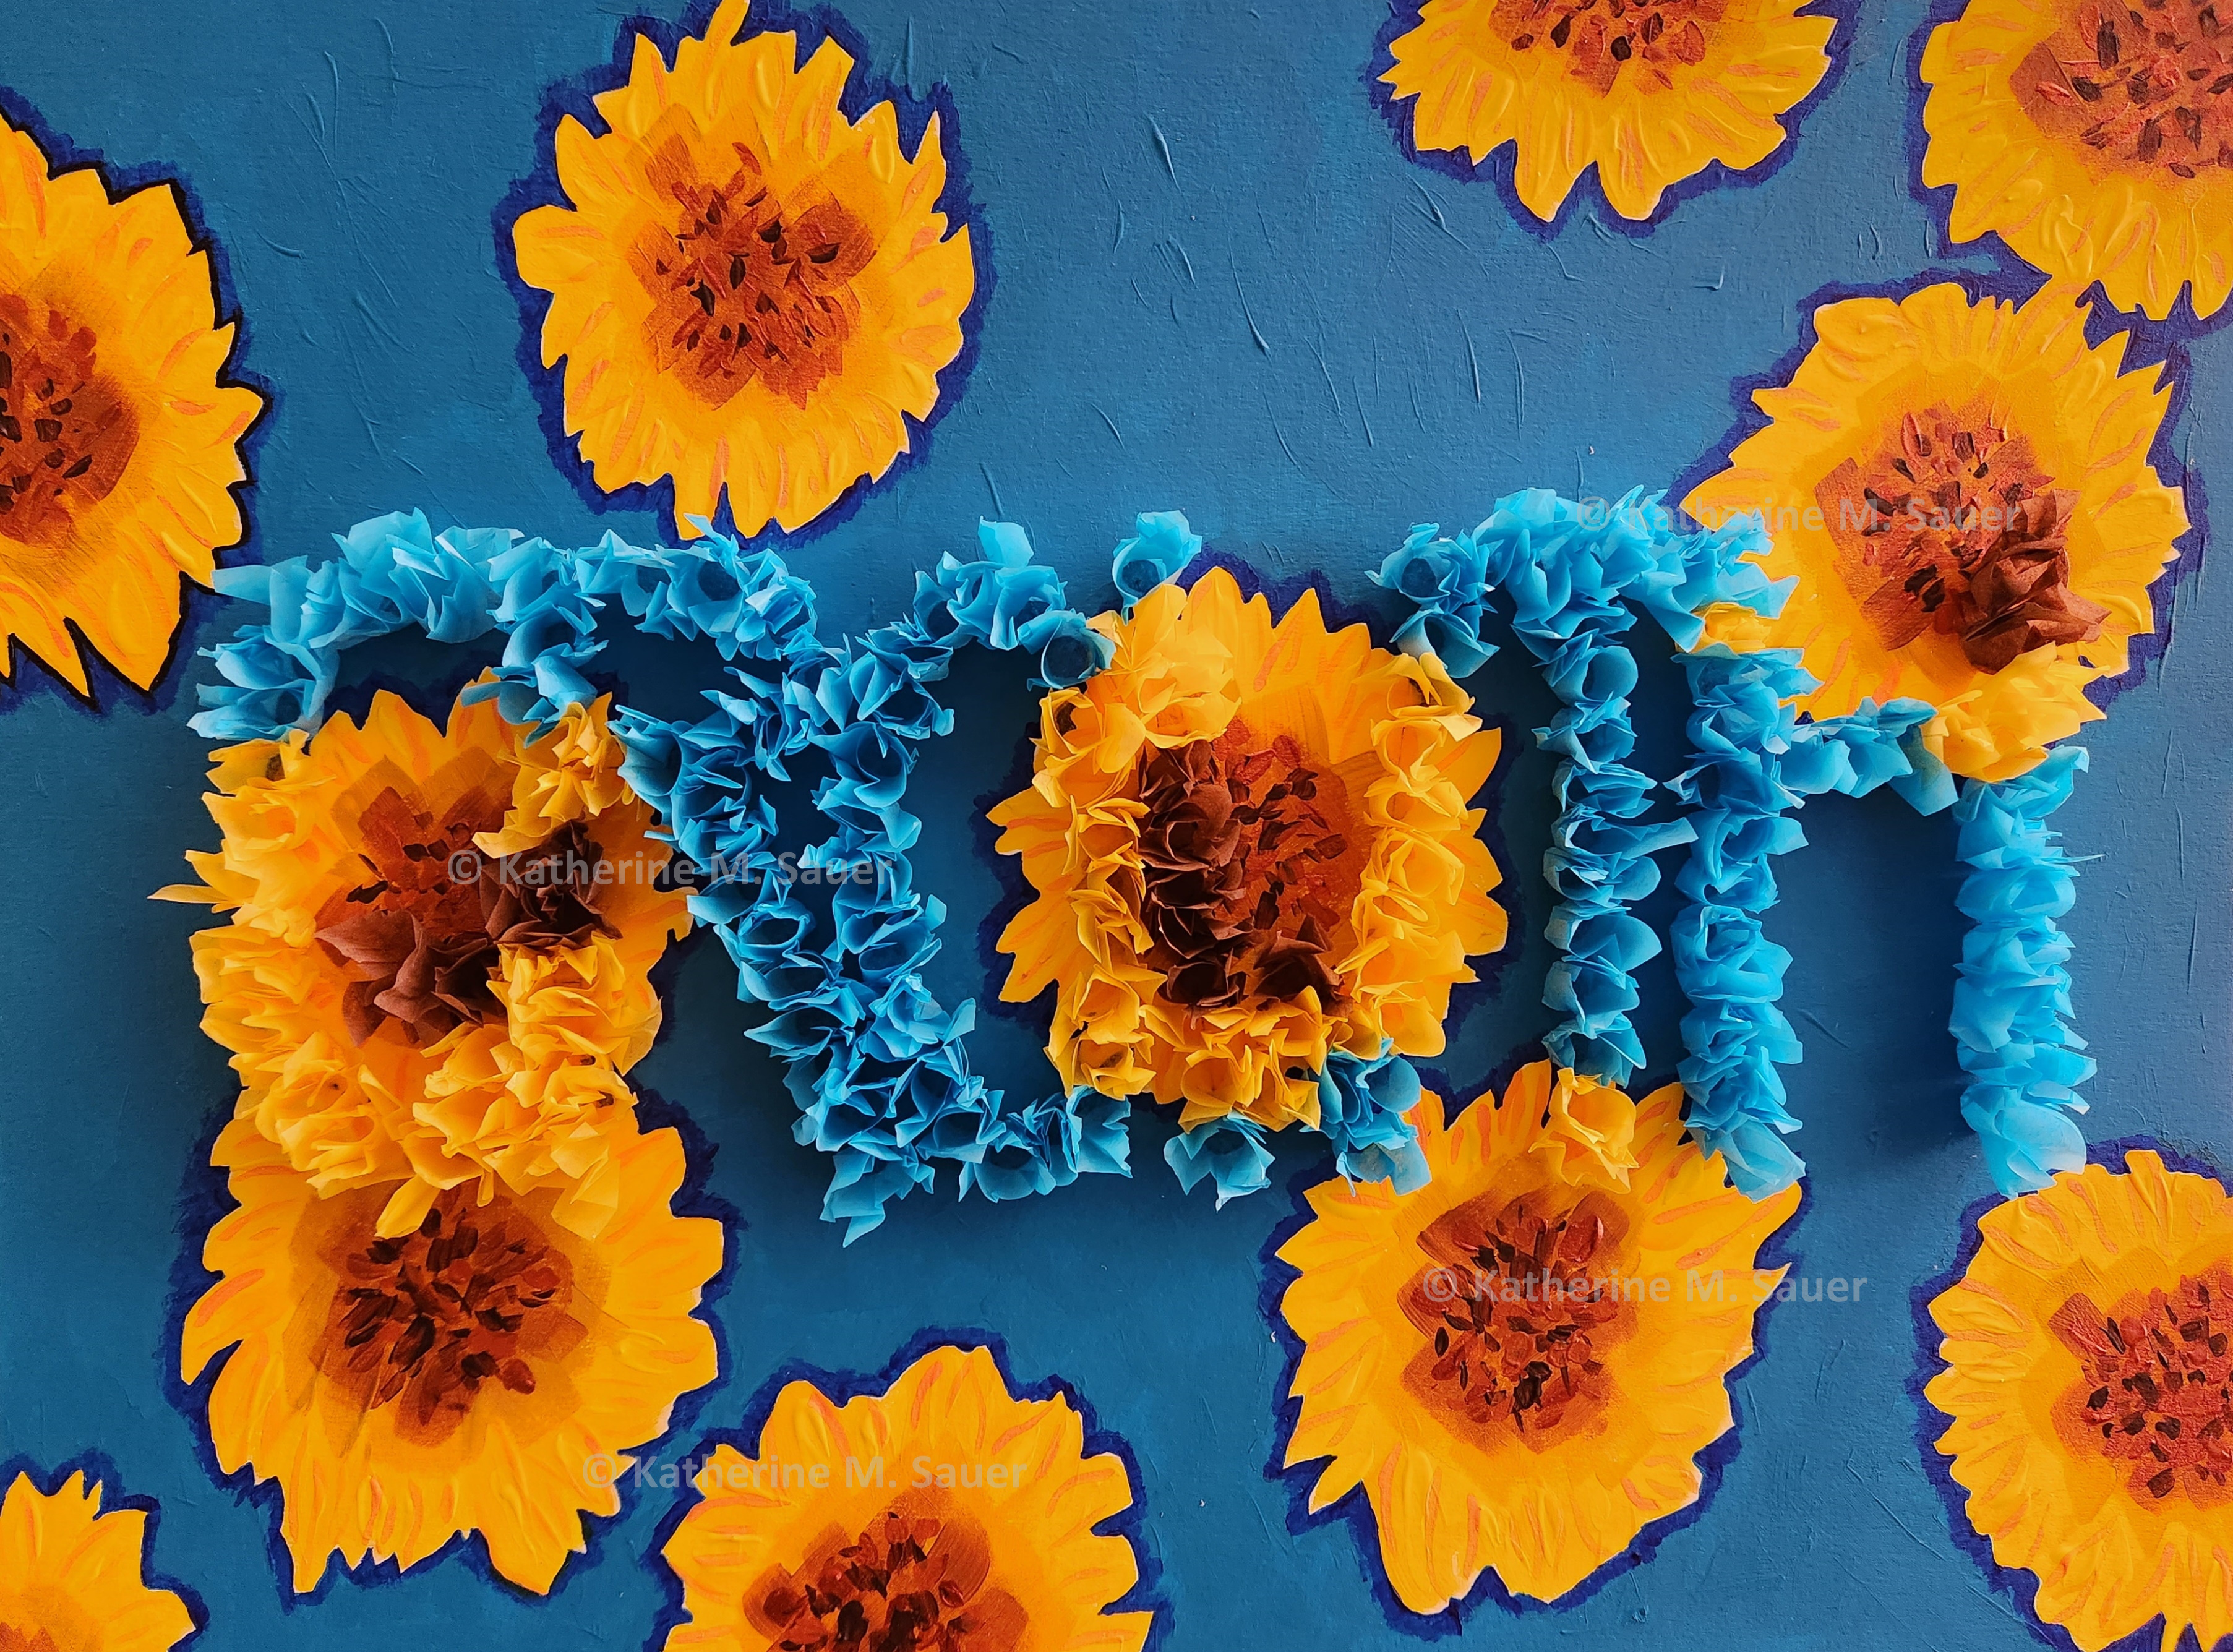
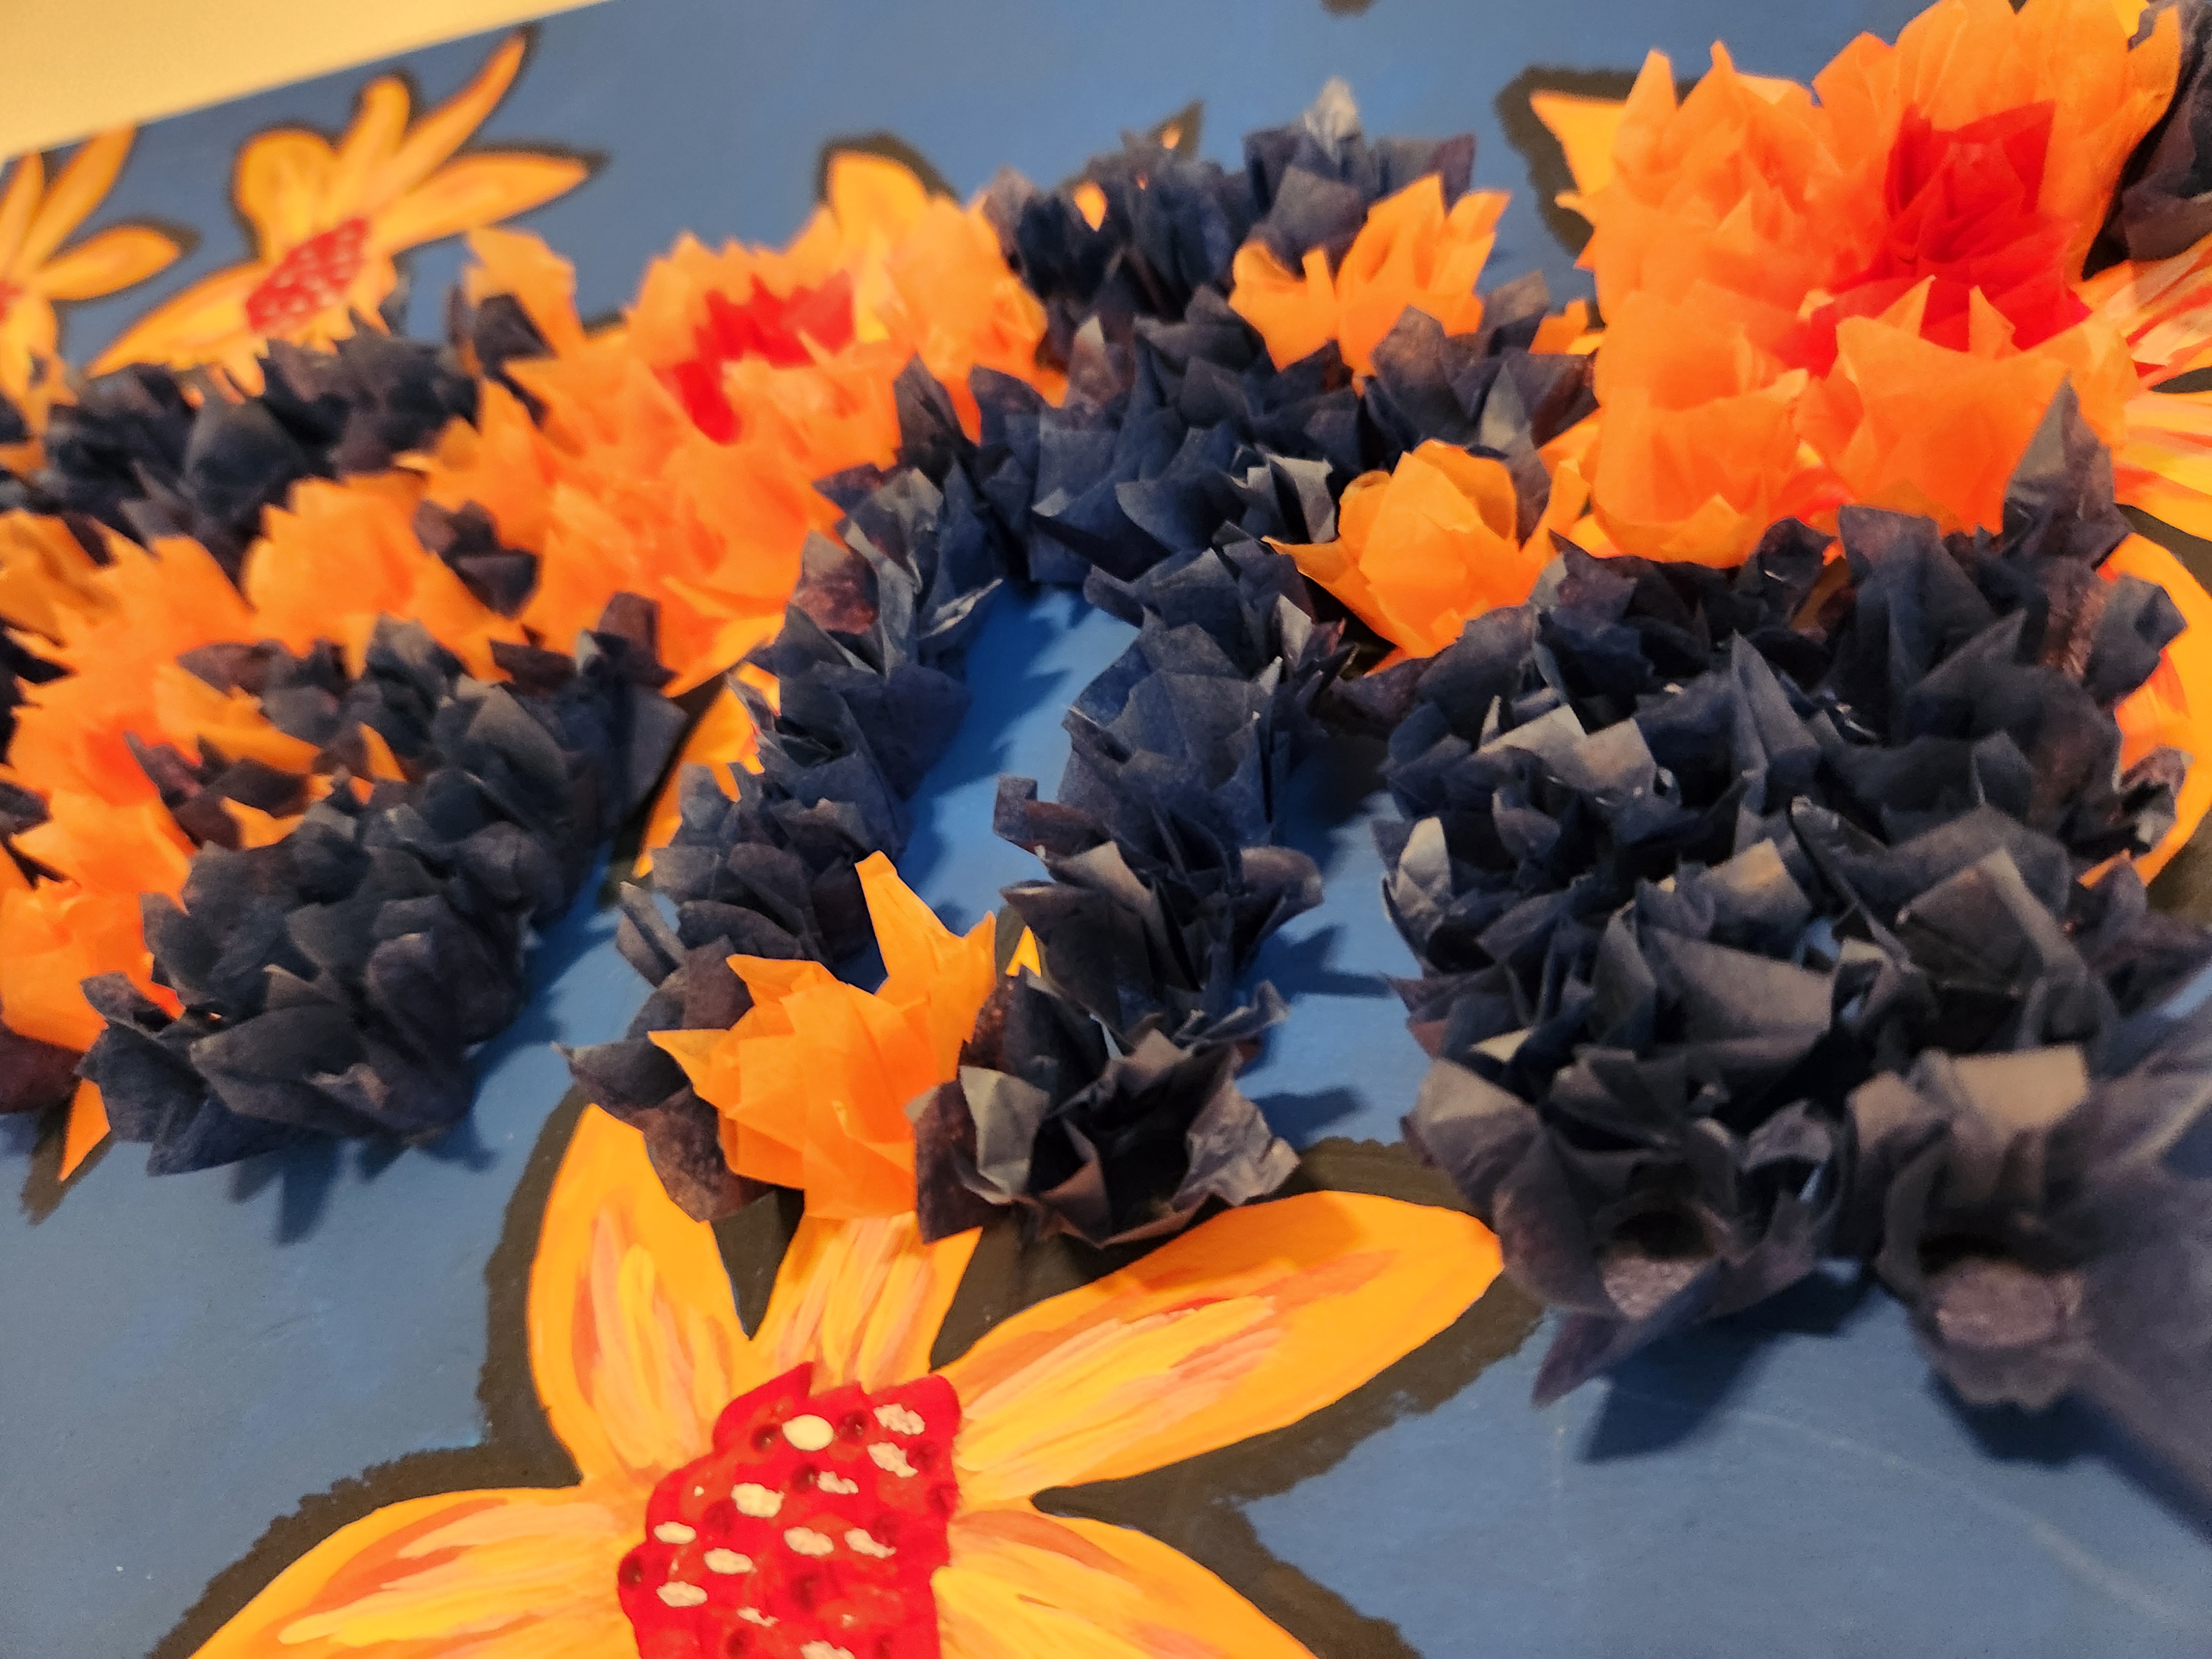
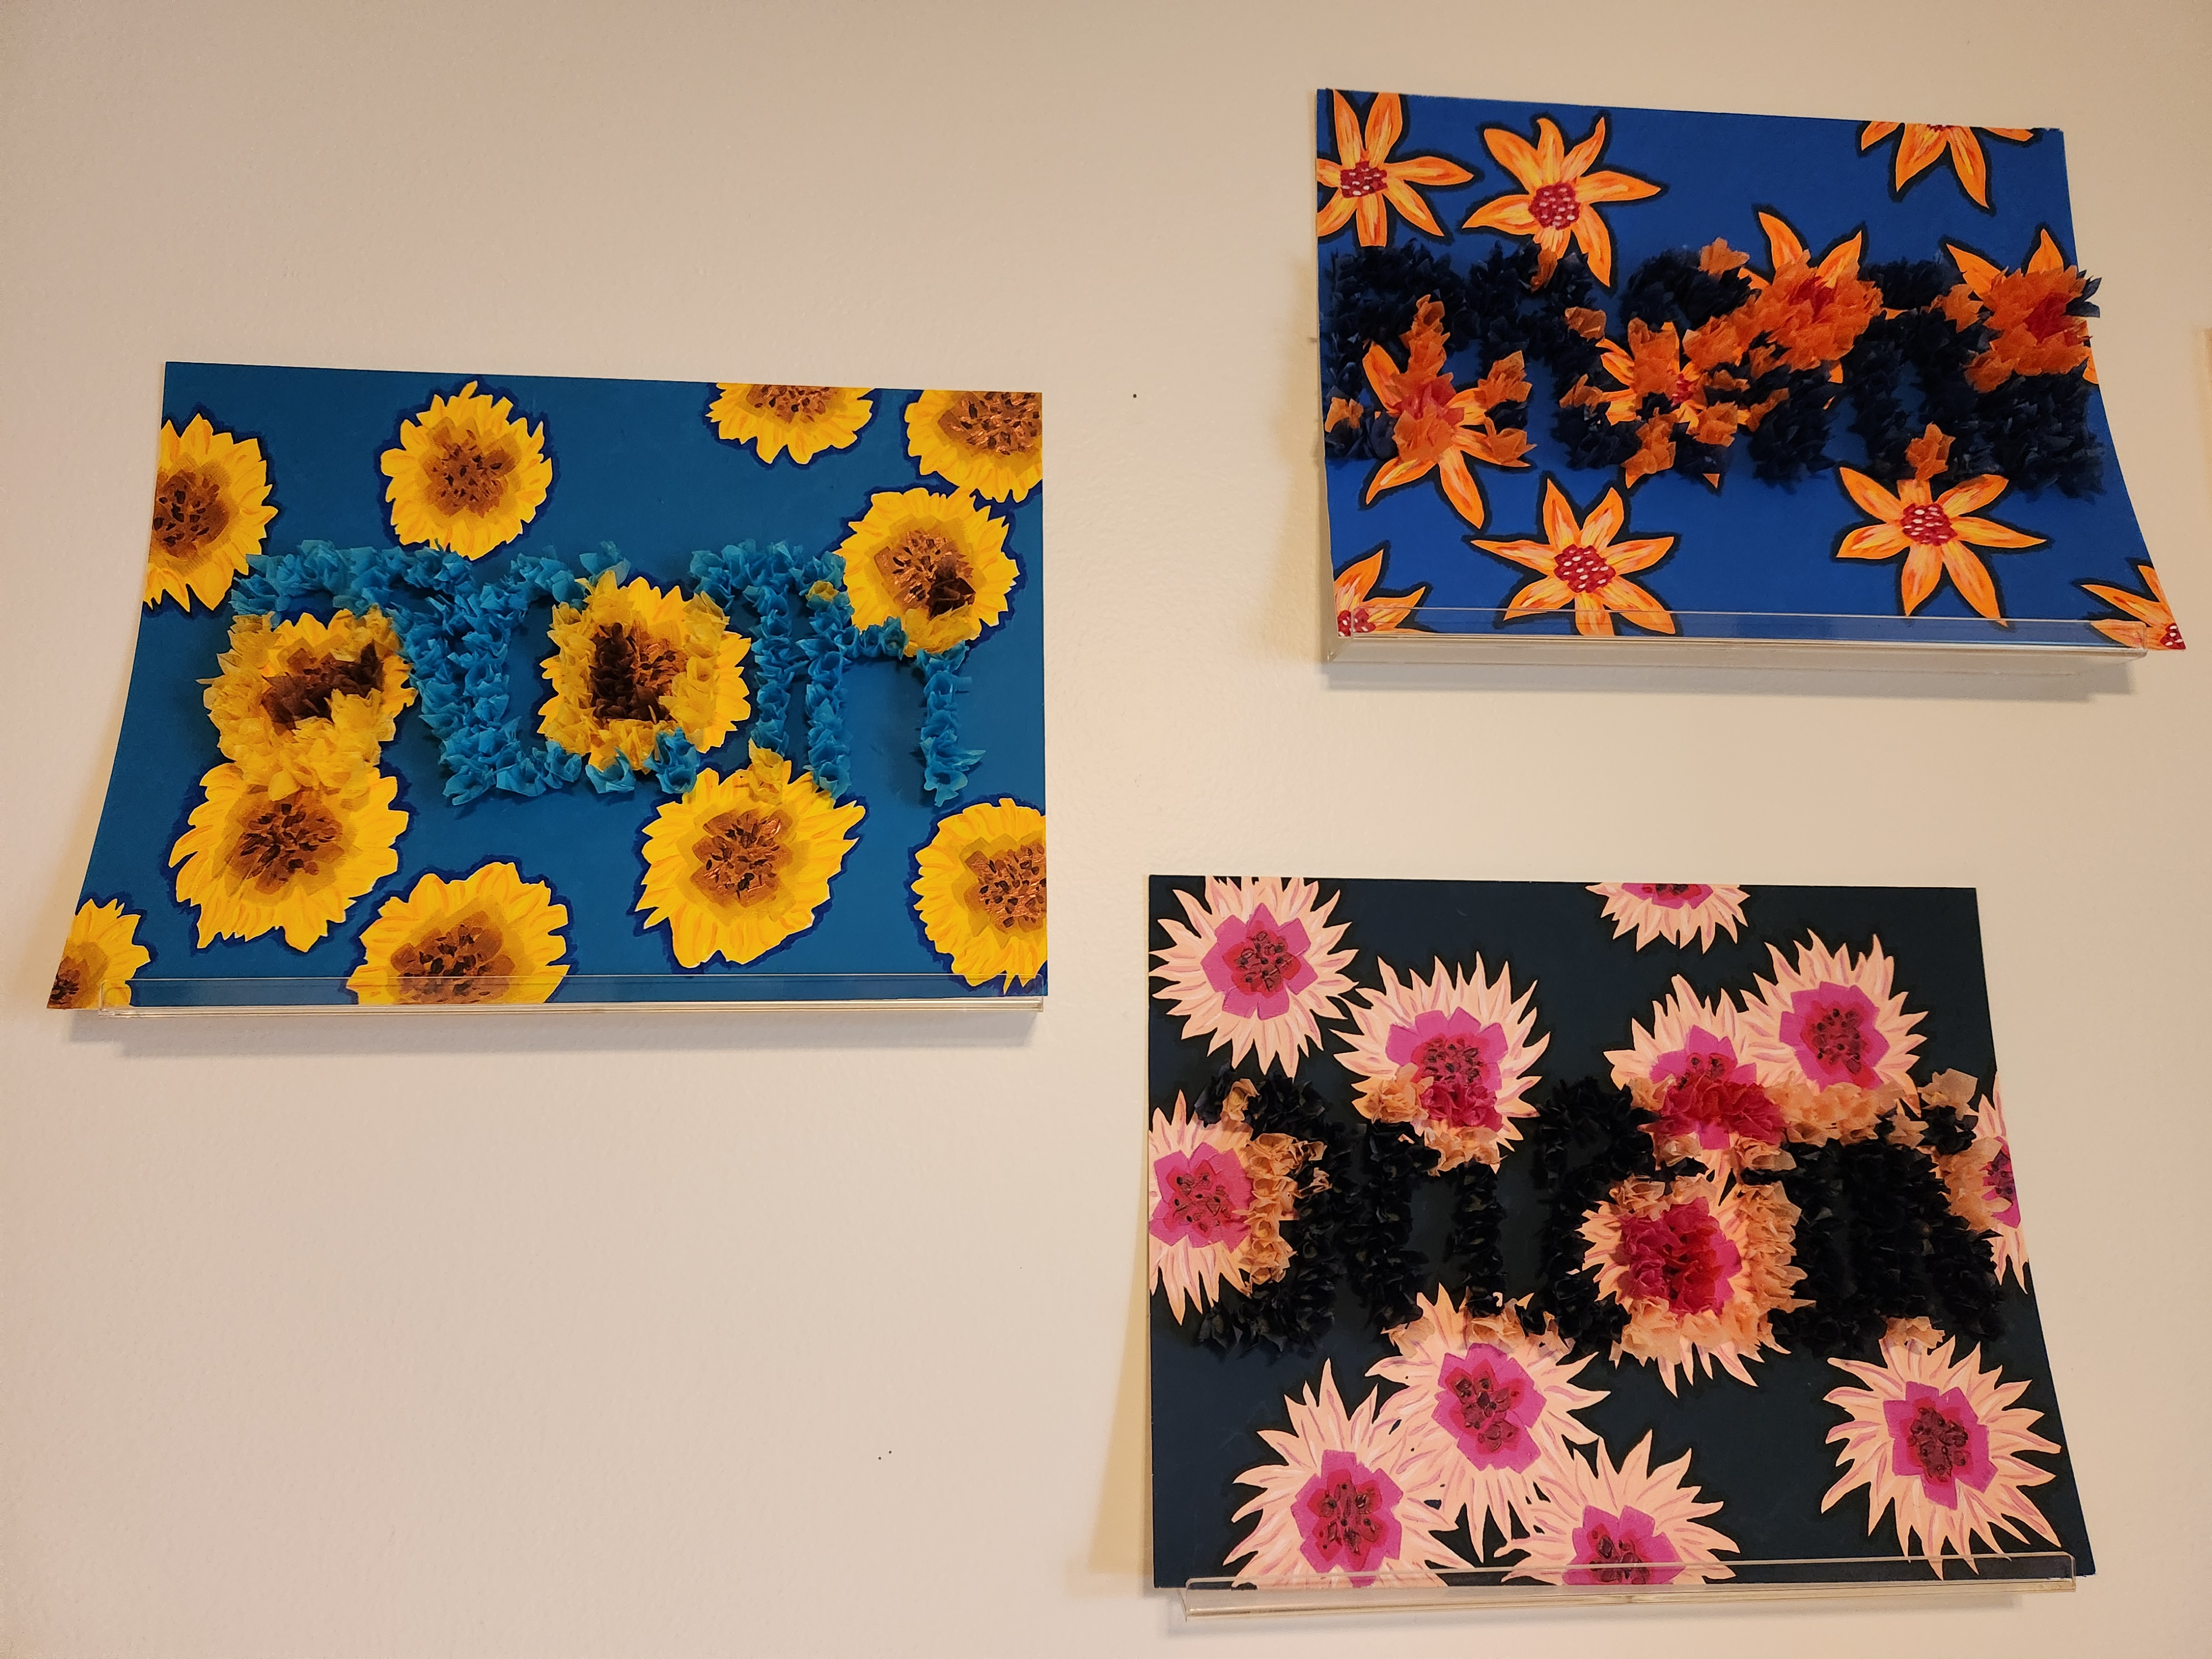
This study presents three major macroeconomic fundamentals – growth, inflation, and unemployment – in a floral motif. Each concept influences your daily life choices, sometimes being top of mind and sometimes fading into the background.
Big 3: Growth | 16" x 12" | acrylic and tissue paper on canvas board
Big 3: Inflation | 16" x 12" | acrylic and tissue paper on canvas board
Big 3: Employment | 16" x 12" | acrylic and tissue paper on canvas board
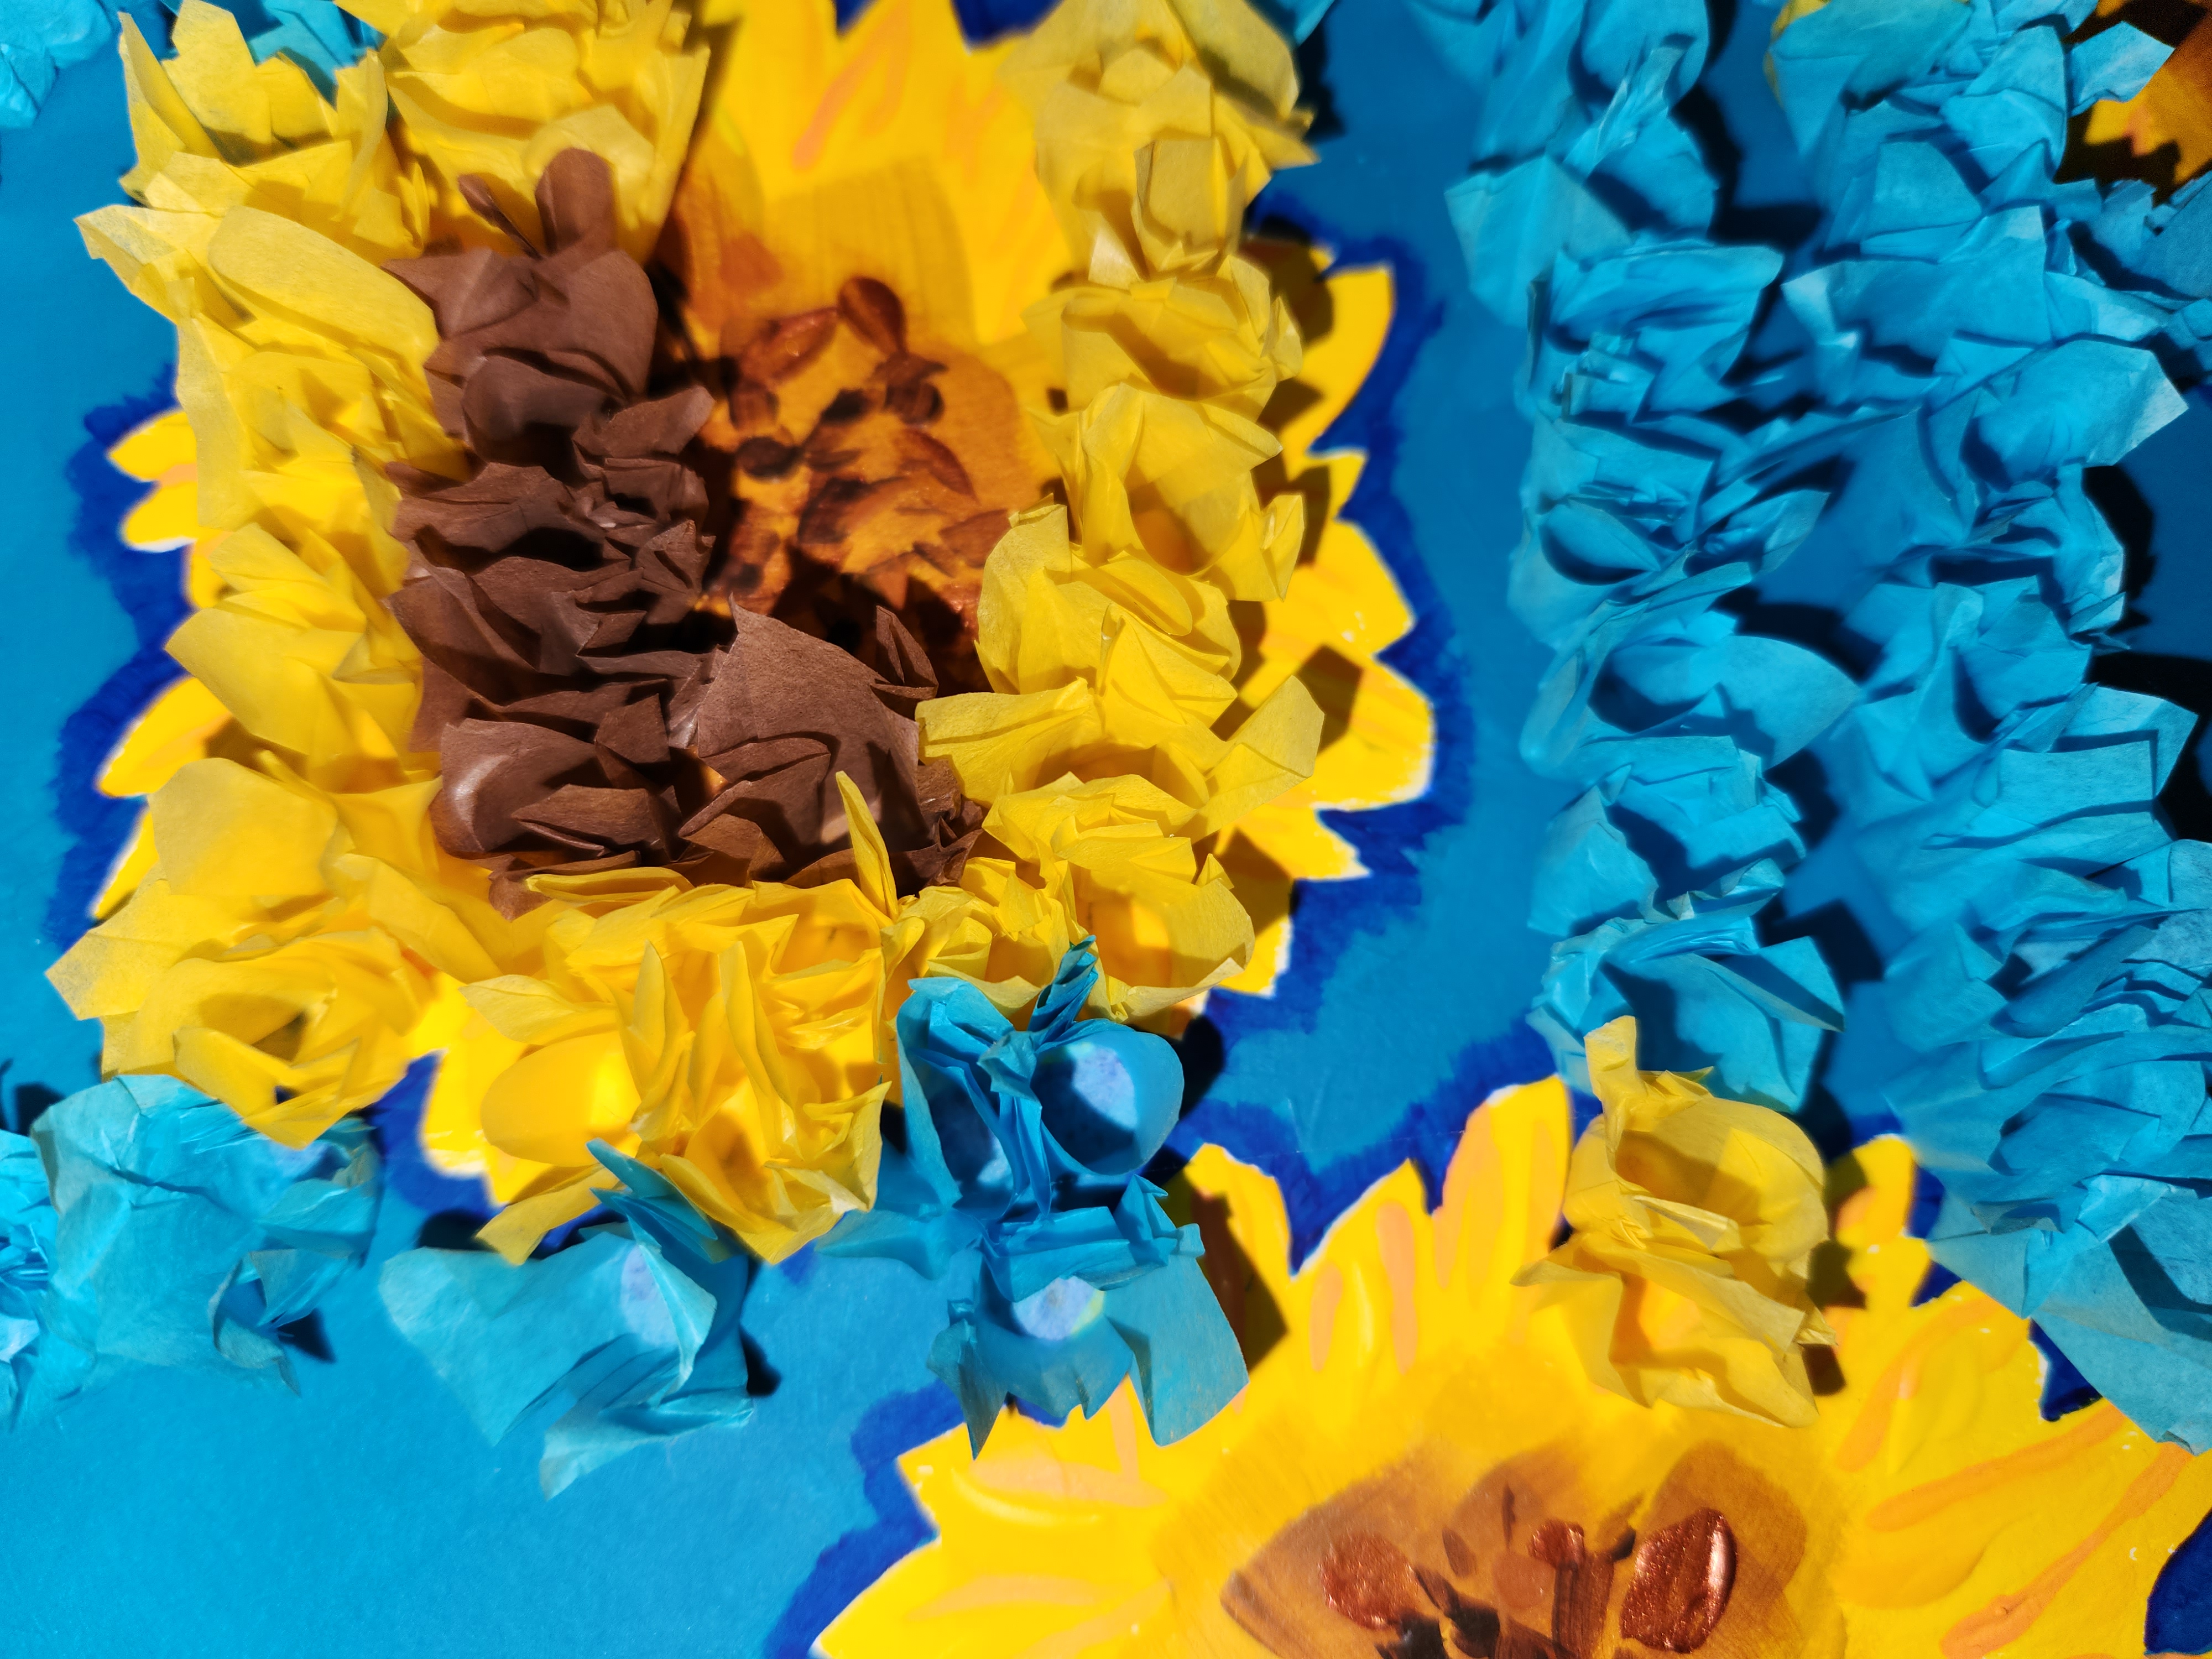
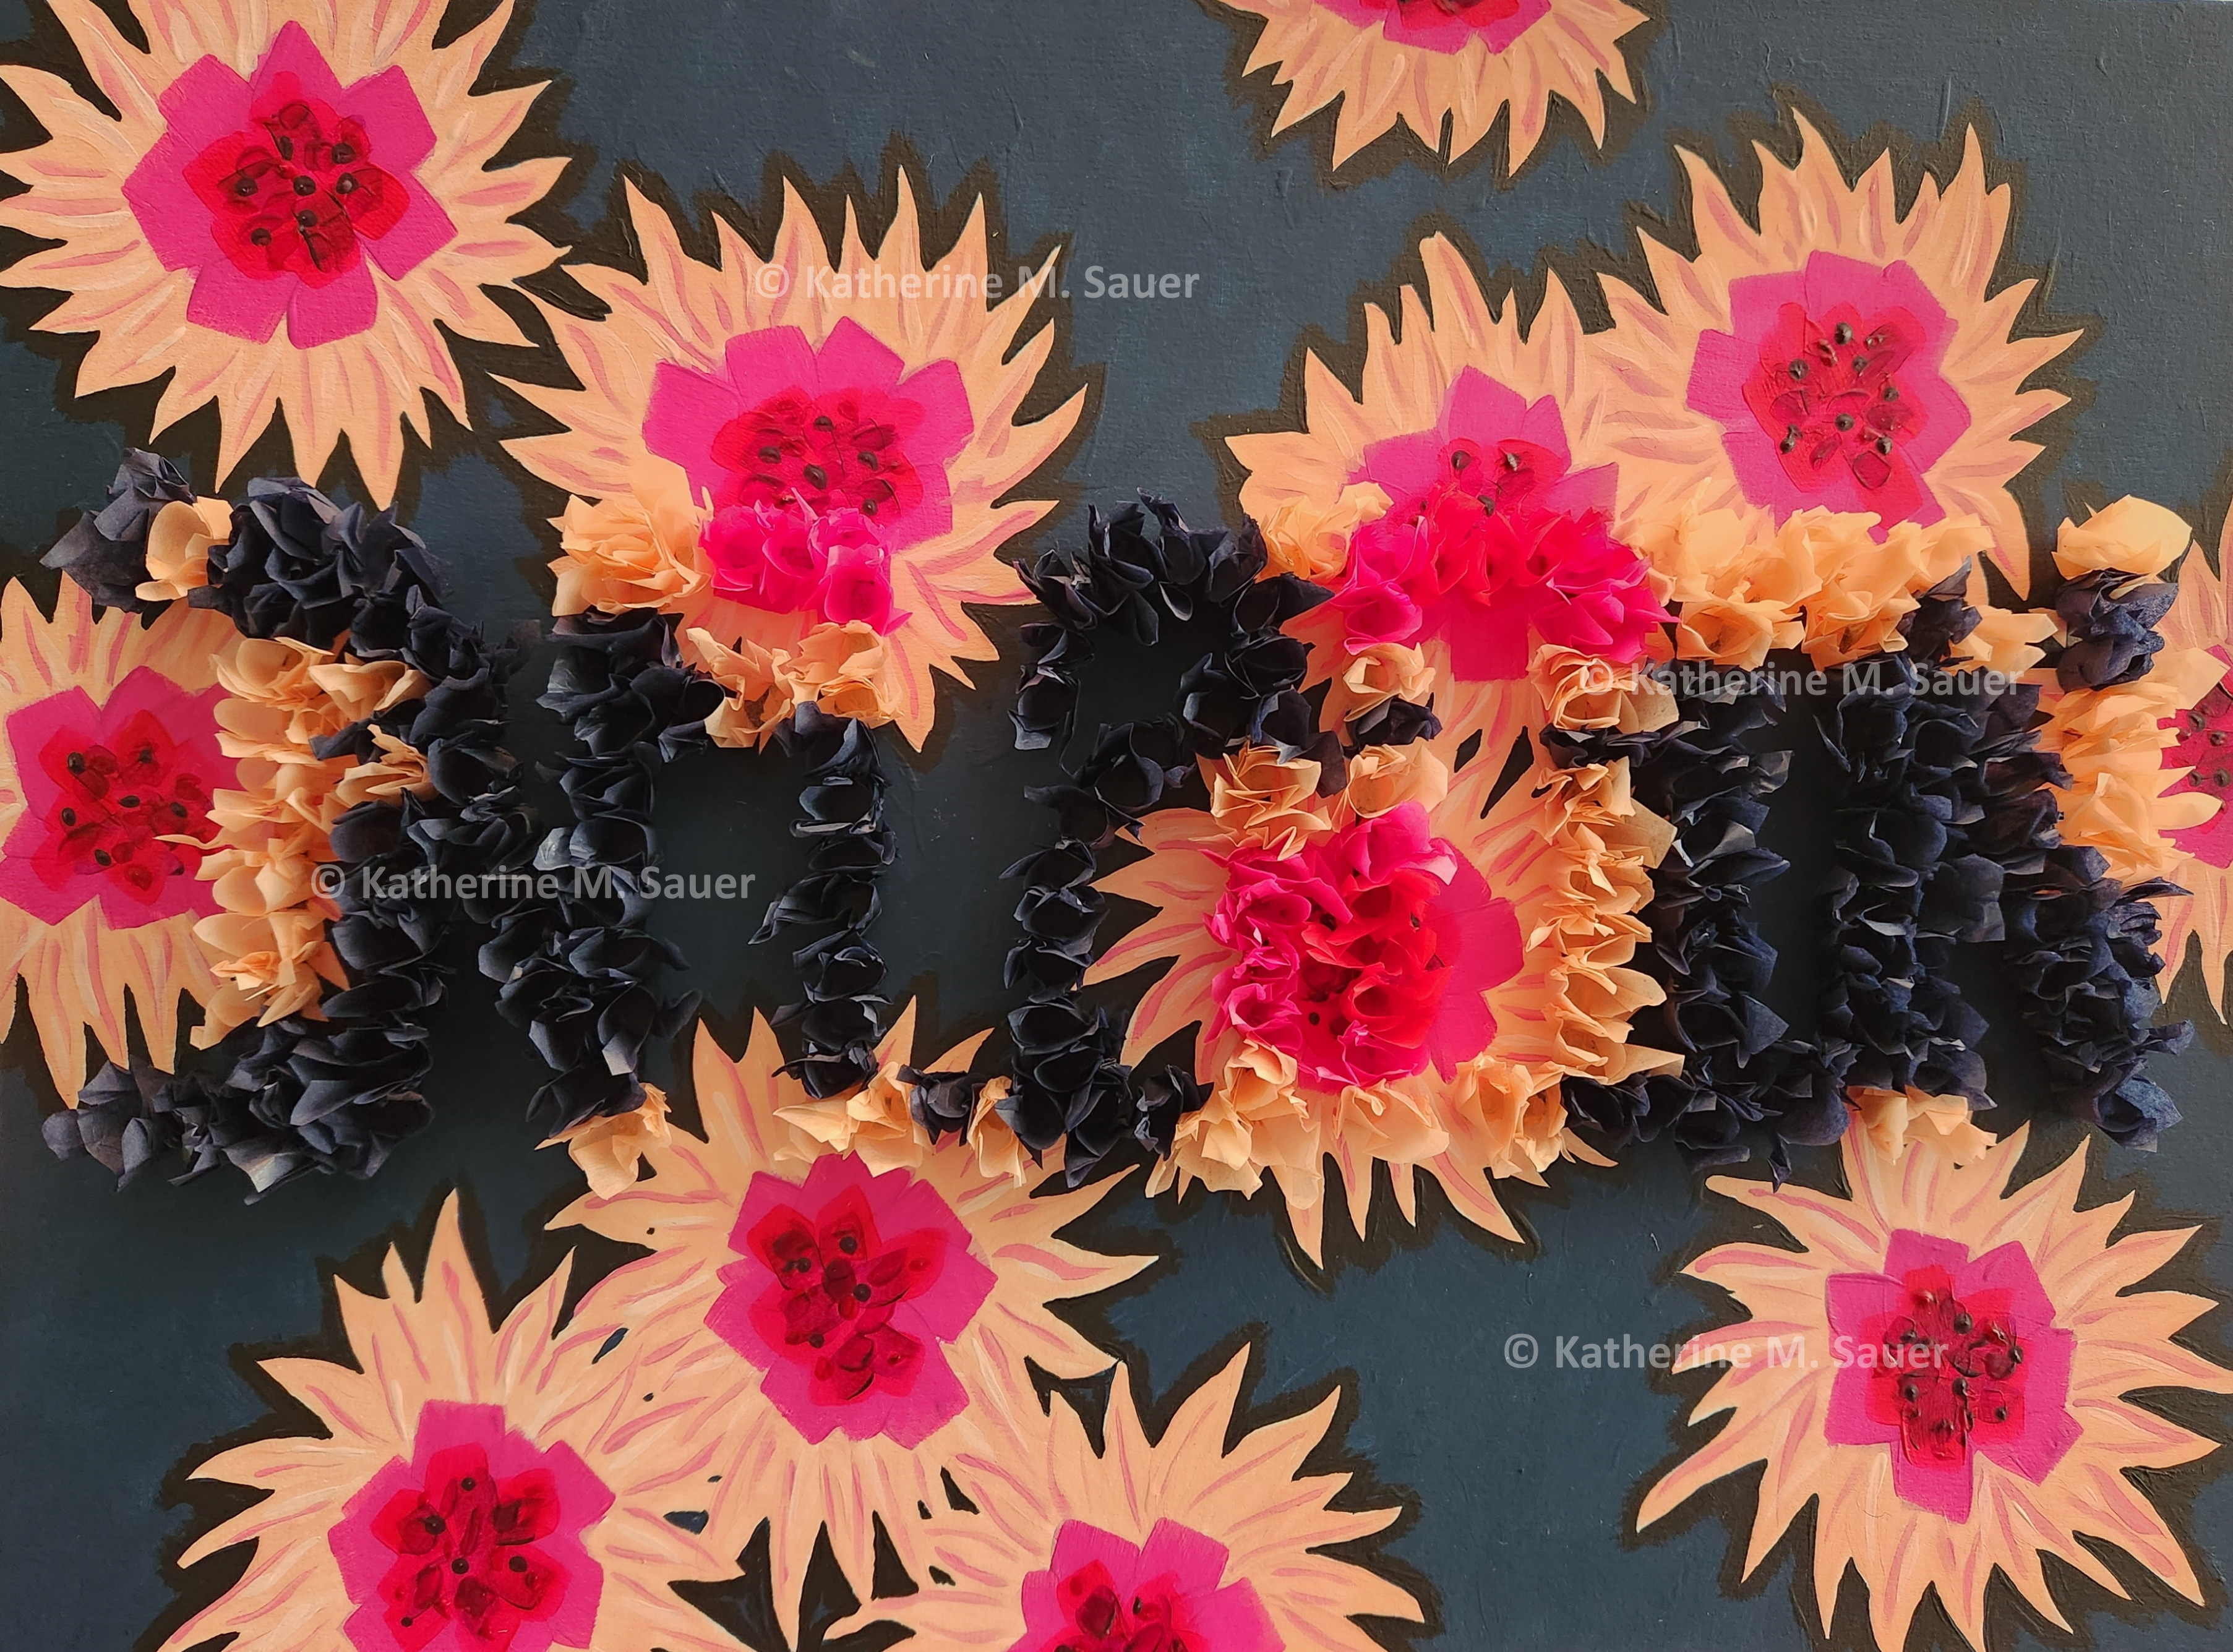
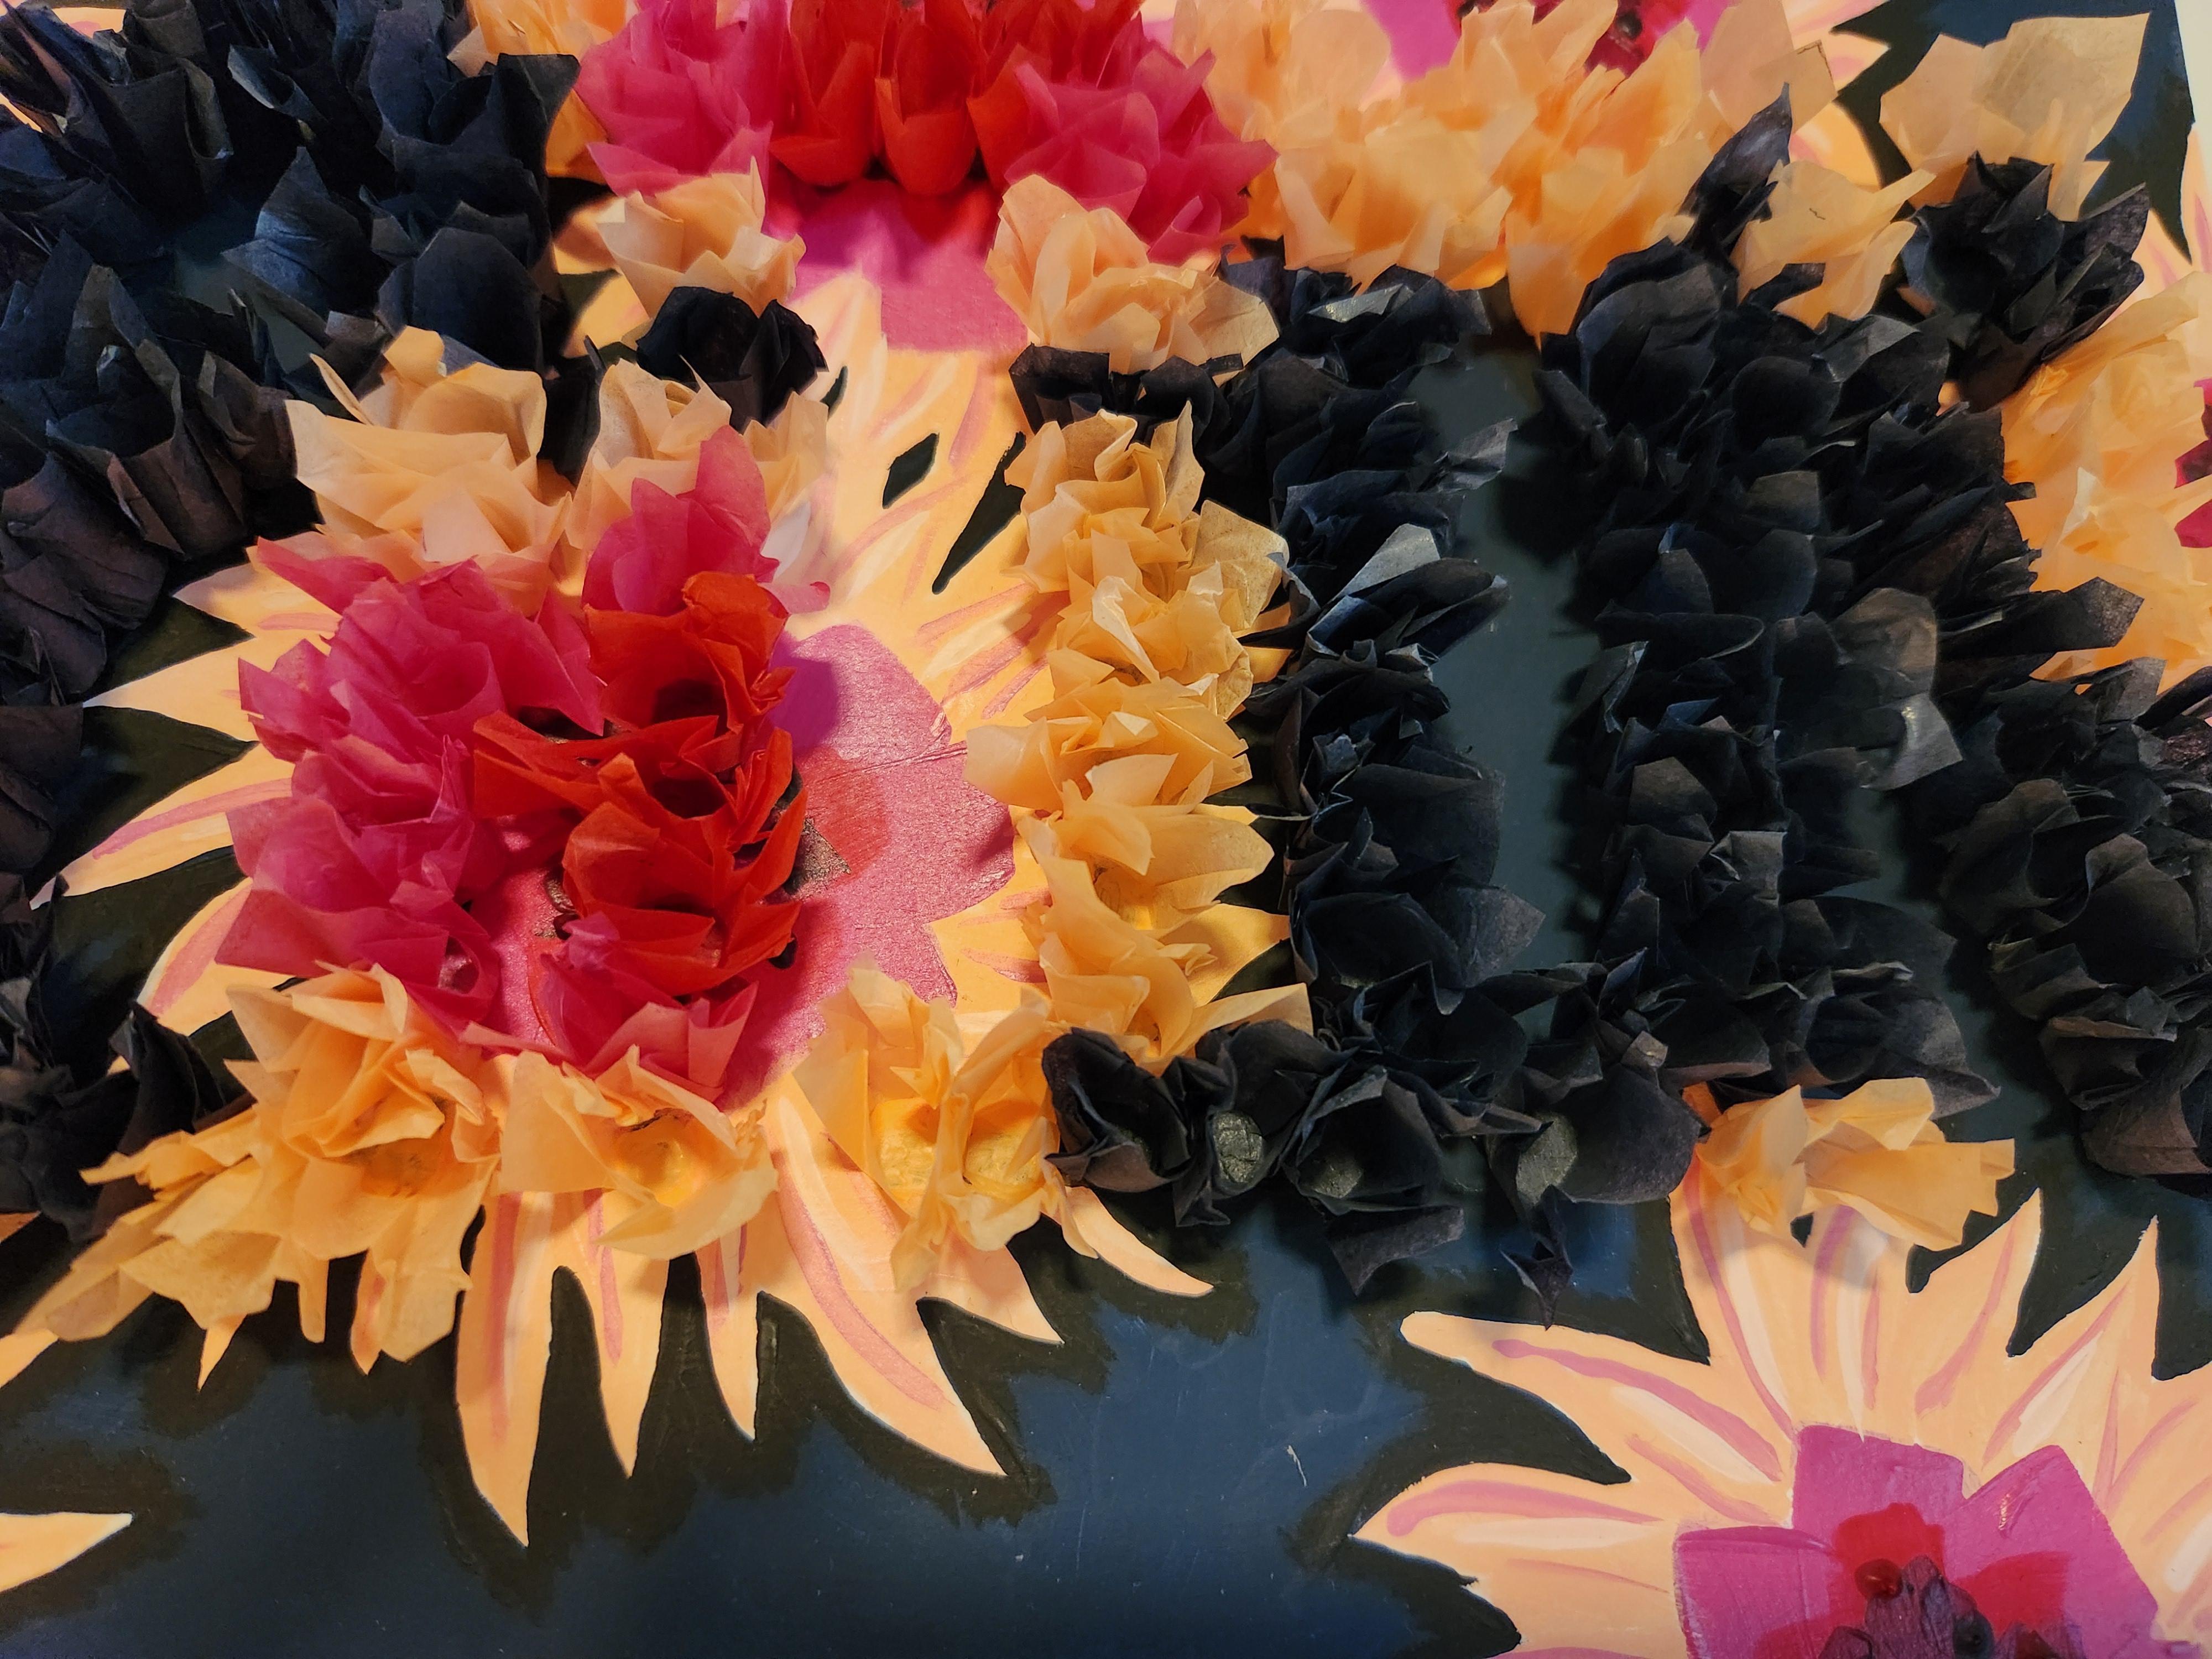
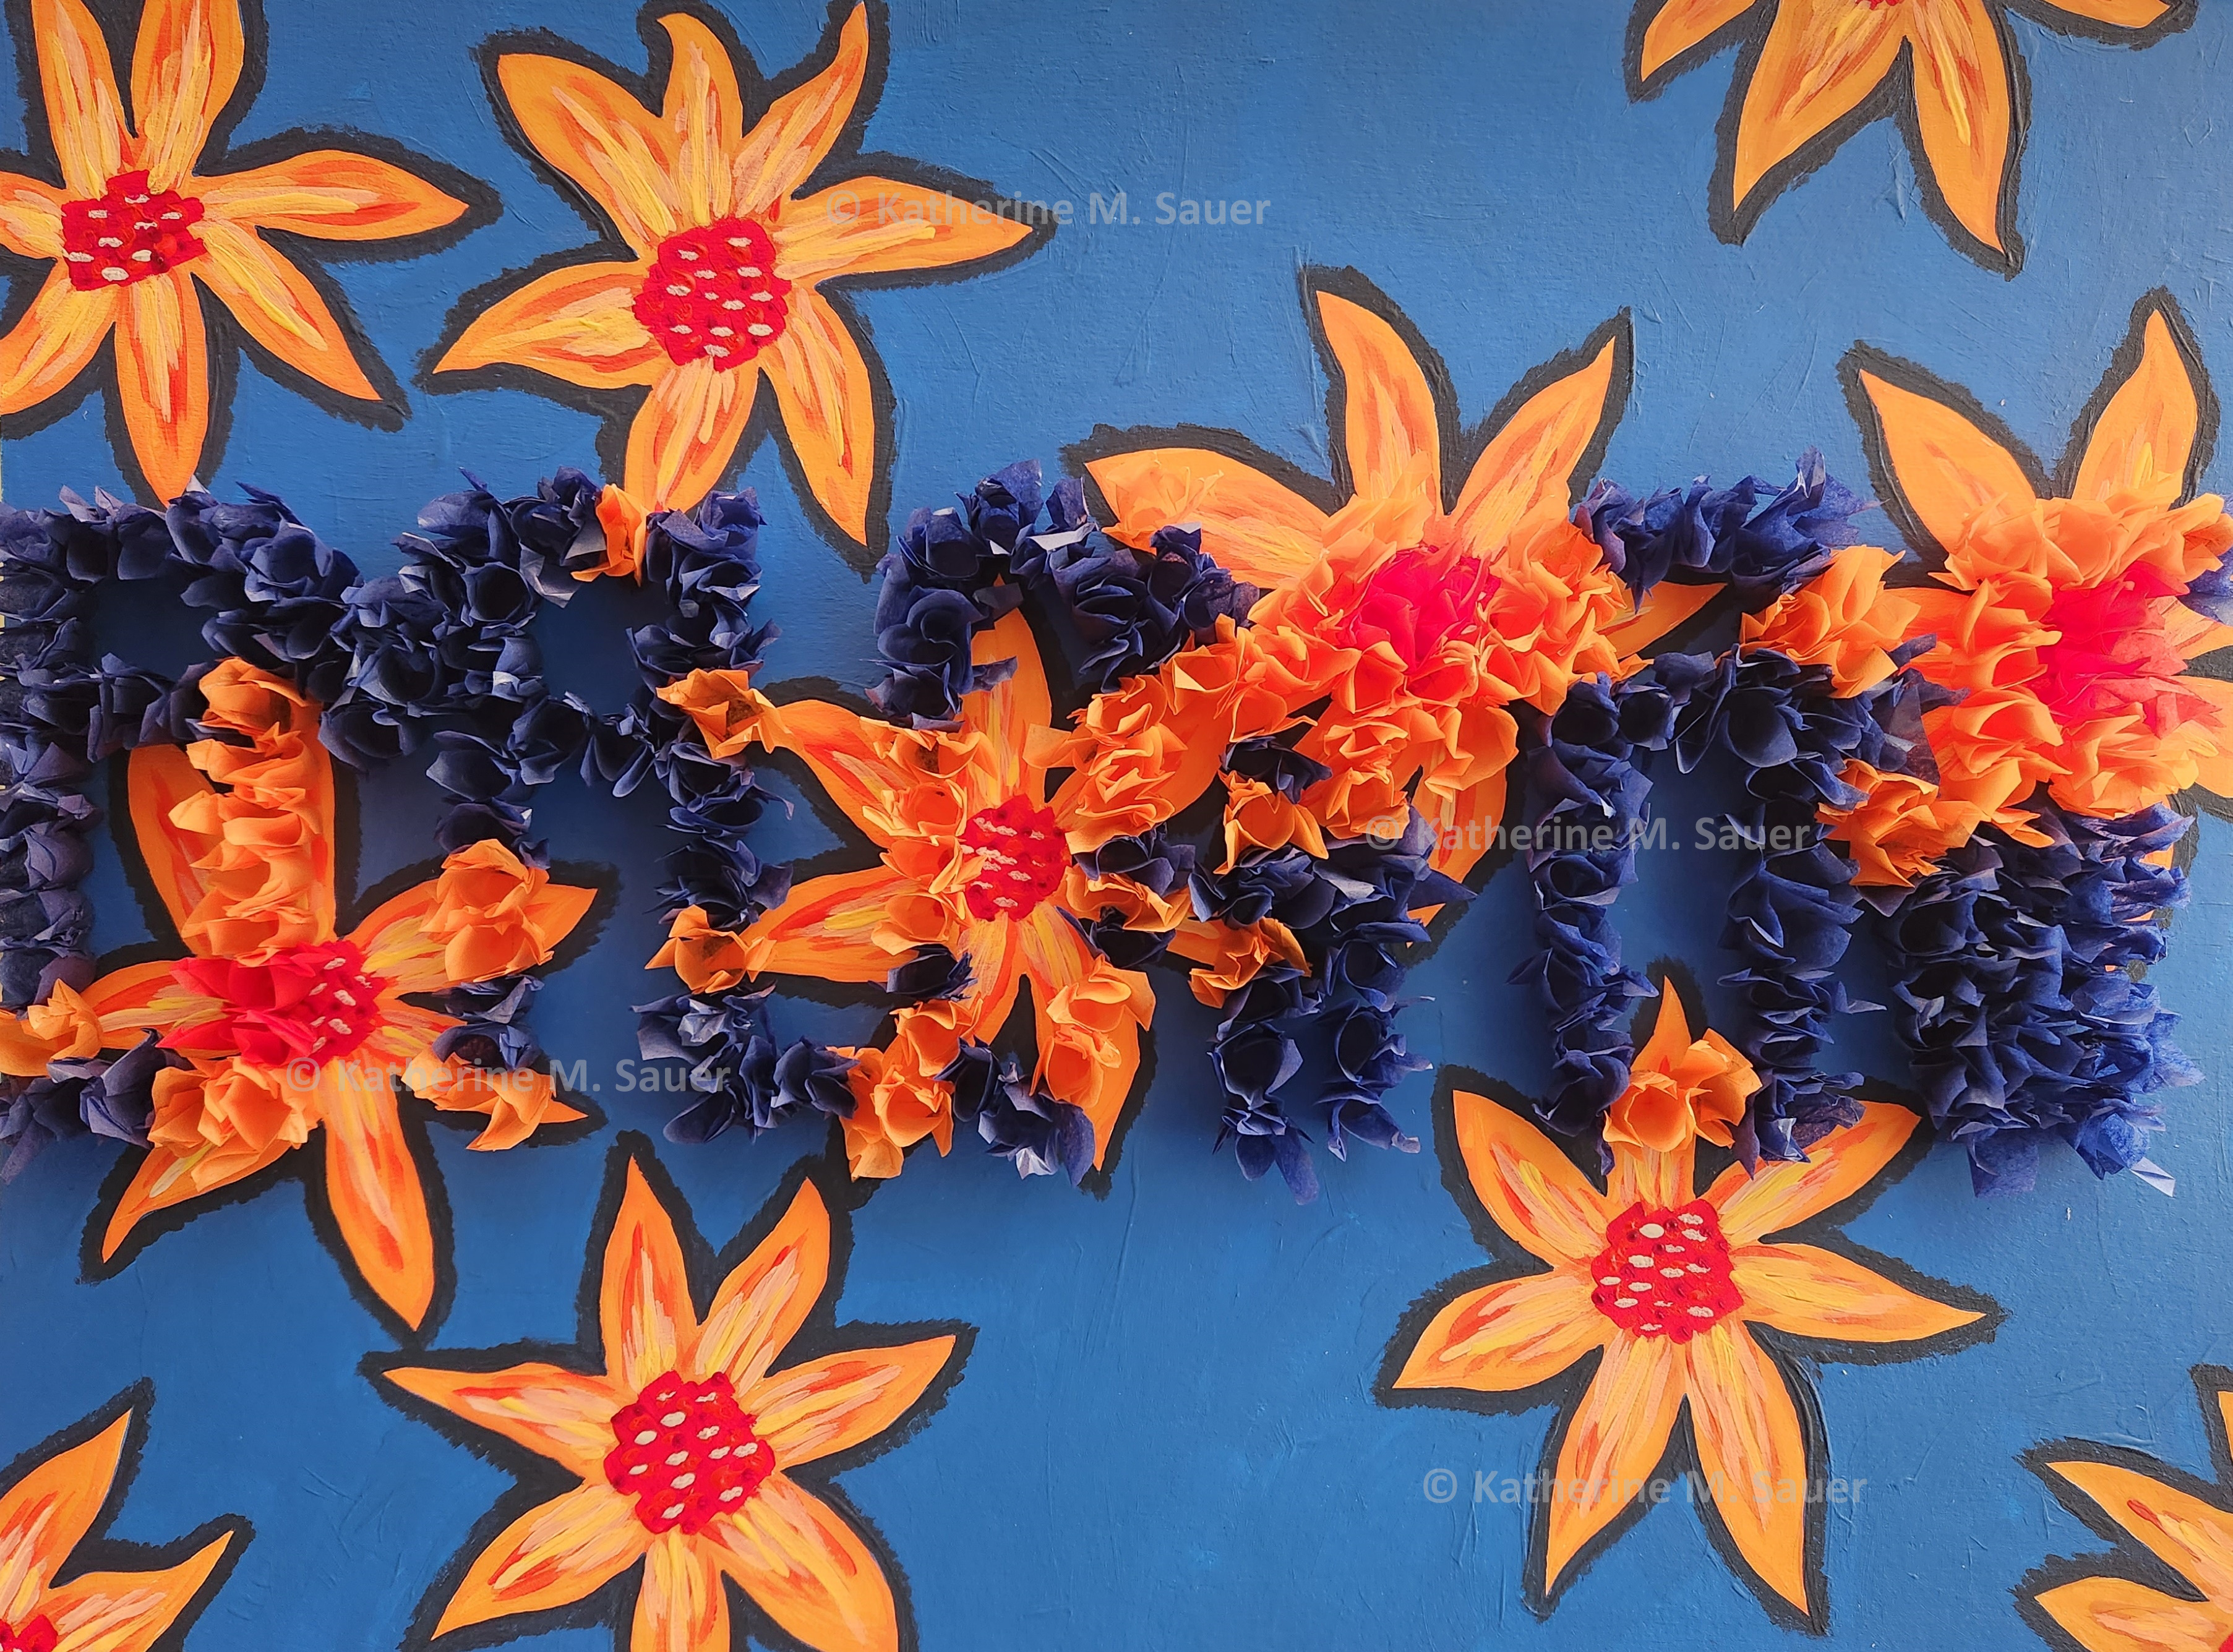
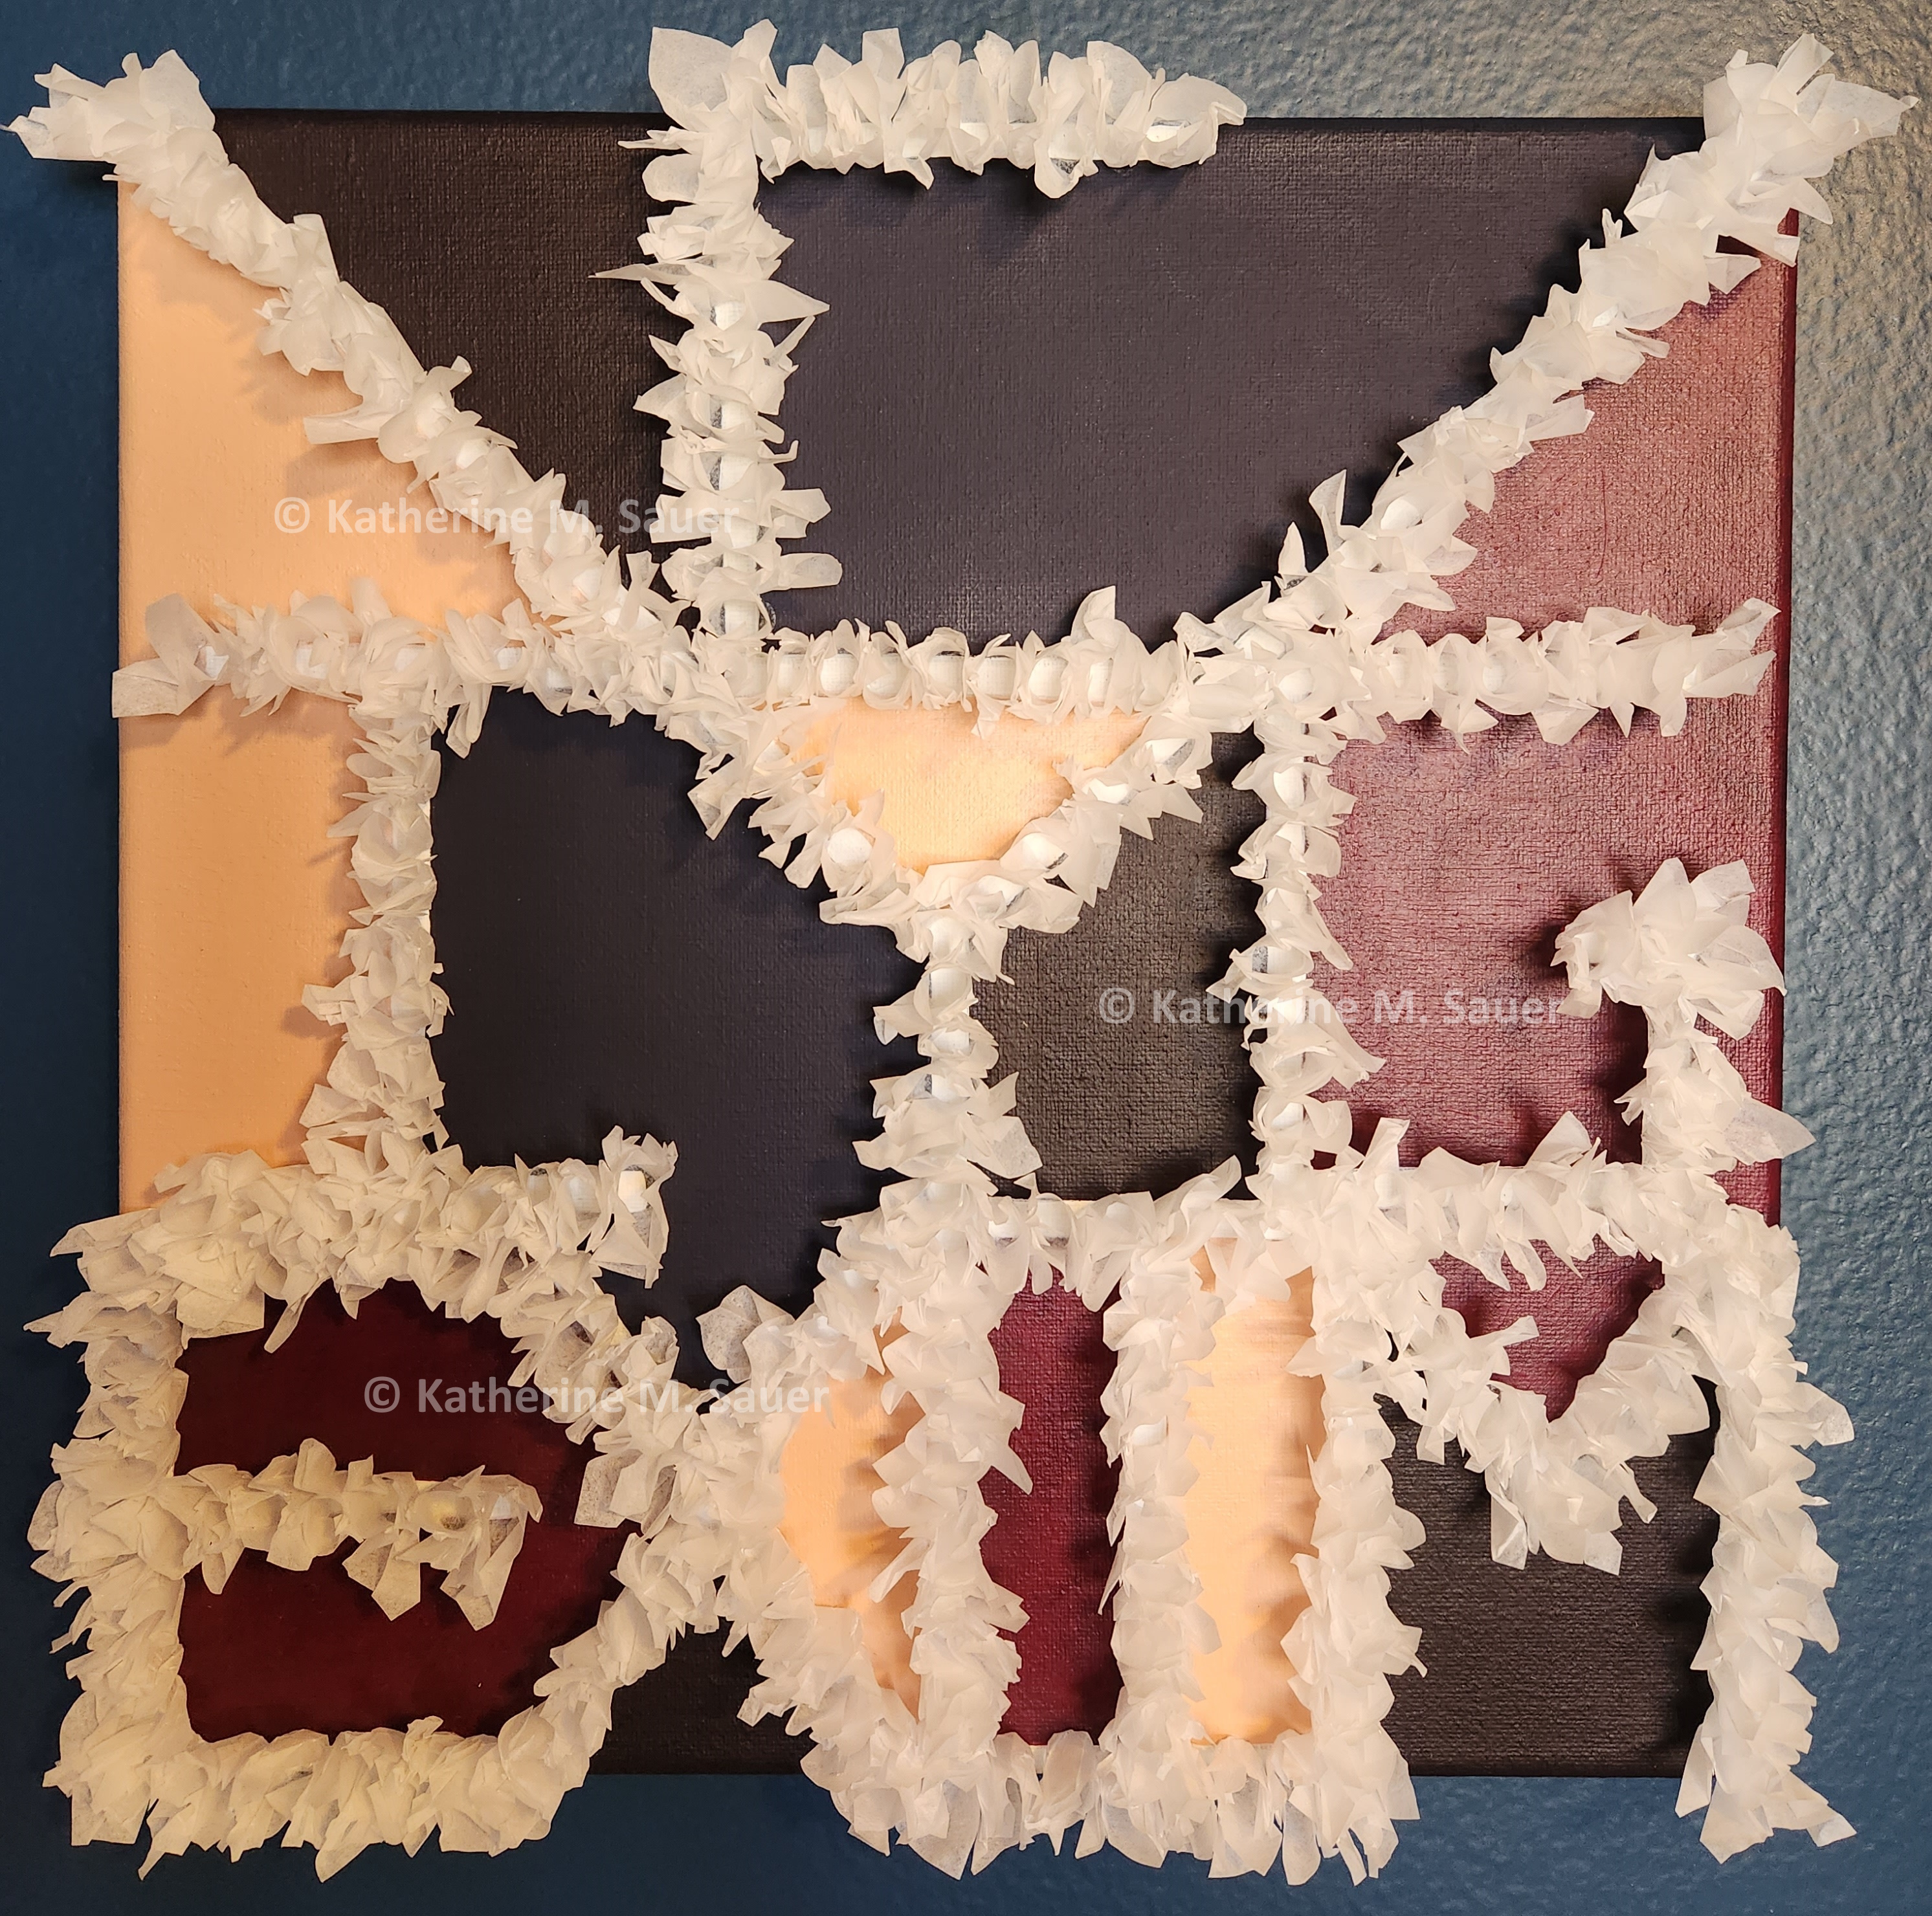
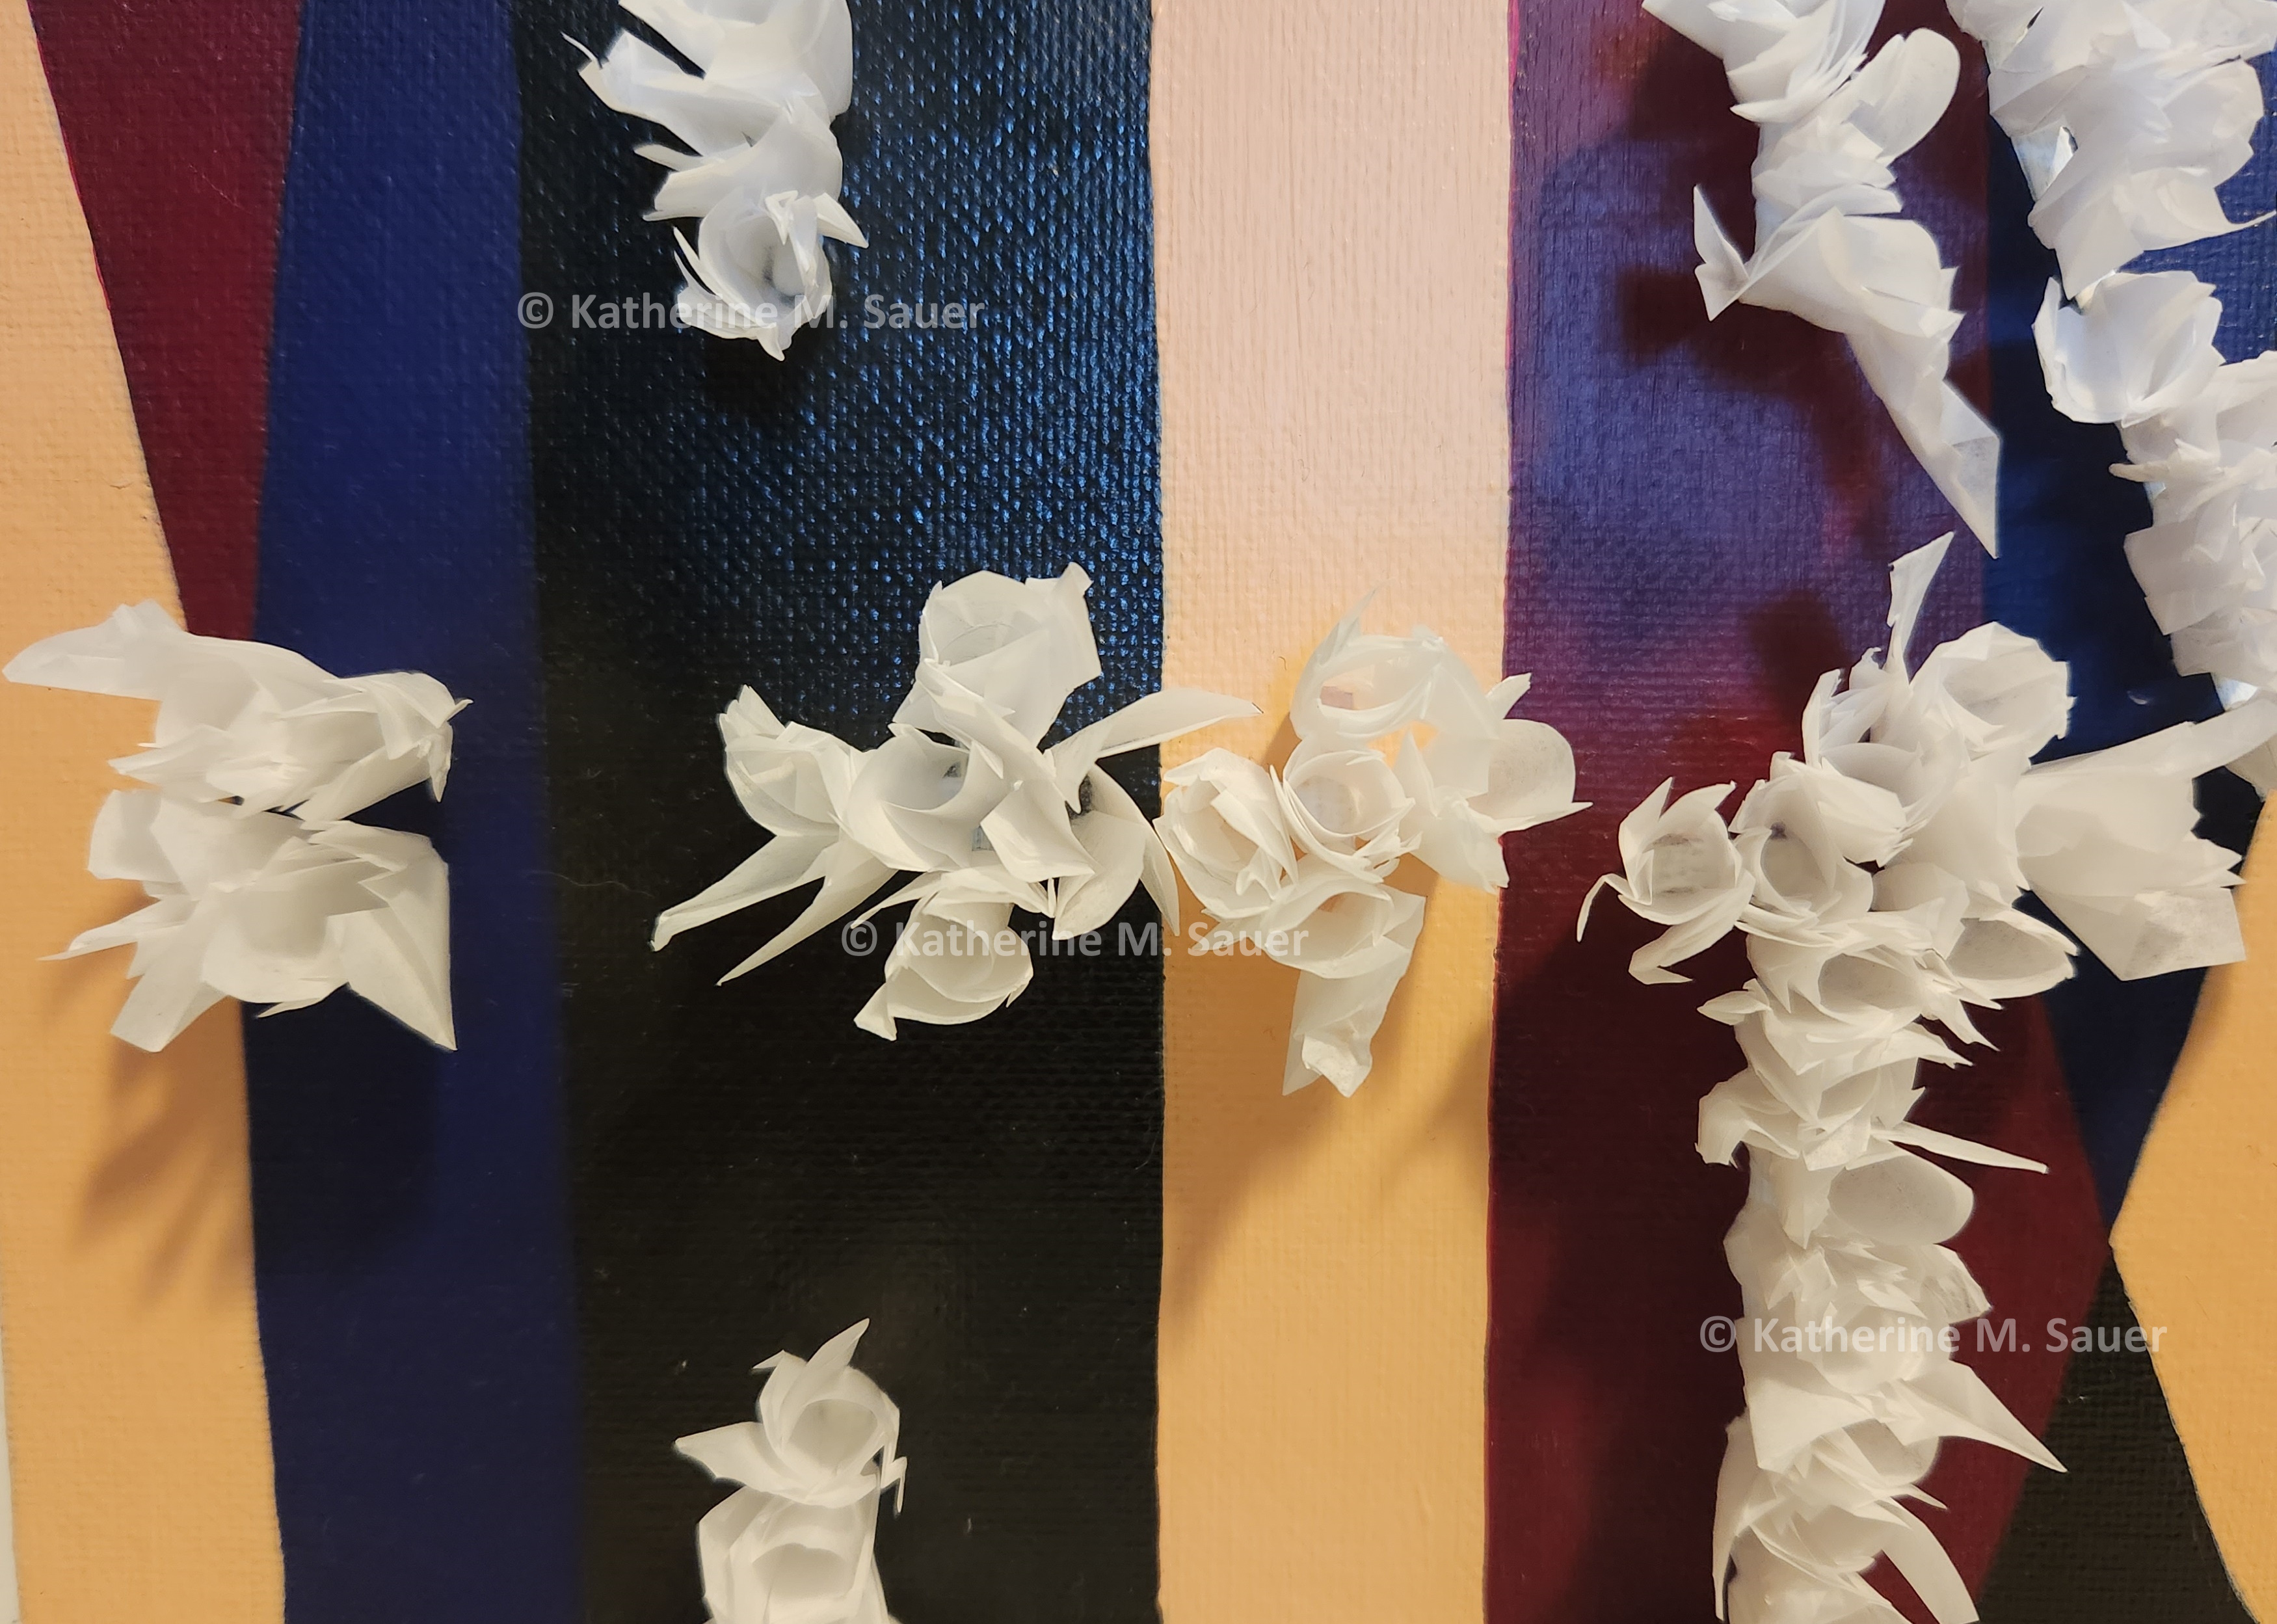
Gross Domestic Product is a way to measure the size of the economy, as measured by a dollar value. It is measured as the sum of its components: Consumption (what consumers spend), Investment (business investment and inventories and new homes), Government (spending by all levels of government), and Net Exports (EXports minus IMports, capturing the value of what is sold abroad minus what we buy from abroad). For short, Gross Domestic Product is often represented by GDP or by Y. This study explores the beauty inherent in the shapes of the letters themselves.
YCIGEXIM | 12″ x 12″ | acrylic and tissue paper on canvas
YCIGNX | 7″ x 5″ |acrylic and tissue paper on canvas board
GDP | 7″ x 5″ | acrylic and tissue paper on canvas board
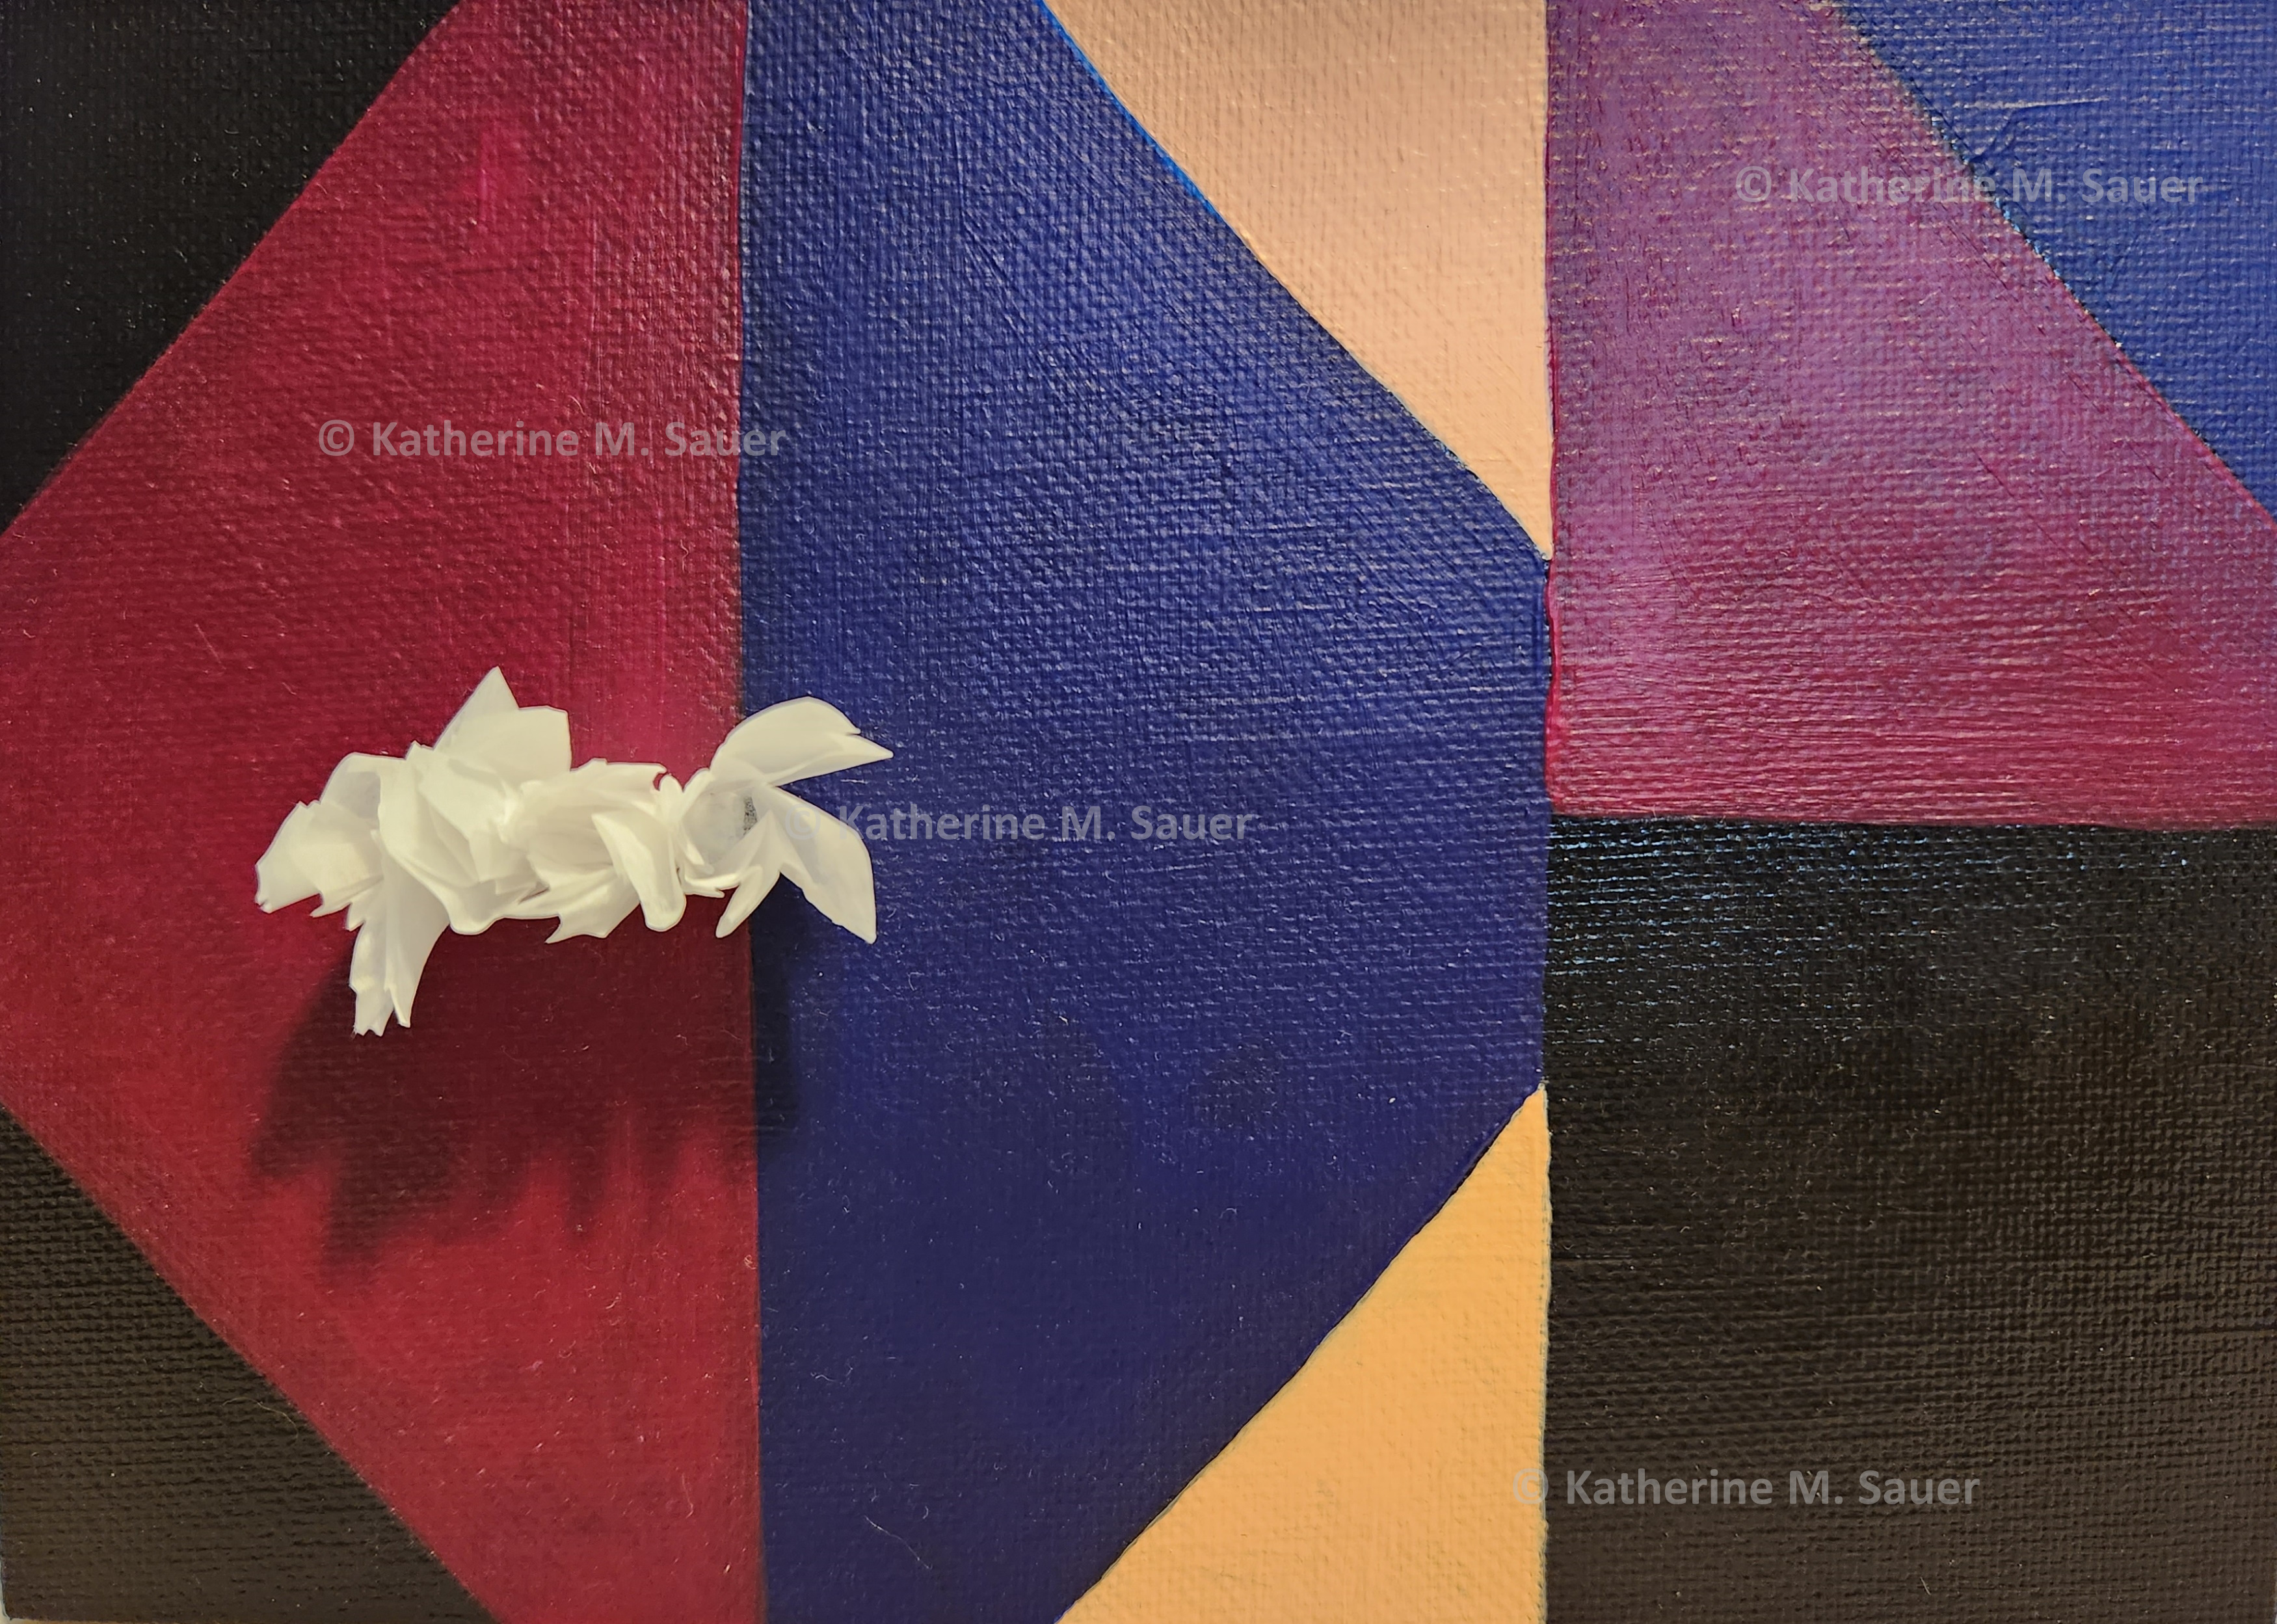
The dynamics of economy-wide consumption and production changes are depicted in this study: 1) low inflation with positive growth 2) a contraction with significant inflation 3) tolerable inflation with positive growth. Embellishments with ribbon and beads, along with the color palette, are meant to evoke the skilled craftswork that goes into a handmade quilt – though beautiful home crafts are not counted in the value of the economy.
ADAS I, II, and III | each 7″ x 5″ | acrylic, ribbon, and seed beads on canvas board
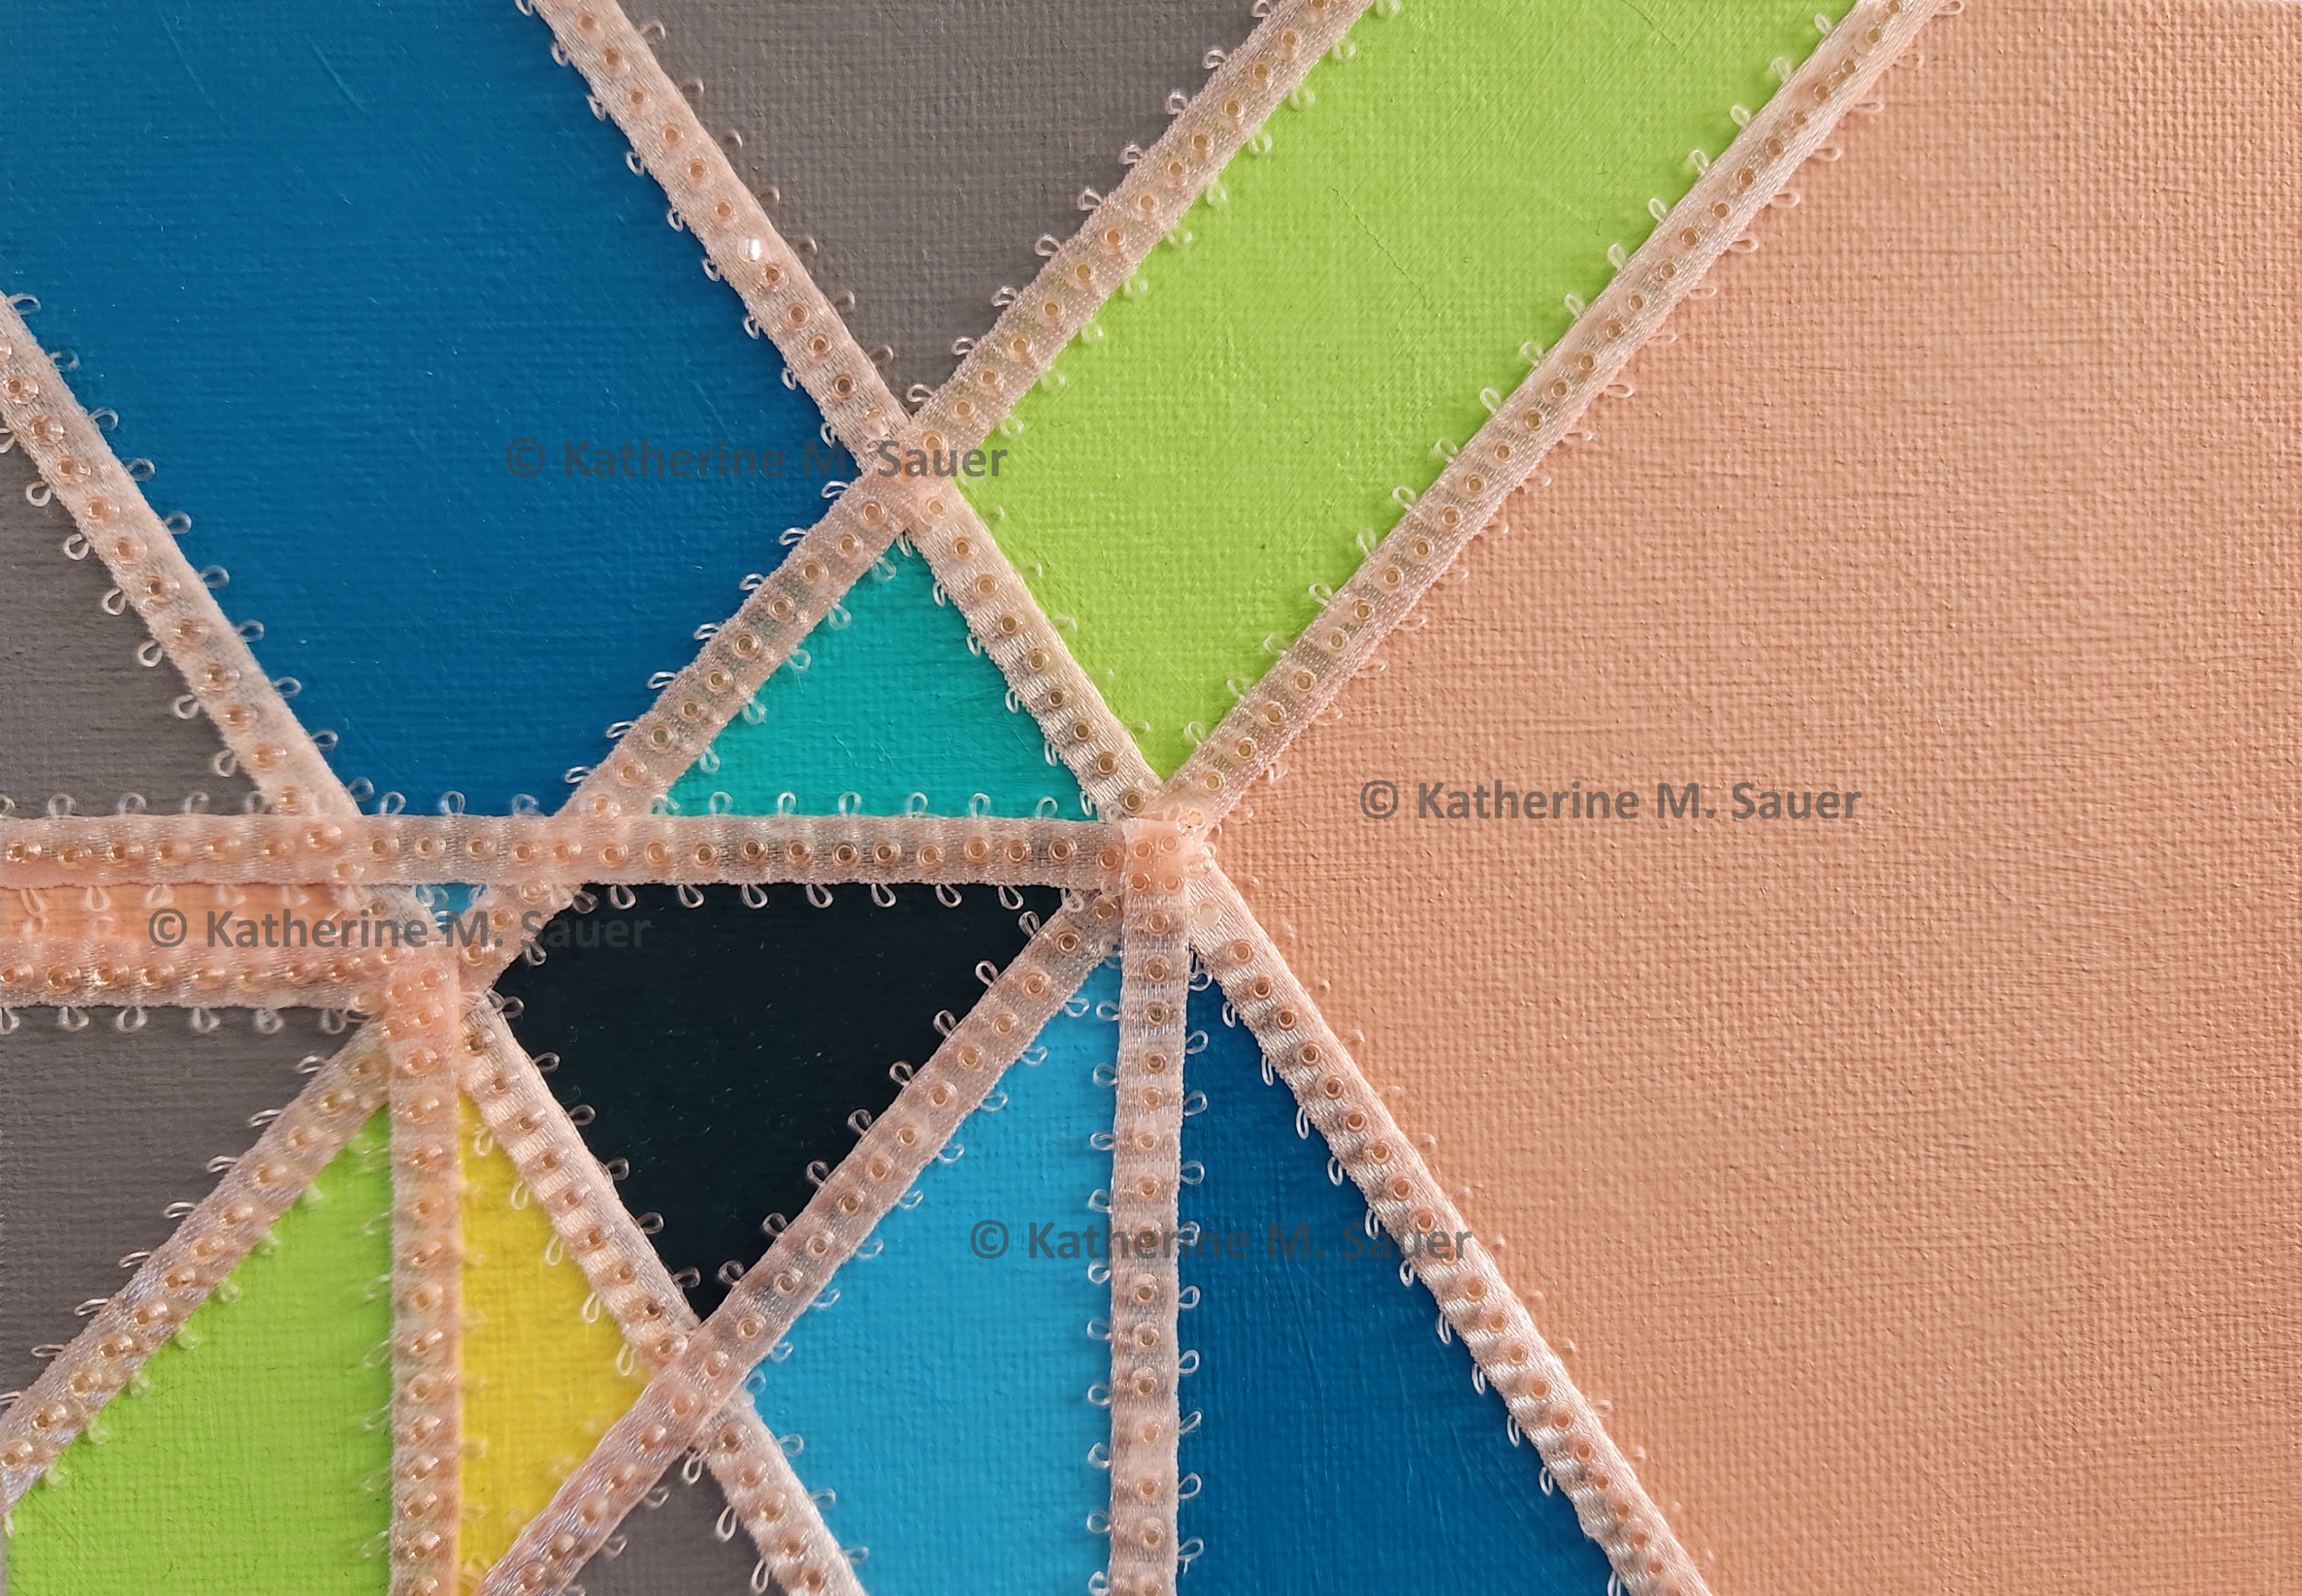
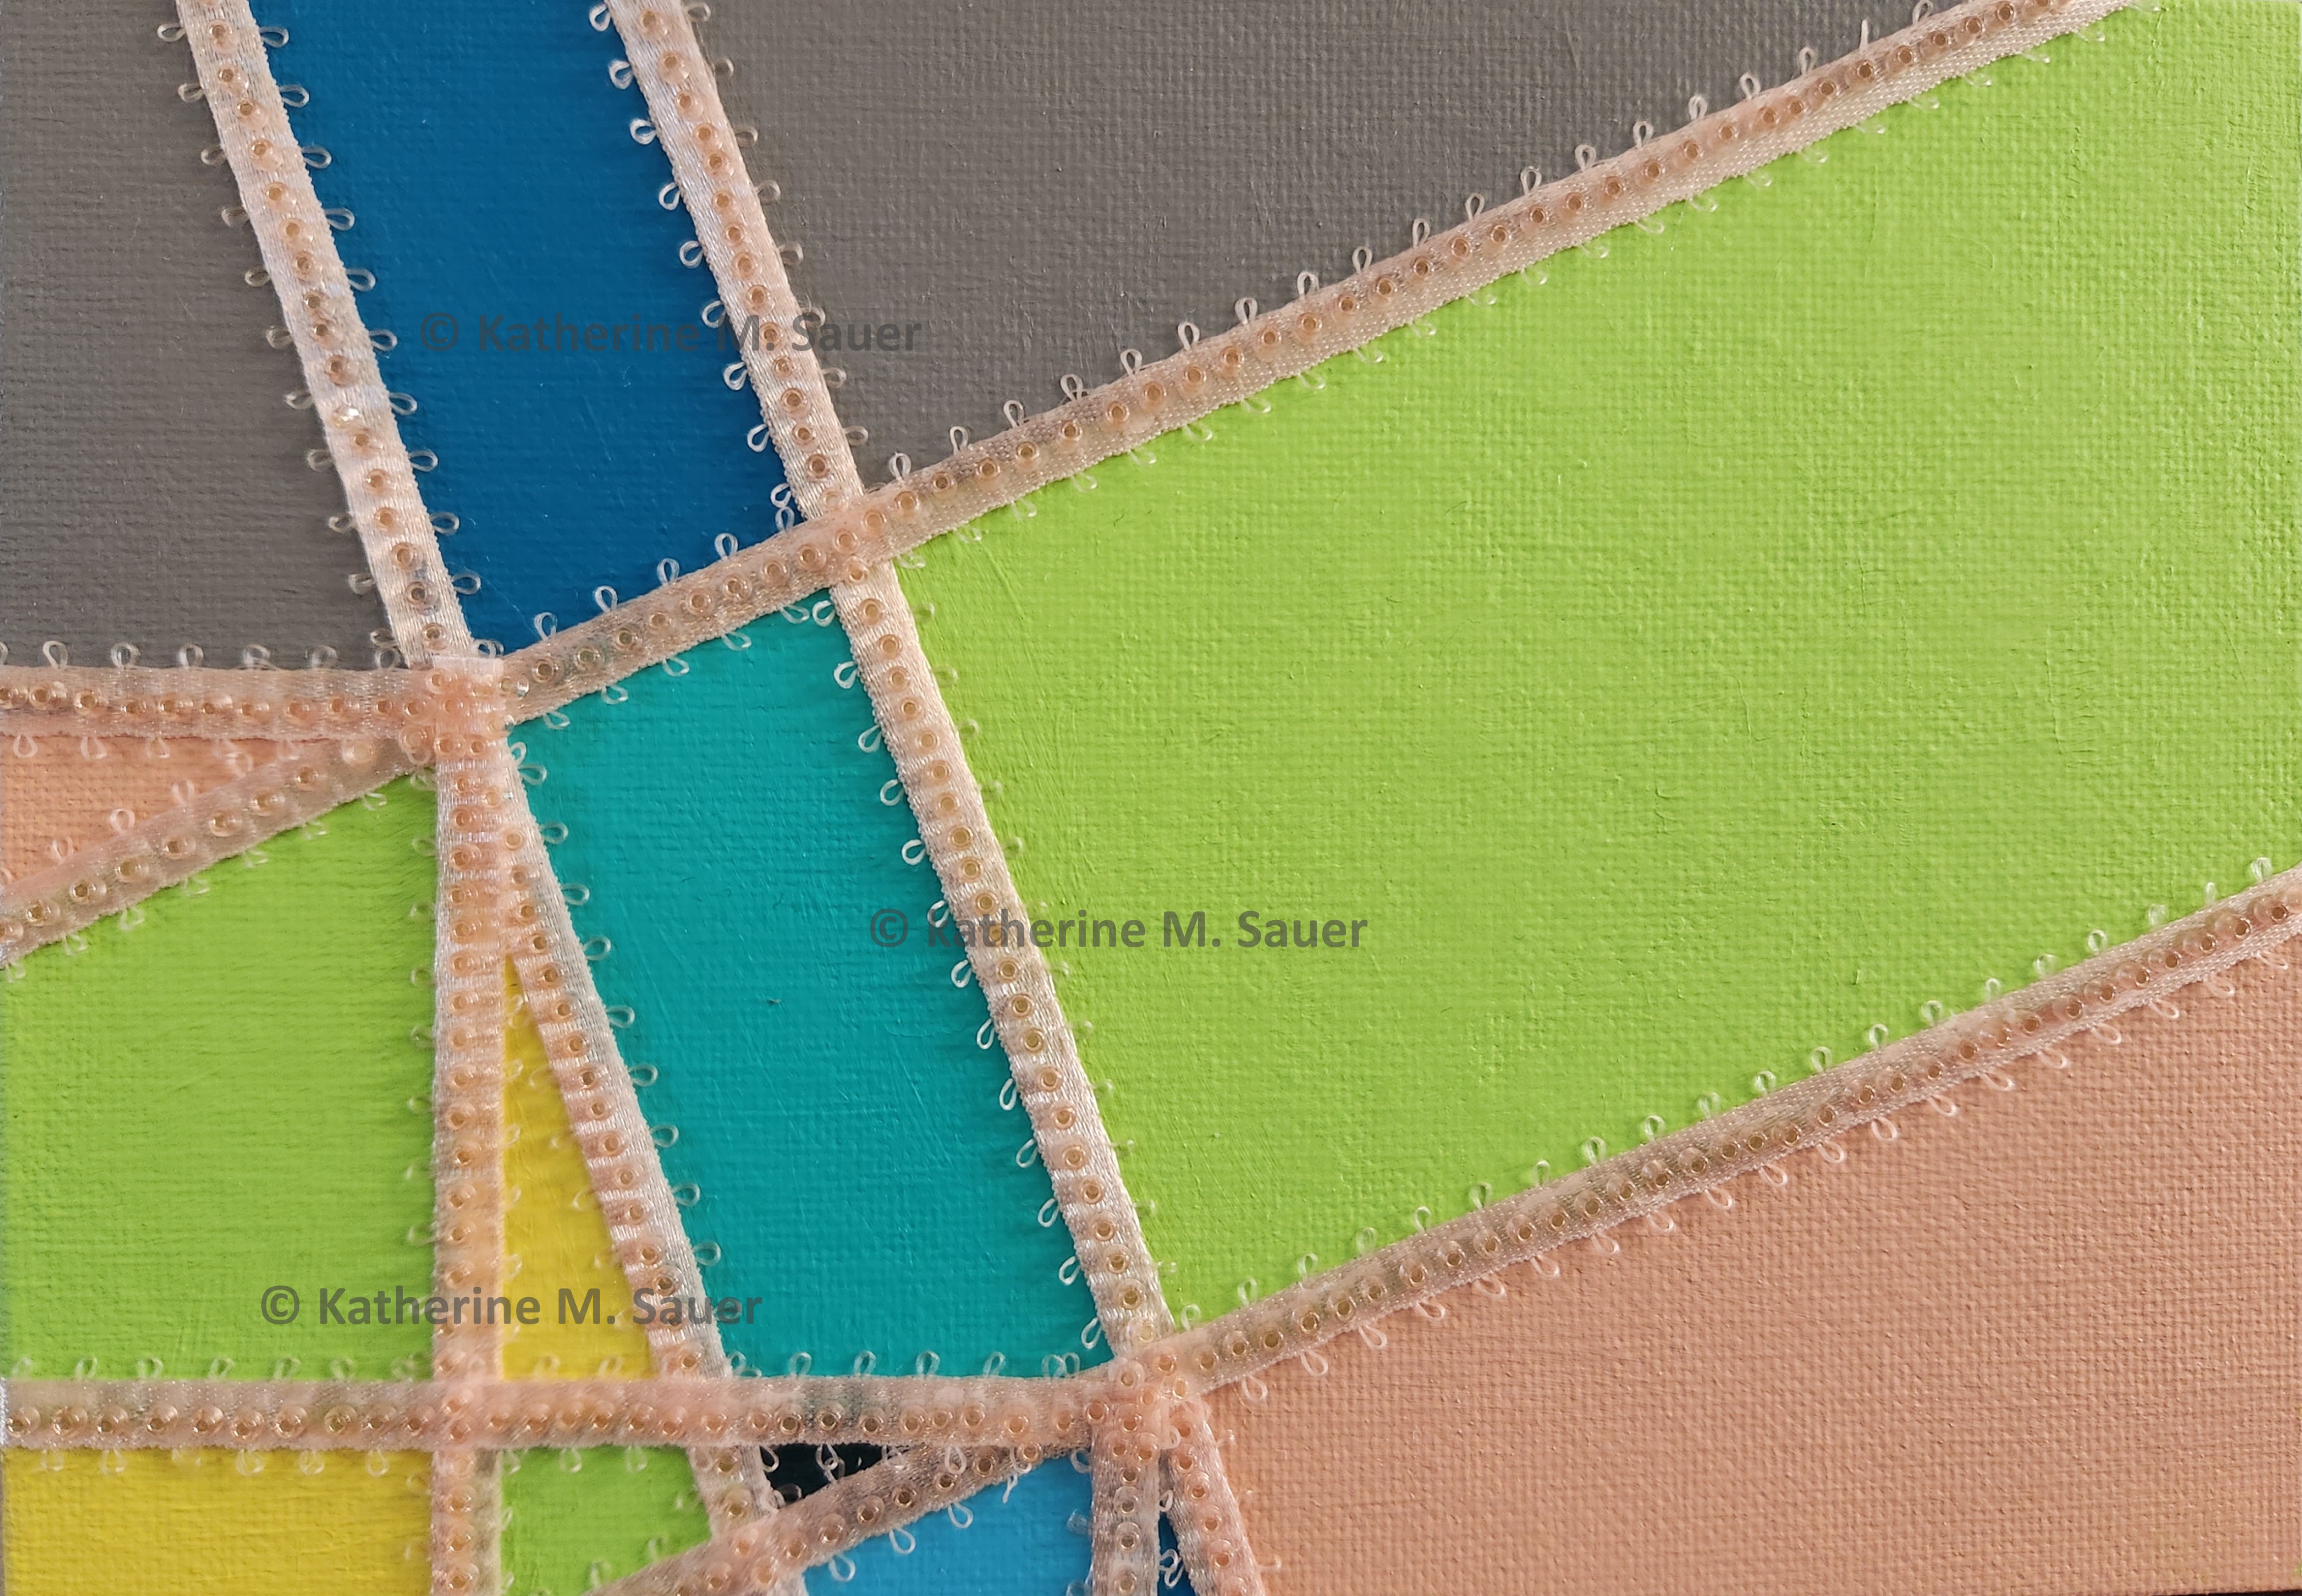
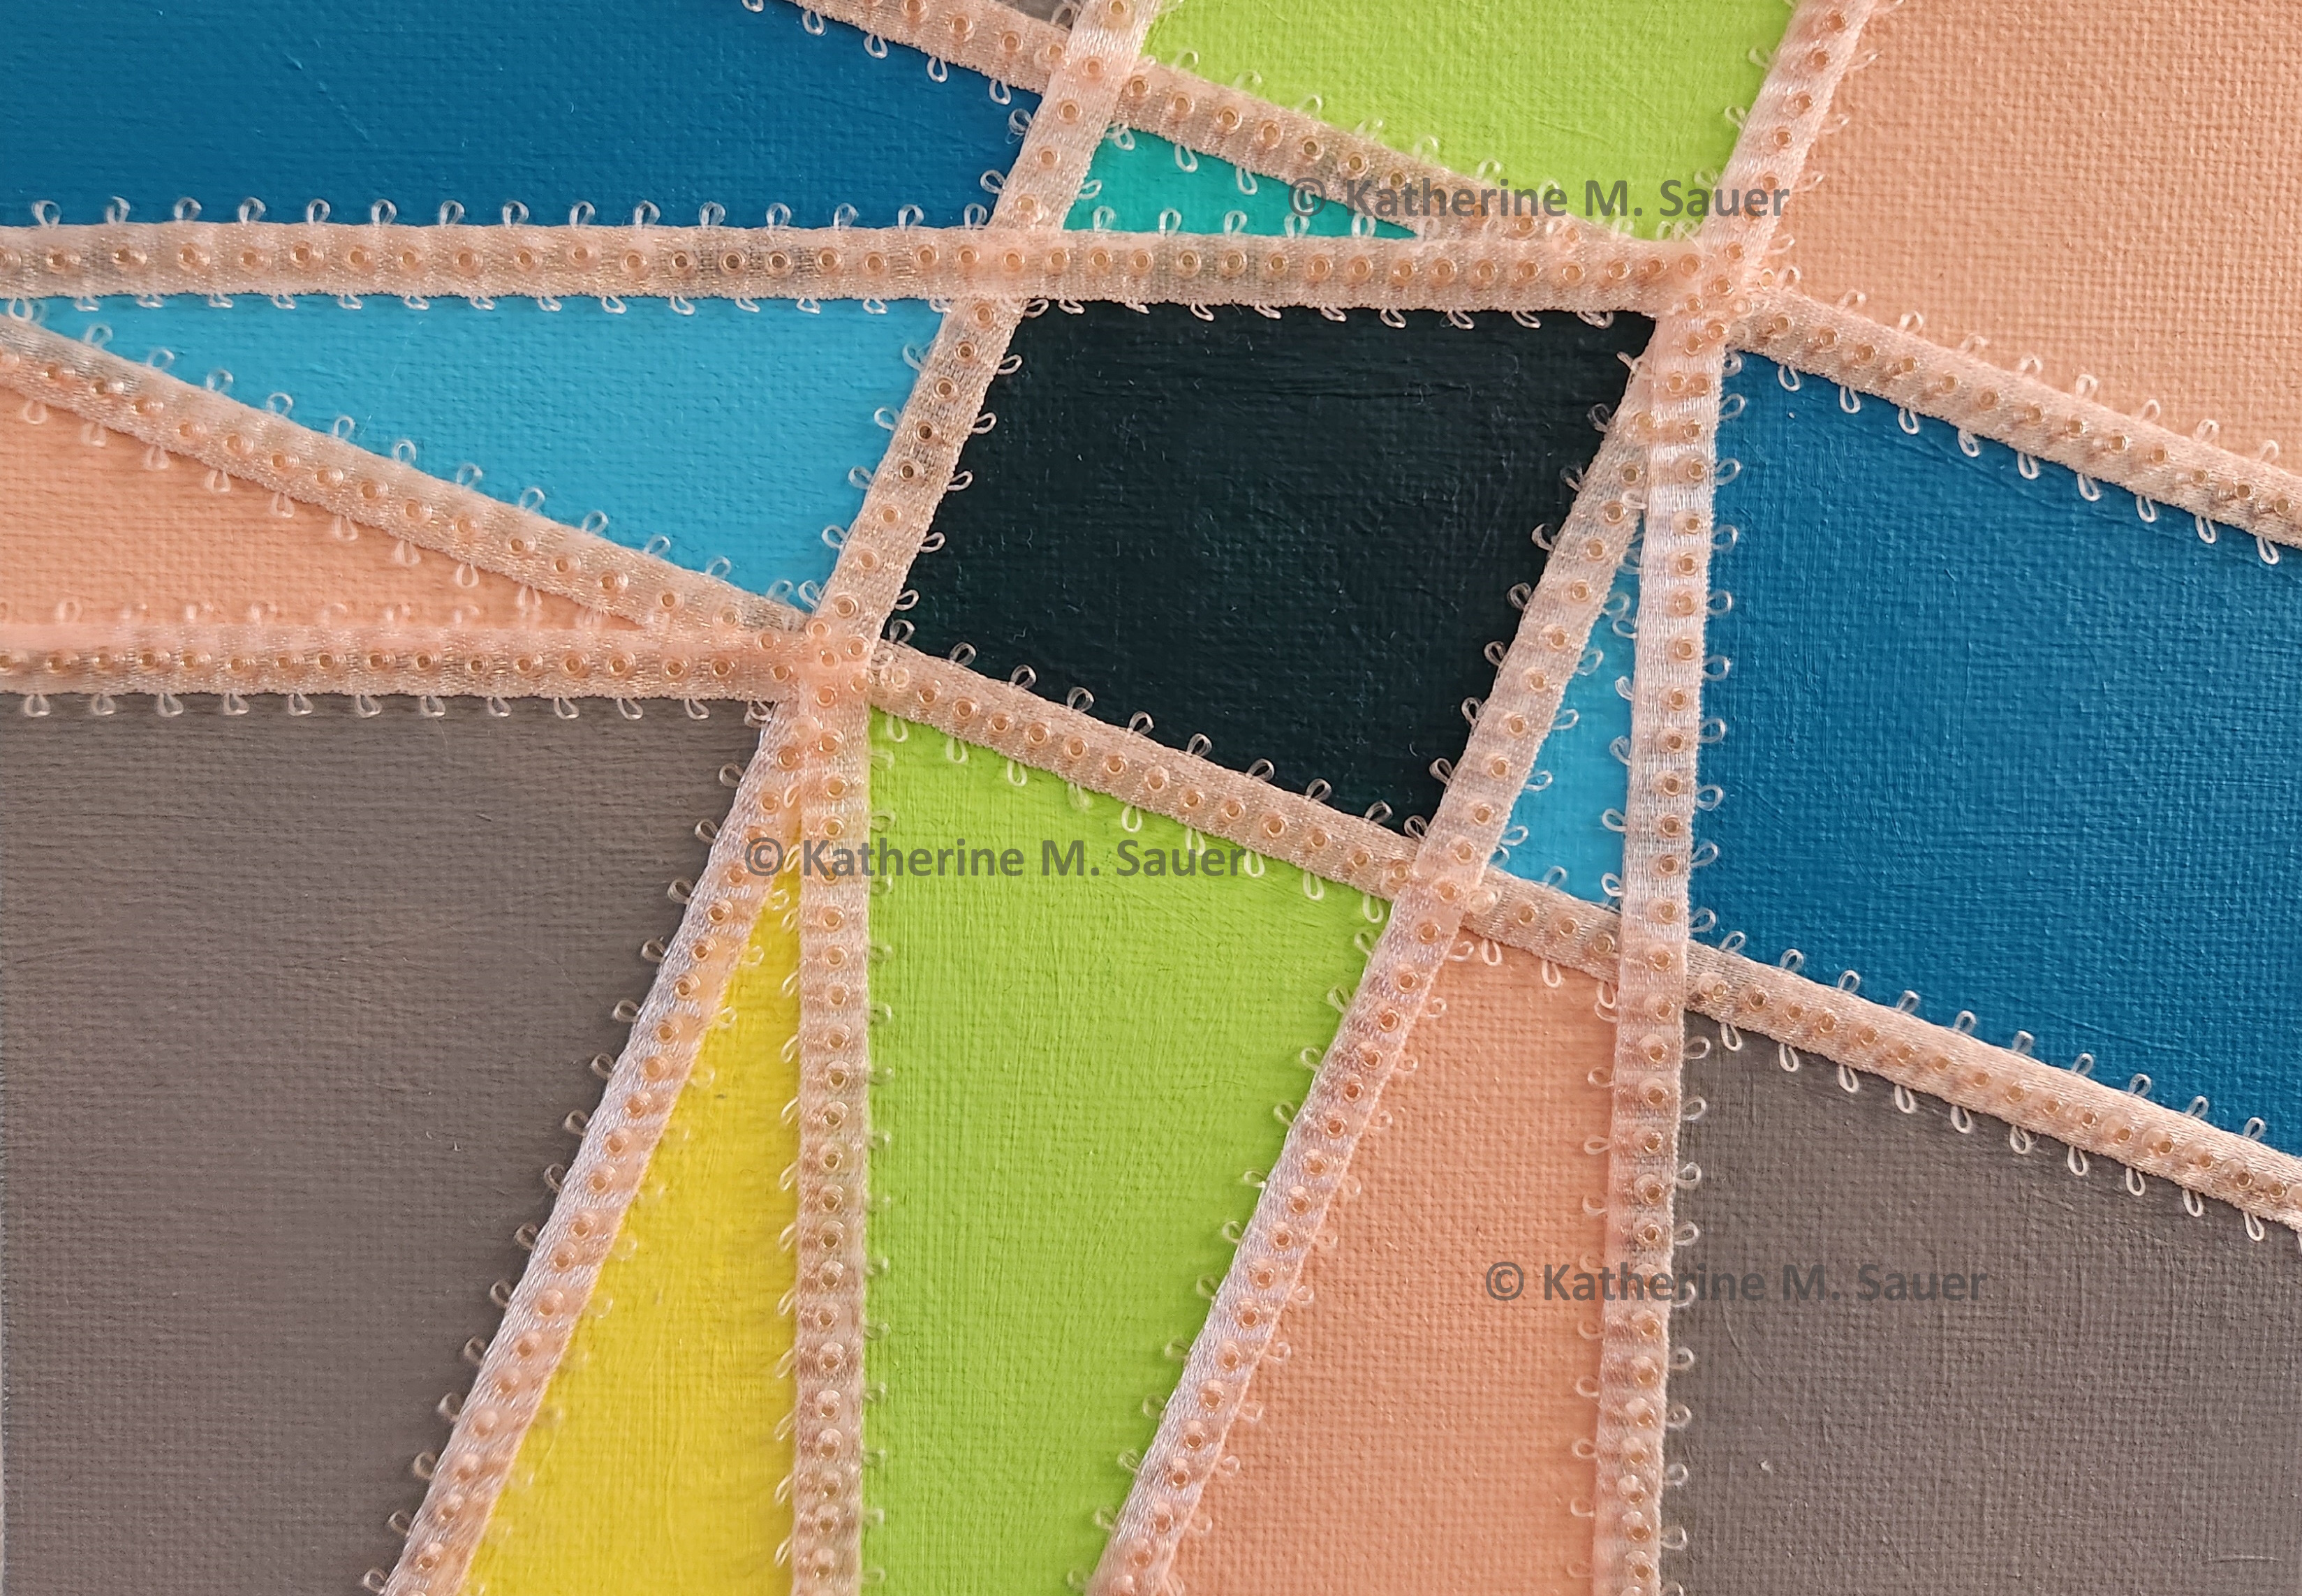
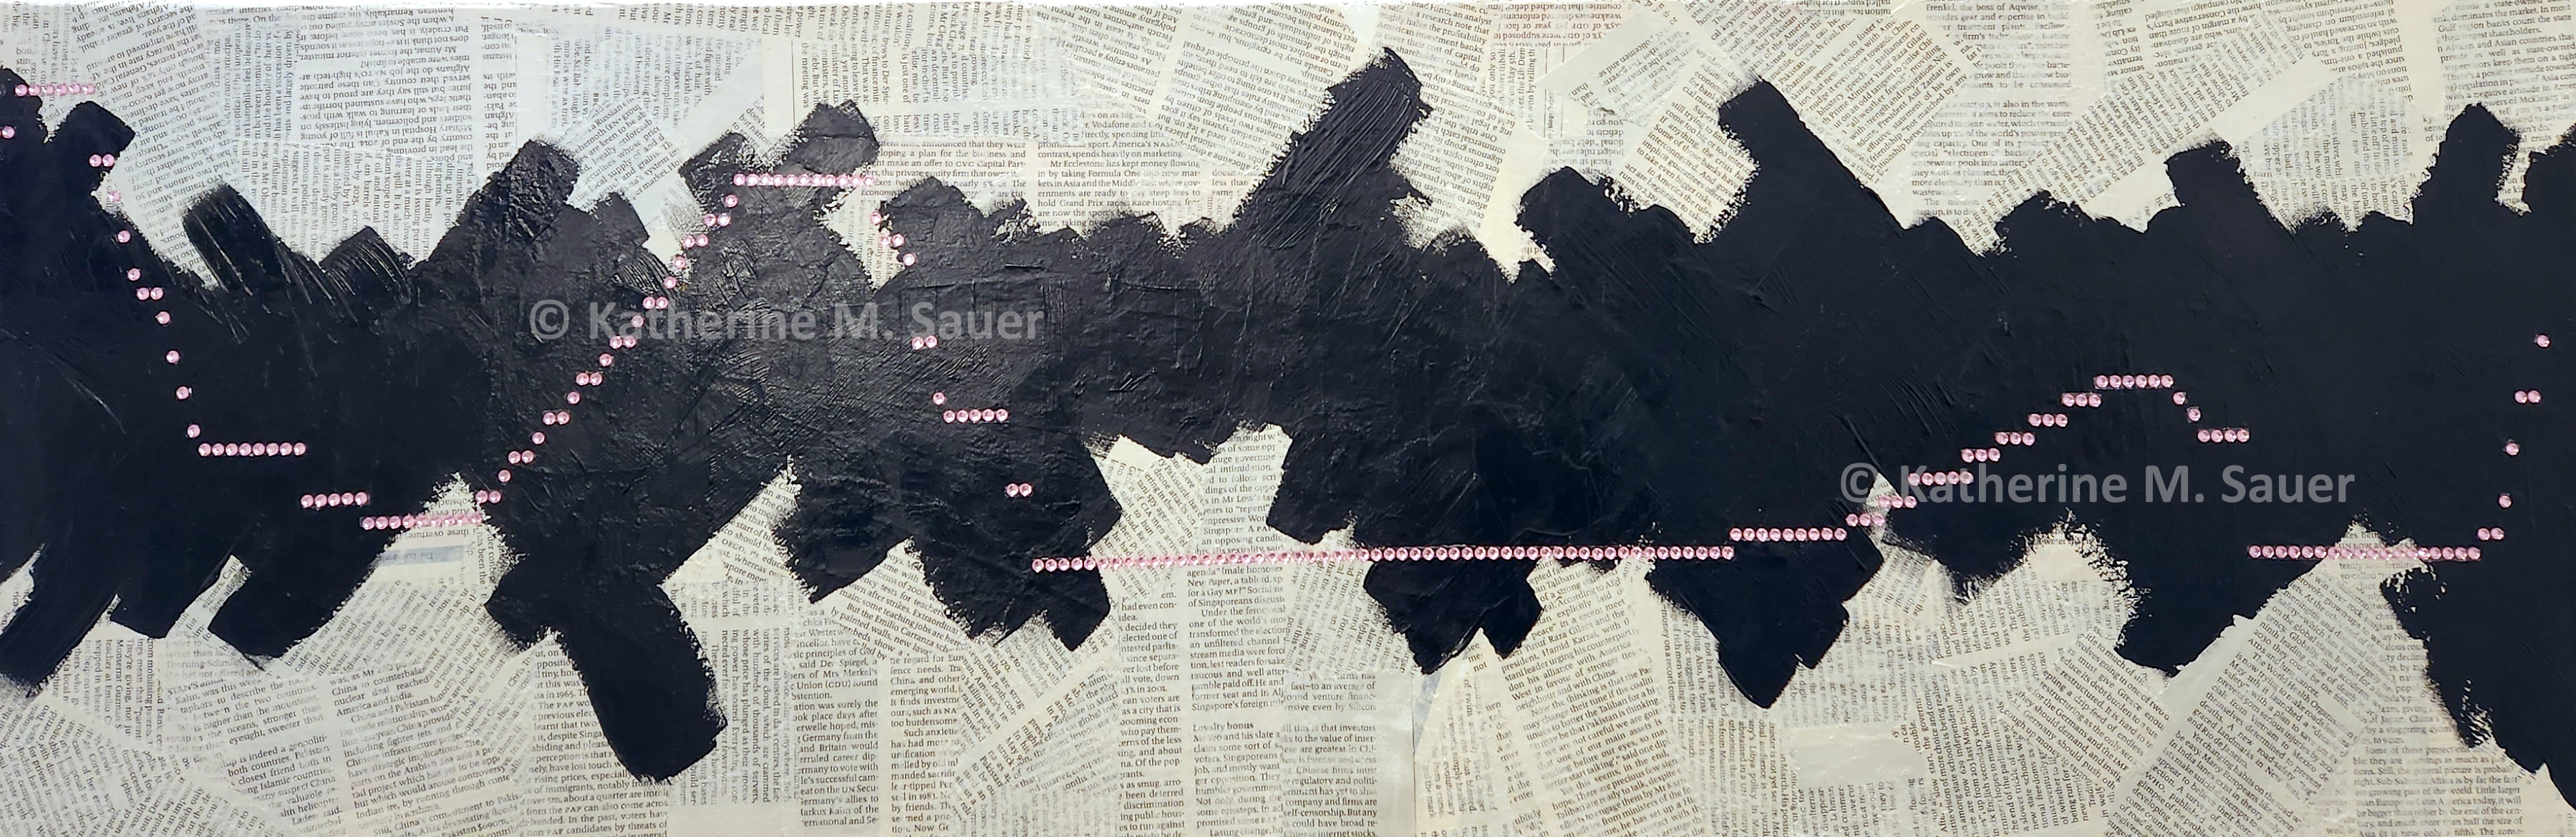
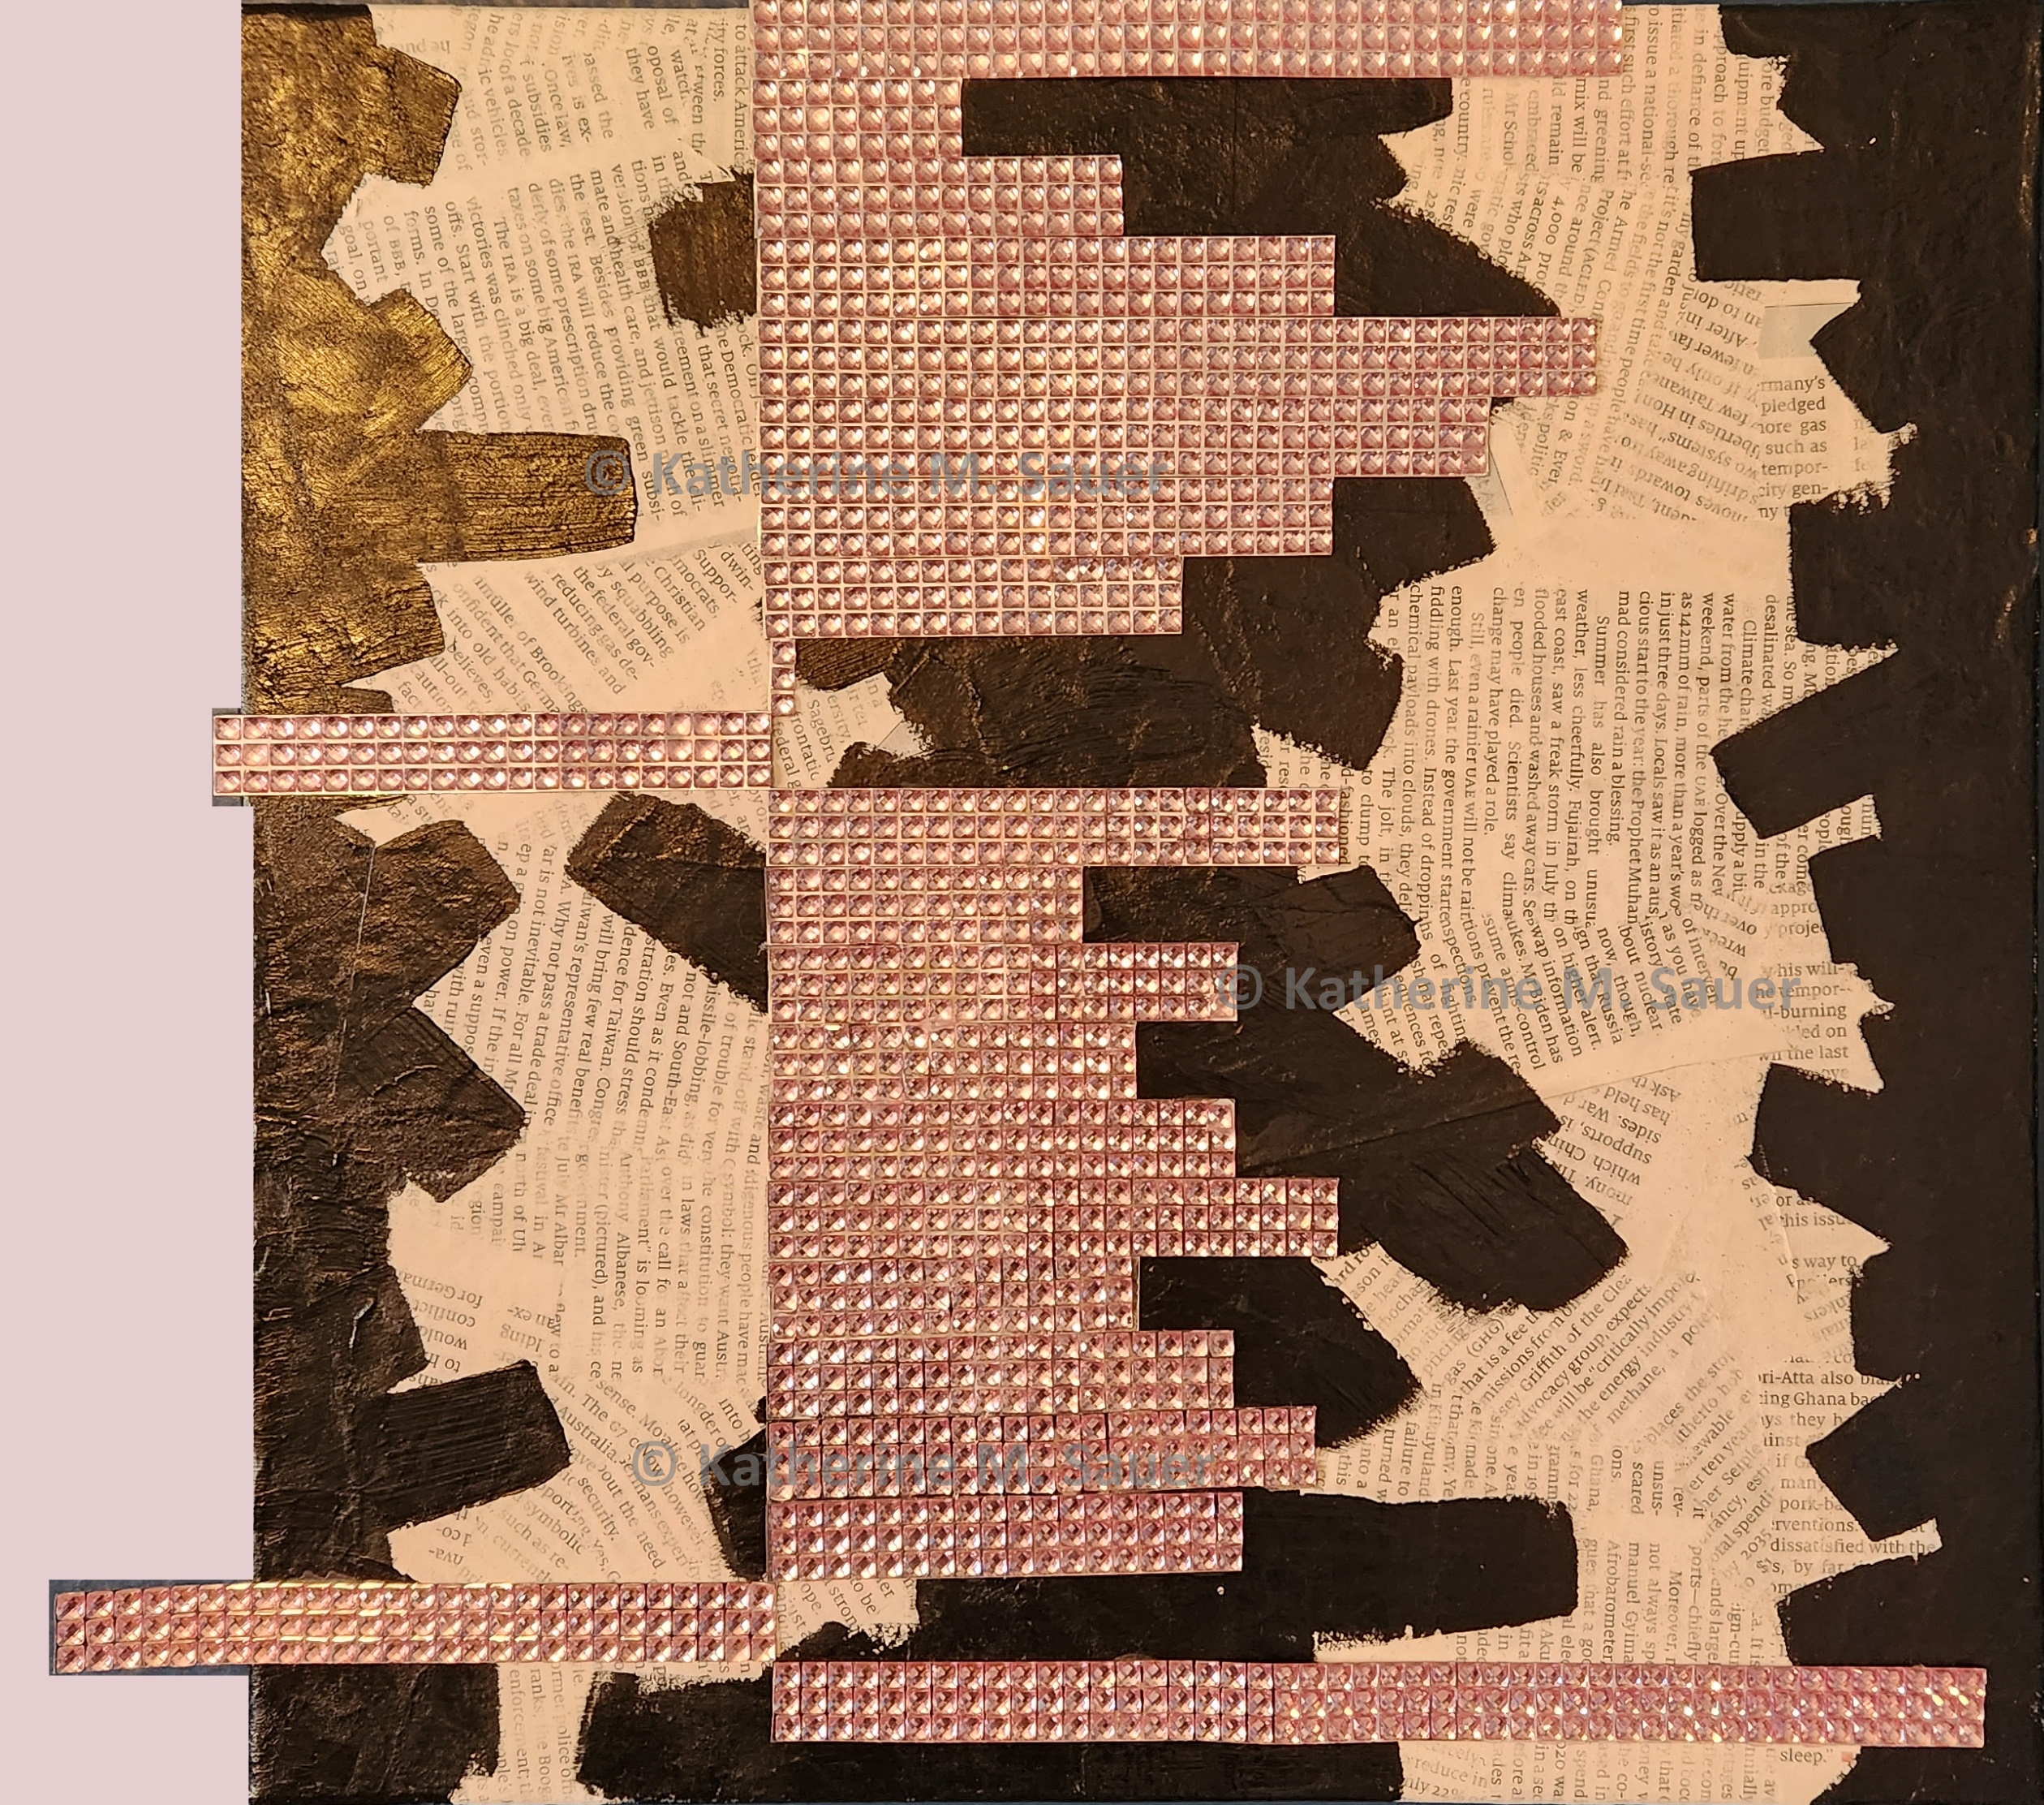
The Big Data pieces reflect the abundance of economic data published daily, and the clandestine-esque embargos on premature release. "Big Data: FFR" shows the federal funds rate target, by month, from 1-1-00 through 9-1-22. "Big Data: Growth" depicts annual Real GDP growth for 2000 through 2021.
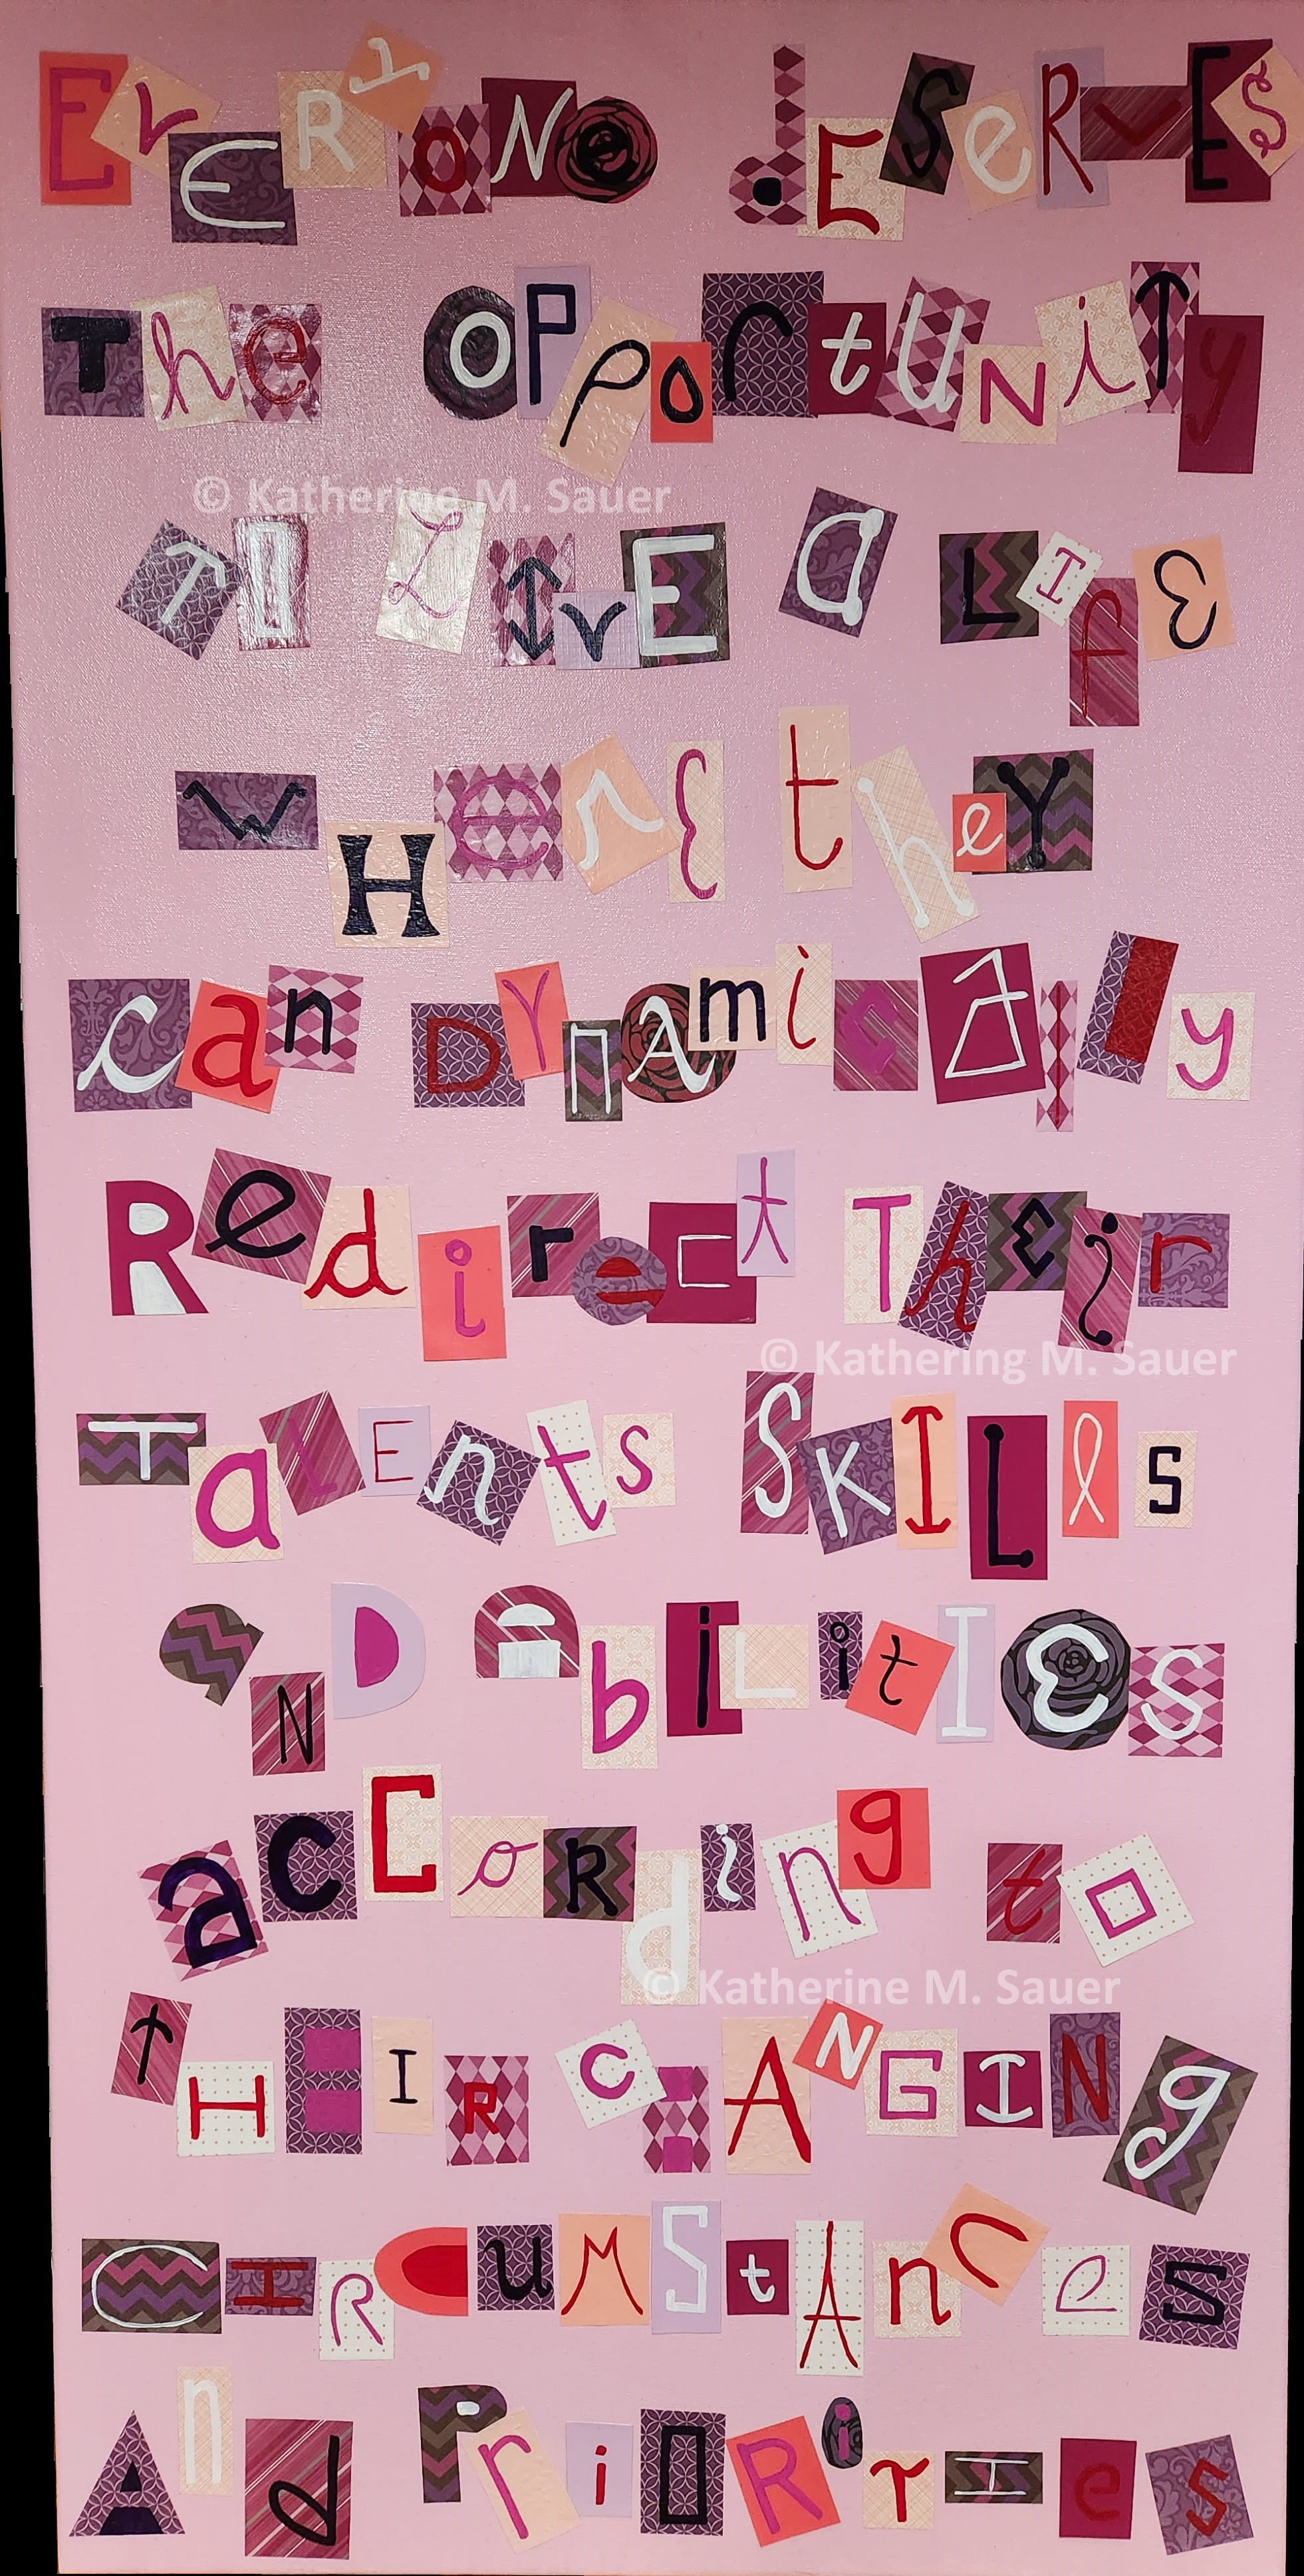
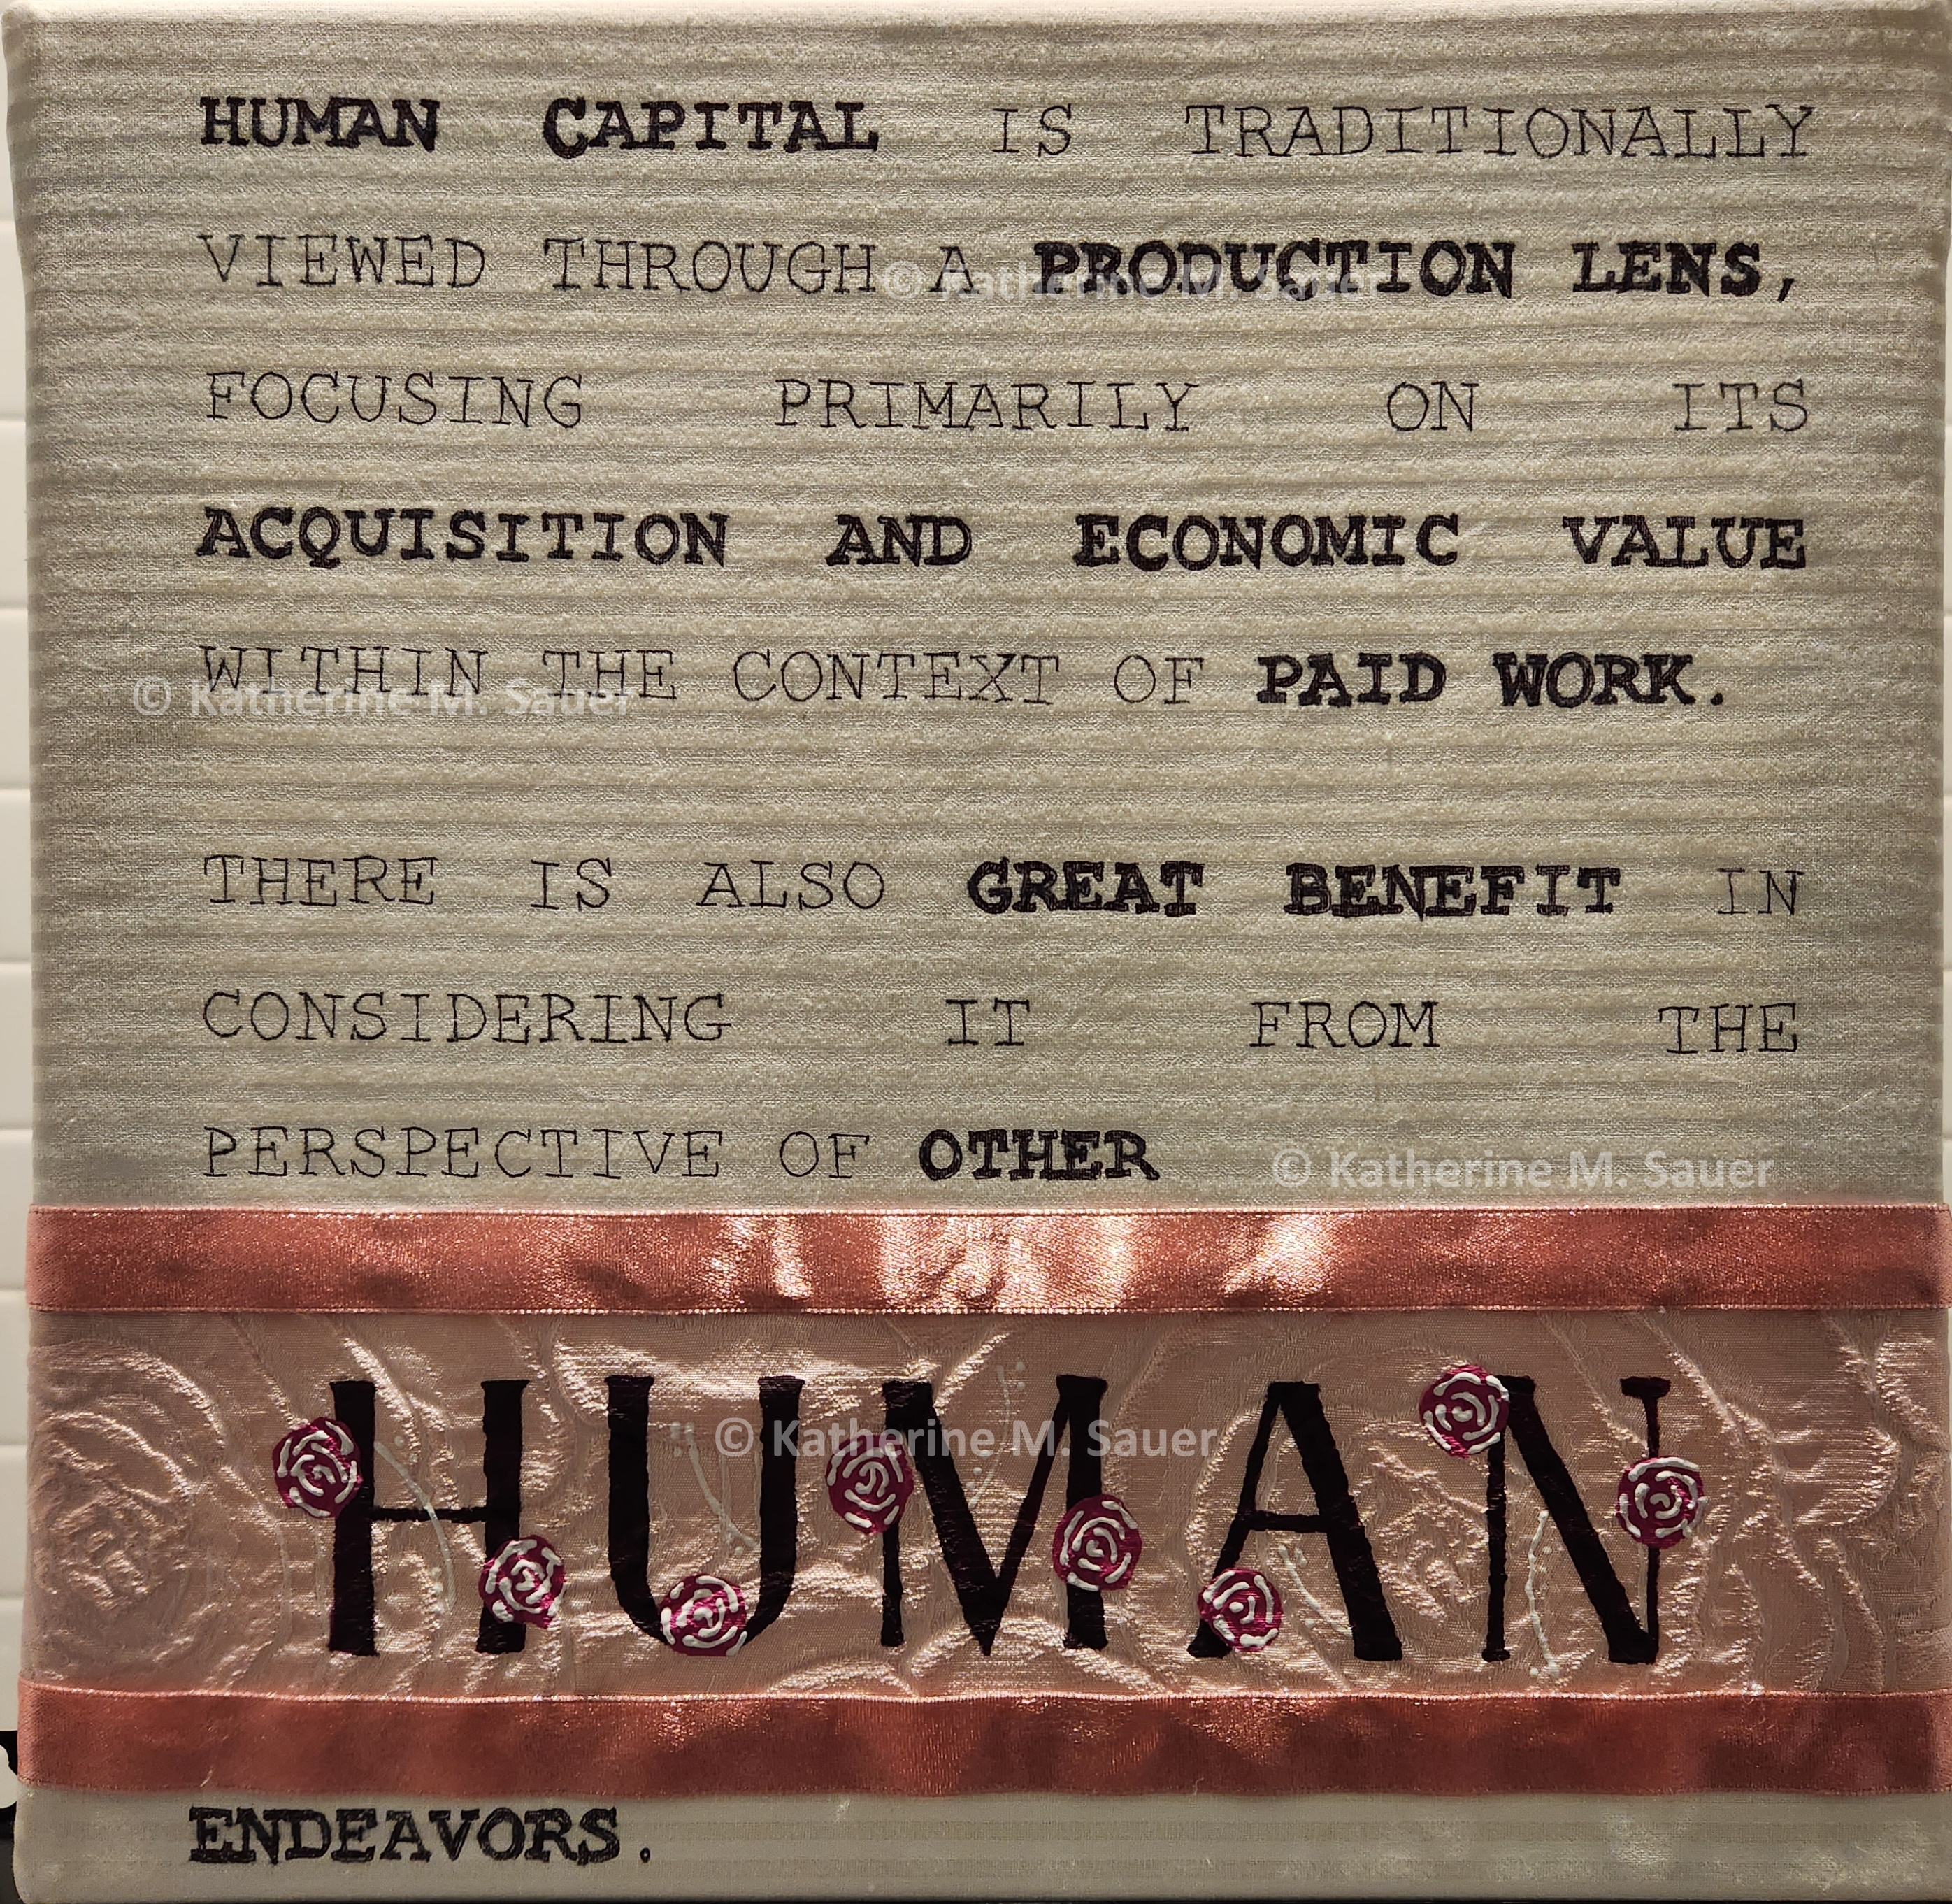
The Unleashing Human Capital pieces depict sentiments about work. "Ransom" highlights the sentiment that many workers feel they are stuck in their jobs but can’t make a change due to necessities like health insurance. Additionally, much important human work is unpaid (e.g., caregiving, emotional labor, volunteering) and falls to women to do."Human" offers an expansive take on the concept of human capital. Imperfect lettering in courier new font style over fabric reminiscent of tractor feed paper contrasts with feminine and handicraft style emphasis of the word “human”.
Big Data: FFR | 36" x 12" | paper mache, acrylic, and novelty jewels on canvas
Big Data: Growth | 12" x 12" | paper mache, acrylic, and novelty jewels on canvas
Ransom | 24" x 48" | acrylic and paper on canvas
Human | 12" x 12" | fabric, ribbon, acrylic, and ink on canvas
This series artistically explores common graphs from basic economics.
Monopolist | 12" x 12" | acrylic on canvas | 2012 | A single producer enjoys the price markup over the intersection of marginal revenue and marginal cost.
Sales Tax | 12" x 12" | acrylic on canvas | 2012 | A sales tax raises the price for consumers, lowers the take-home price for sellers, and causes deadweight loss.
Profits | 12" x 12" | acrylic on canvas | 2012 | A firm earning short run profits as shown by the area between the price and production cost.
Tariff | 12" x 12" | acrylic on canvas | 2012 | Tariffs raise the domestic price above the prevailing price in the world market. They benefit or harm different parties unequally and cause overall deadweight loss.
Perfect Competition | 16" x 20" | acrylic on canvas board | 2011 | A firm in a perfectly competitive market earning a loss.
LRAC | 36" x 12" | acrylic on canvas board | 2011 | A long run average cost curve for a firm.
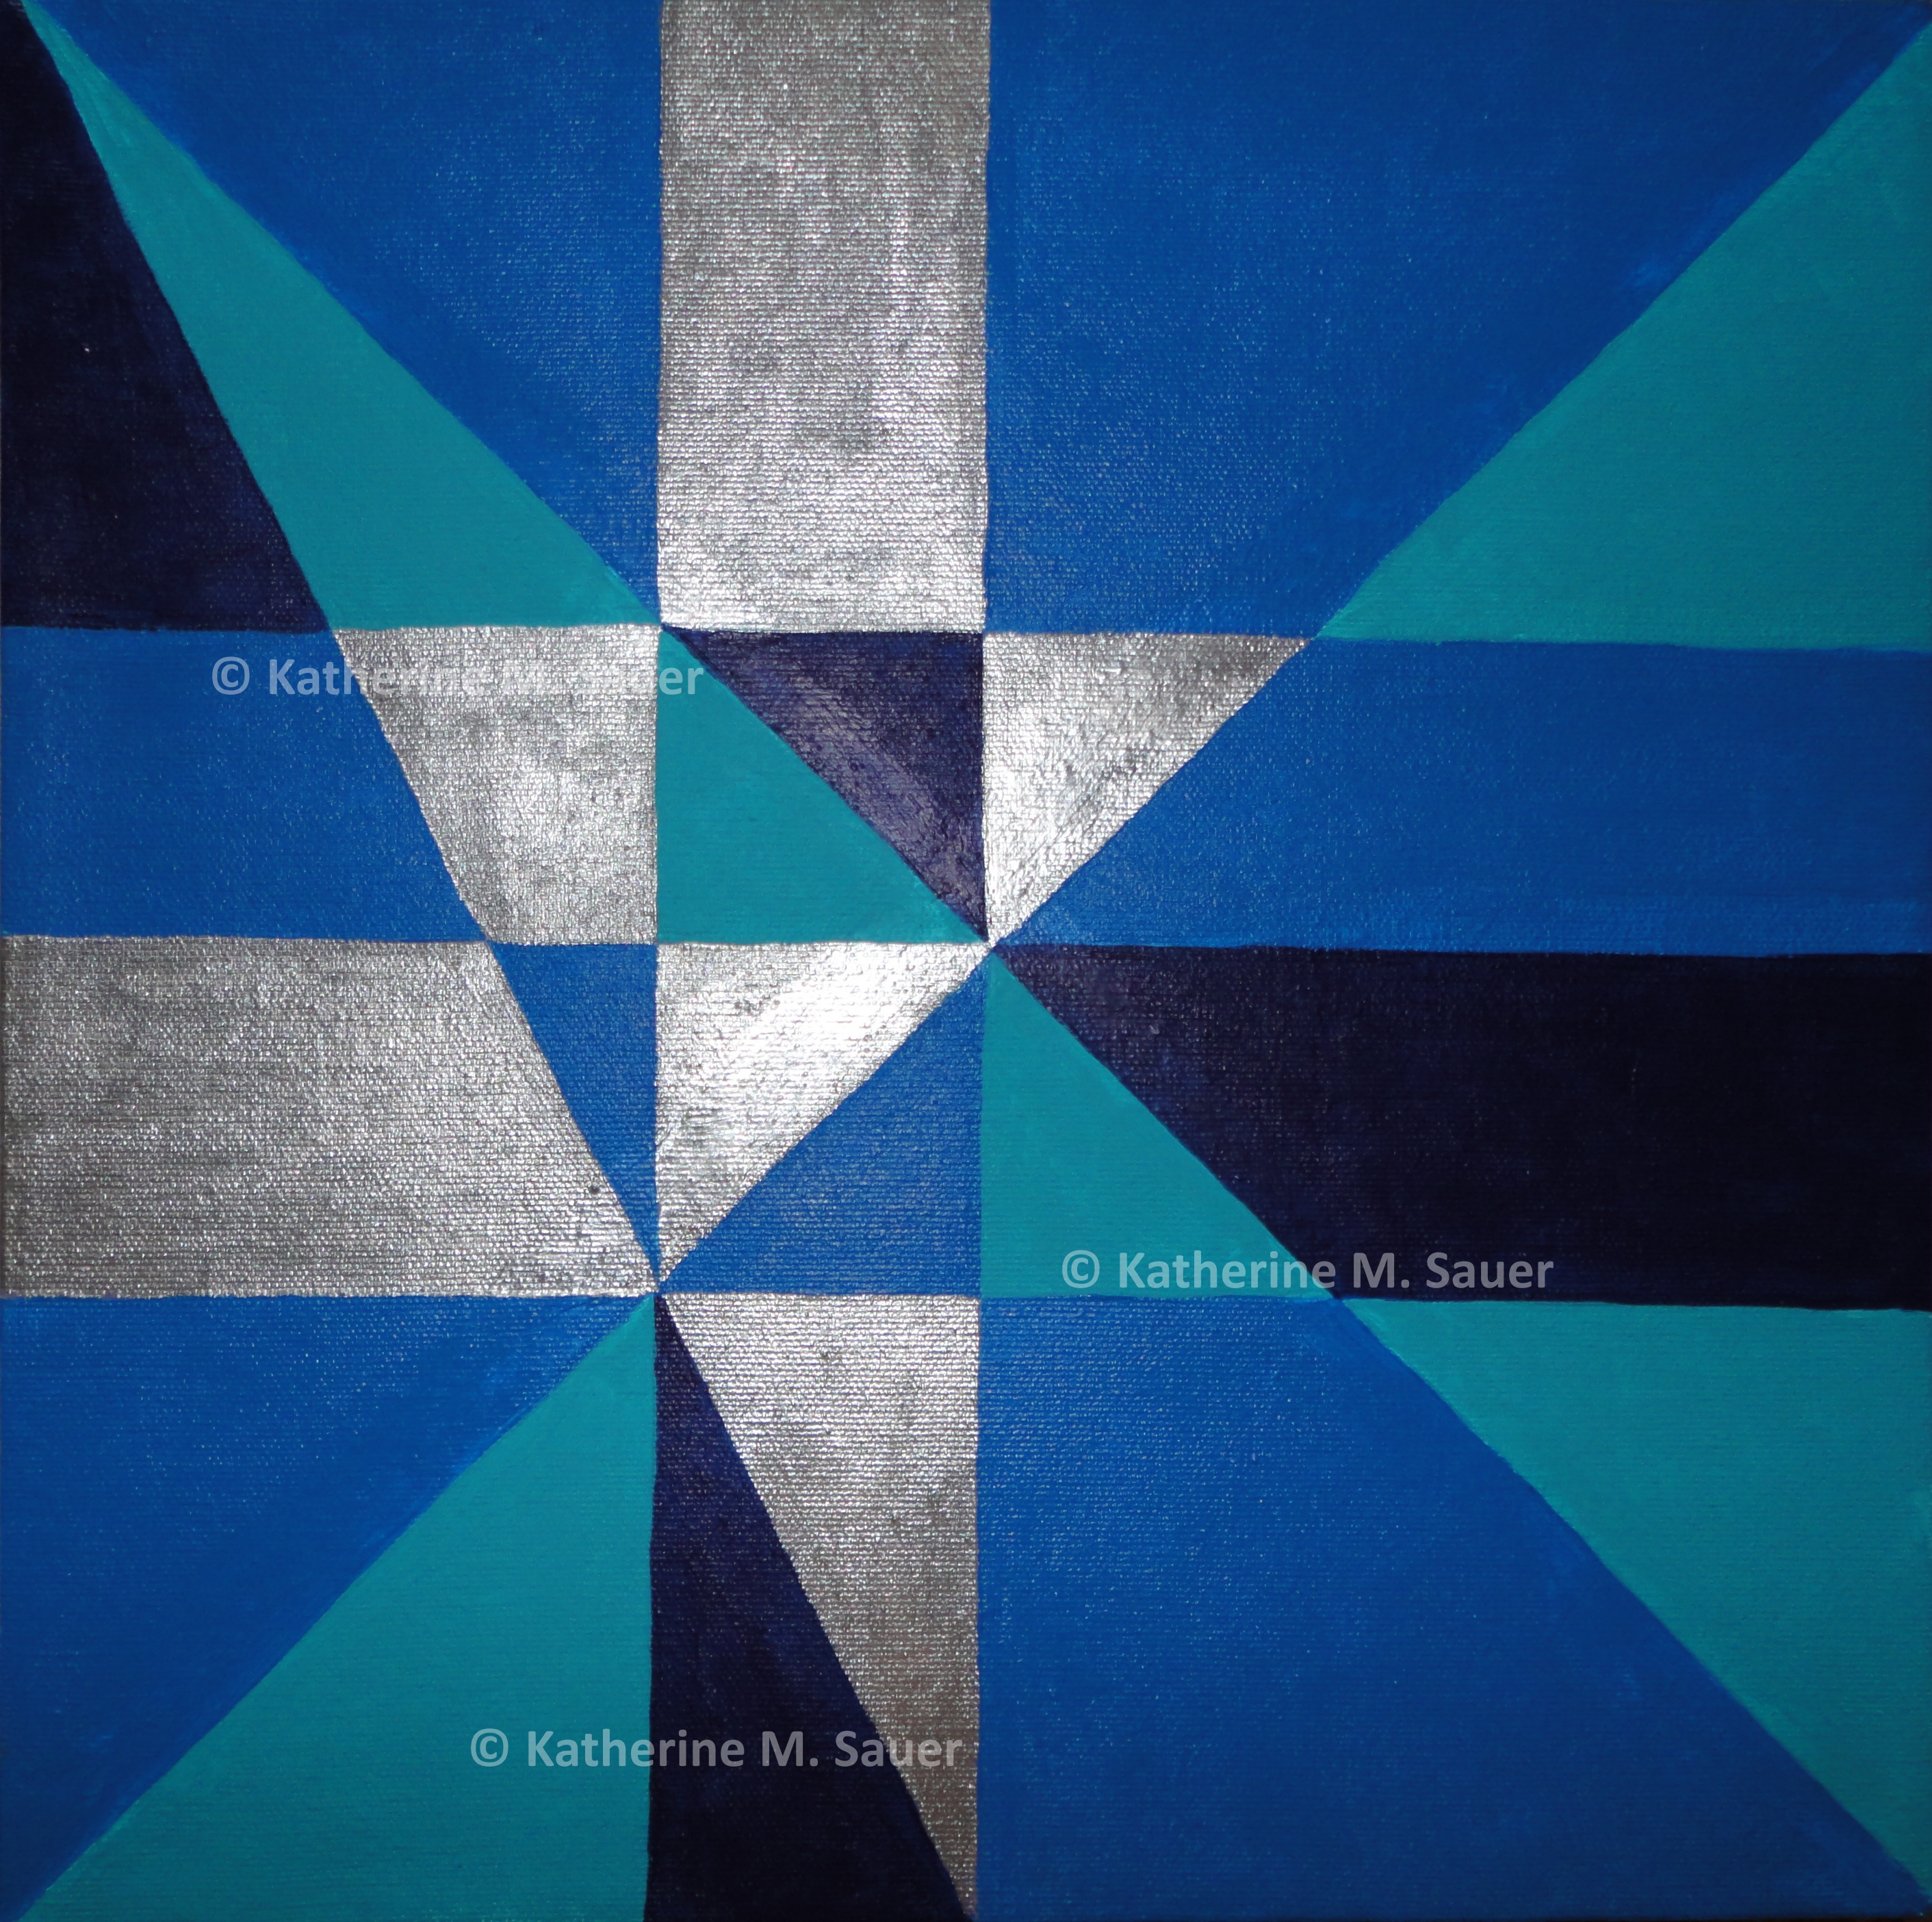
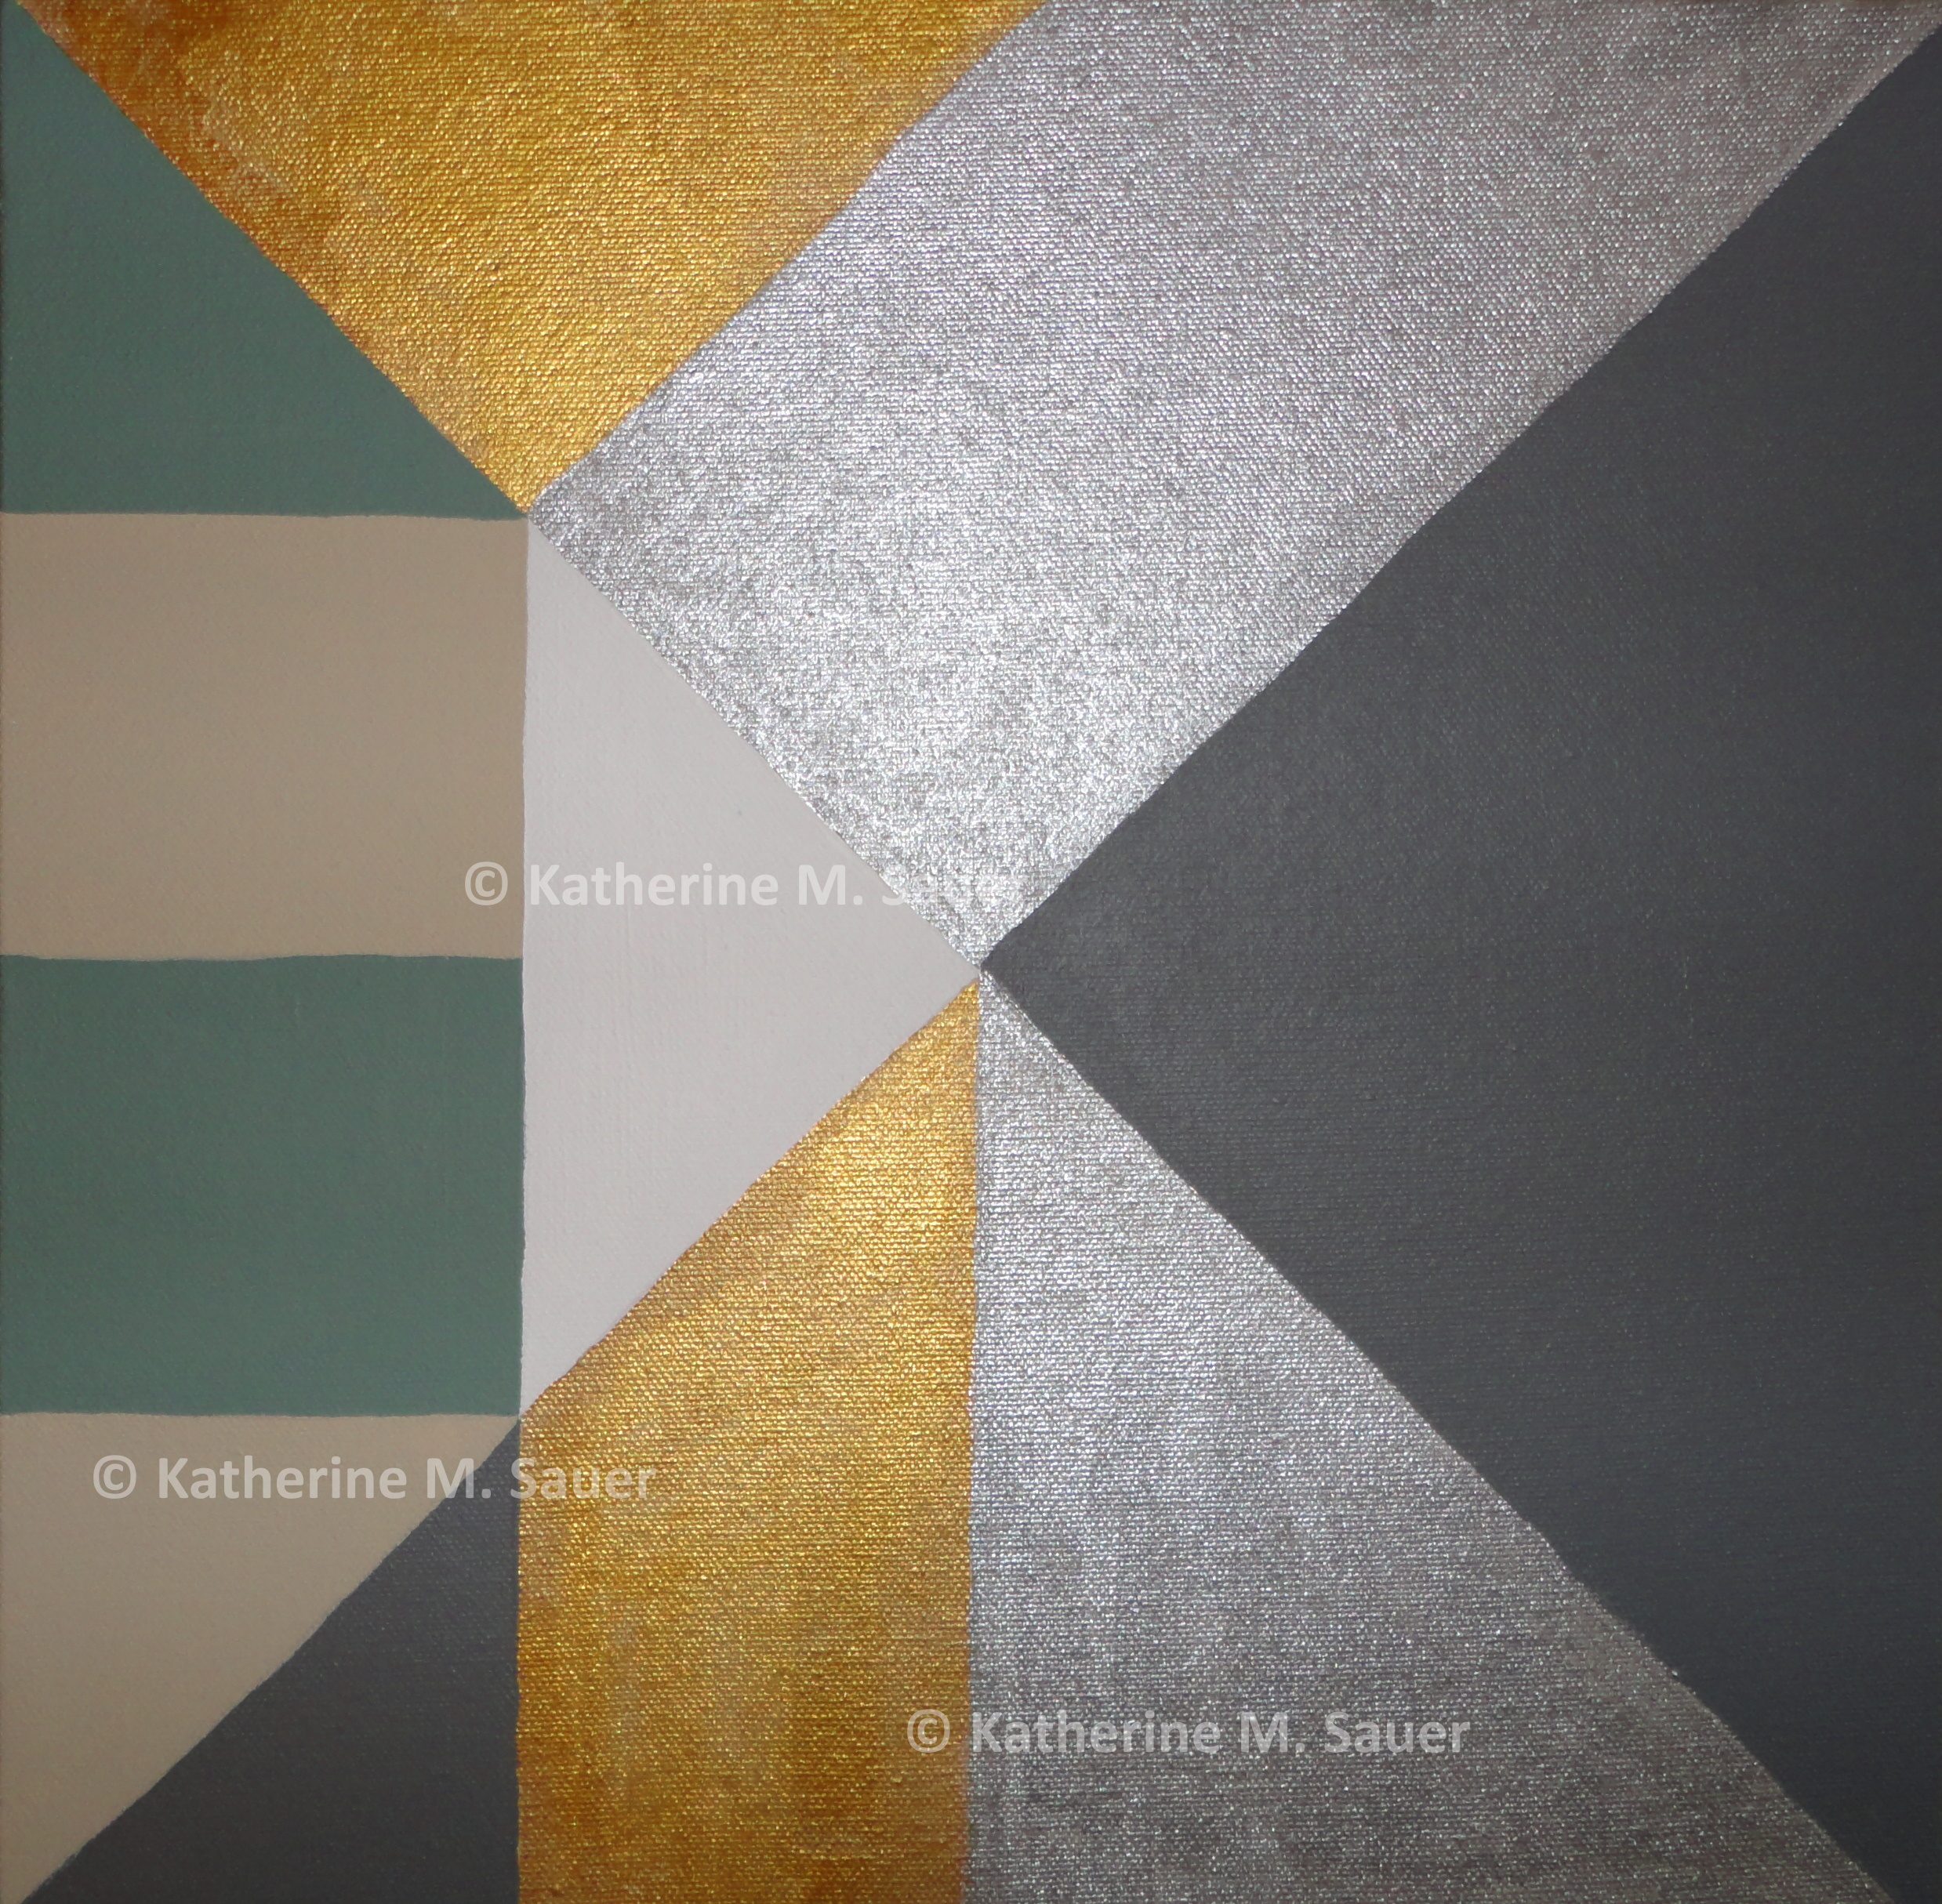
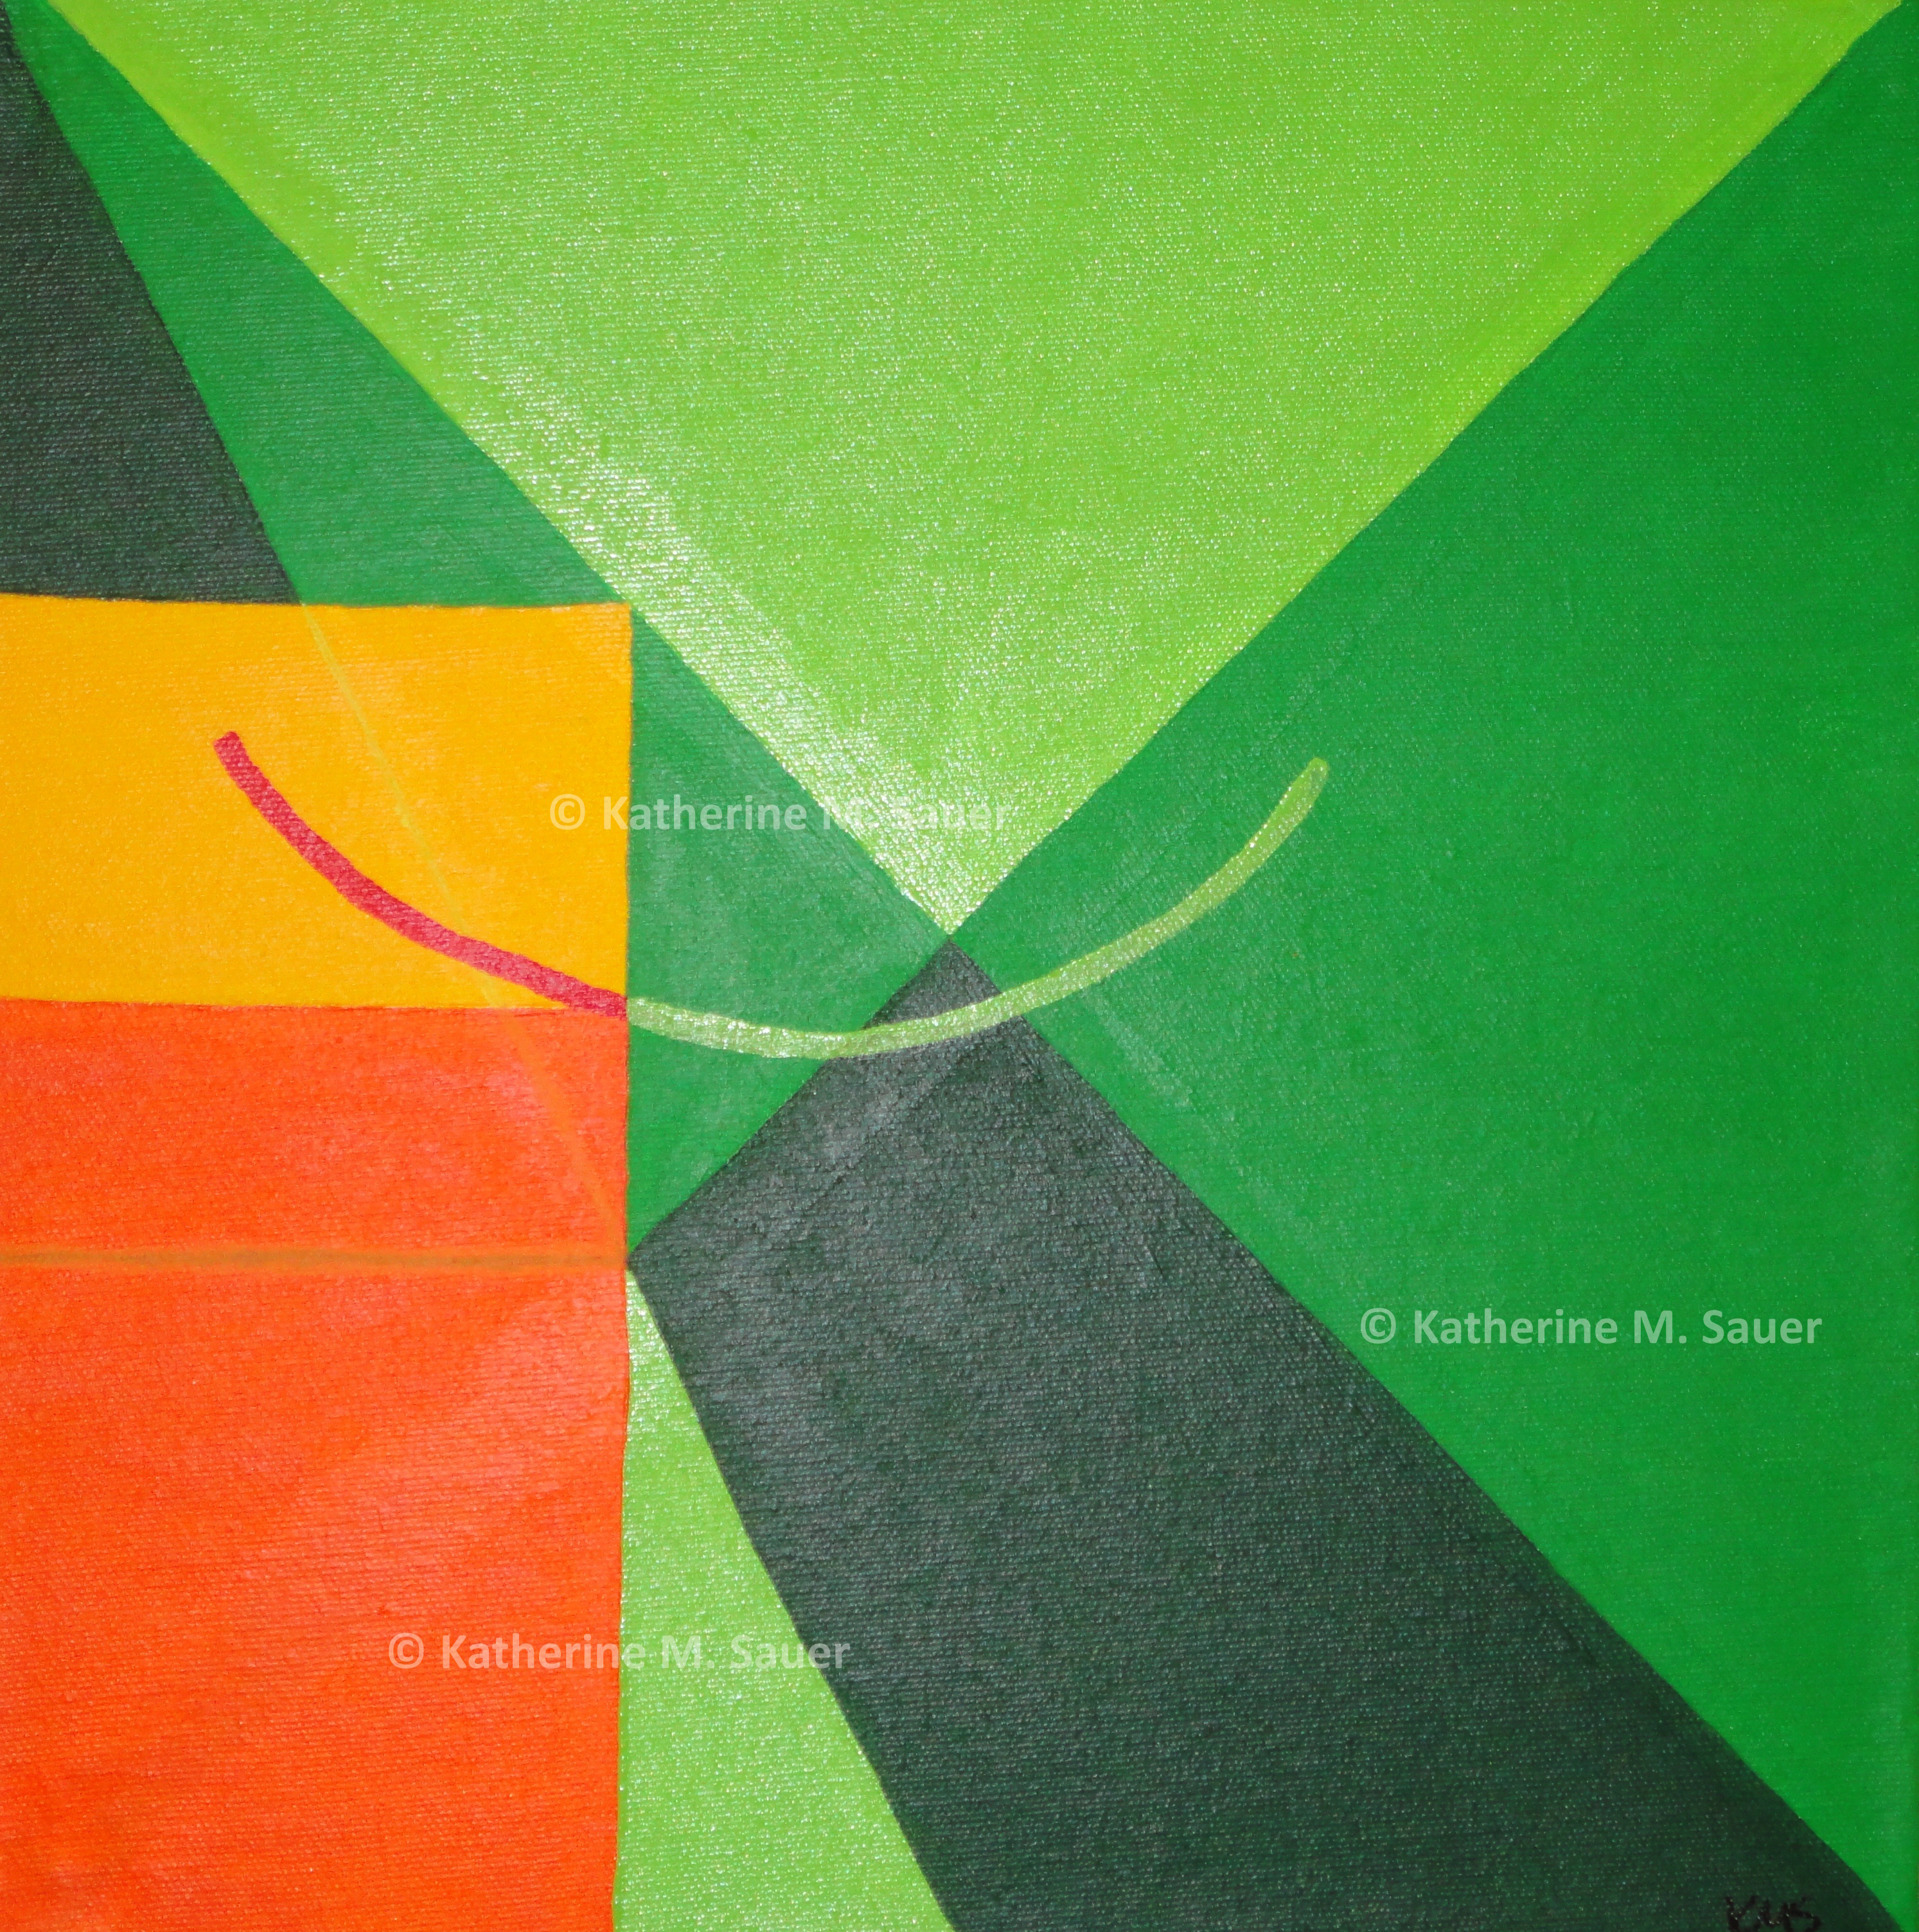
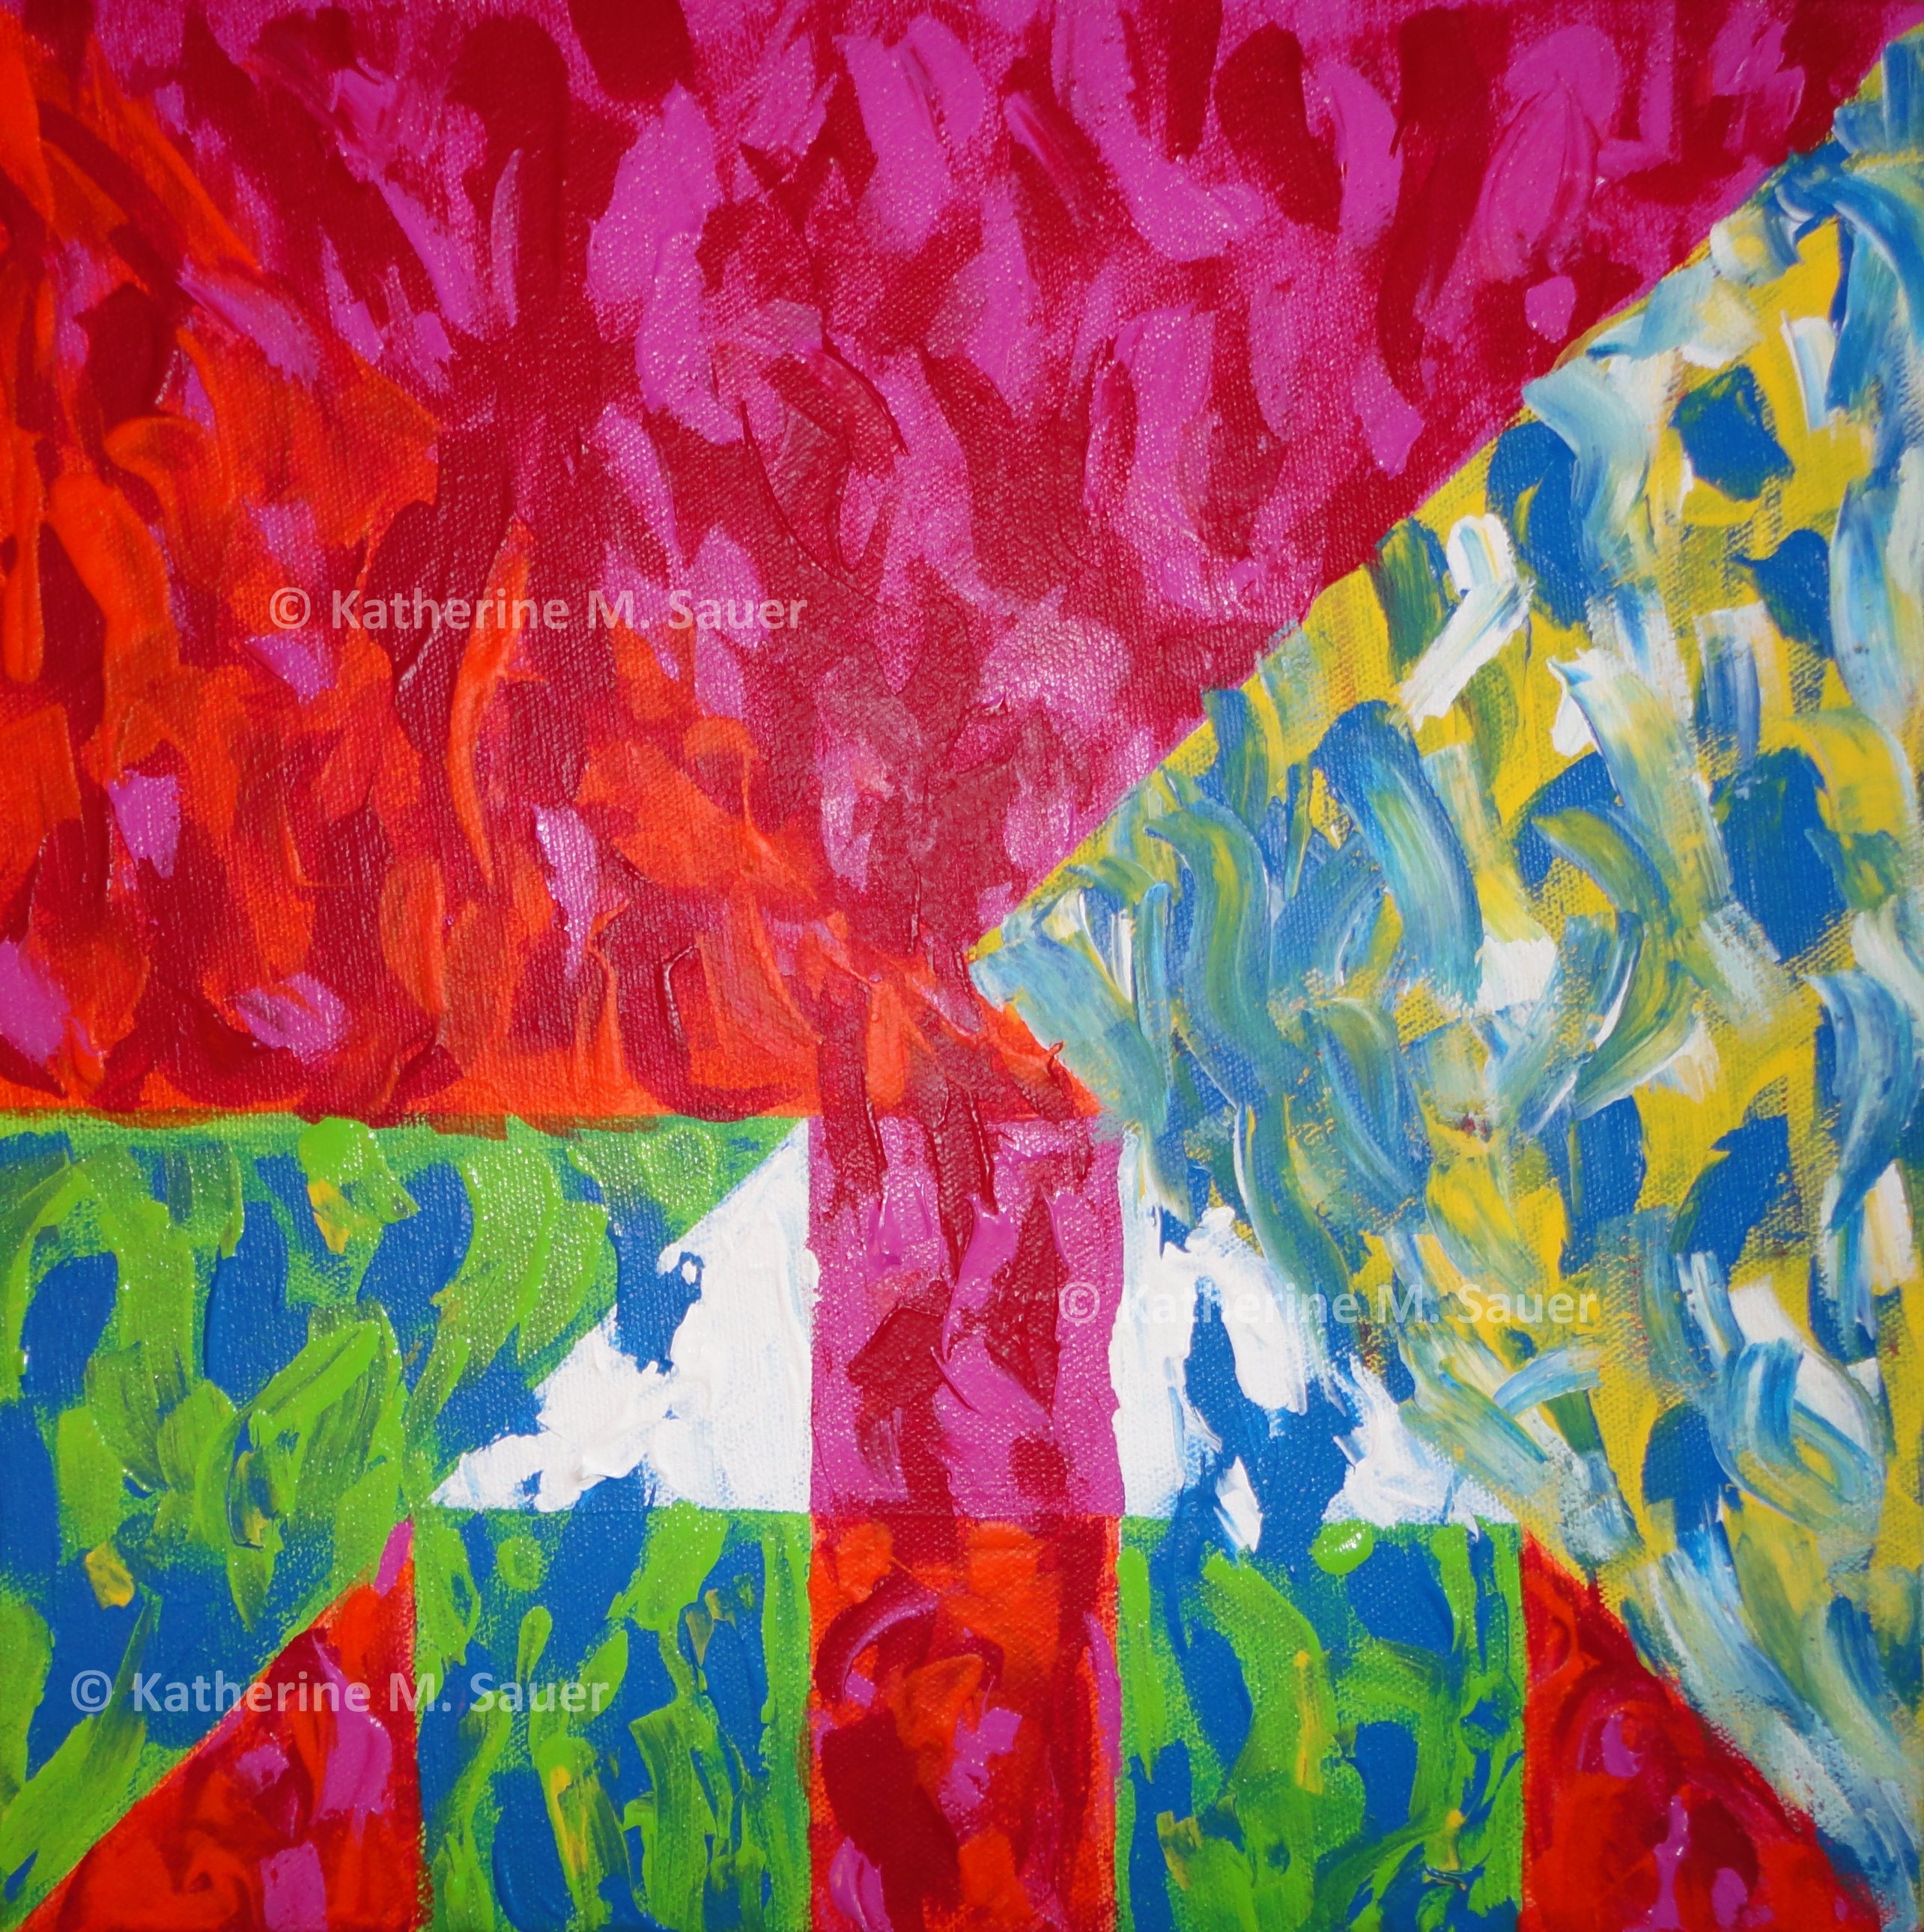
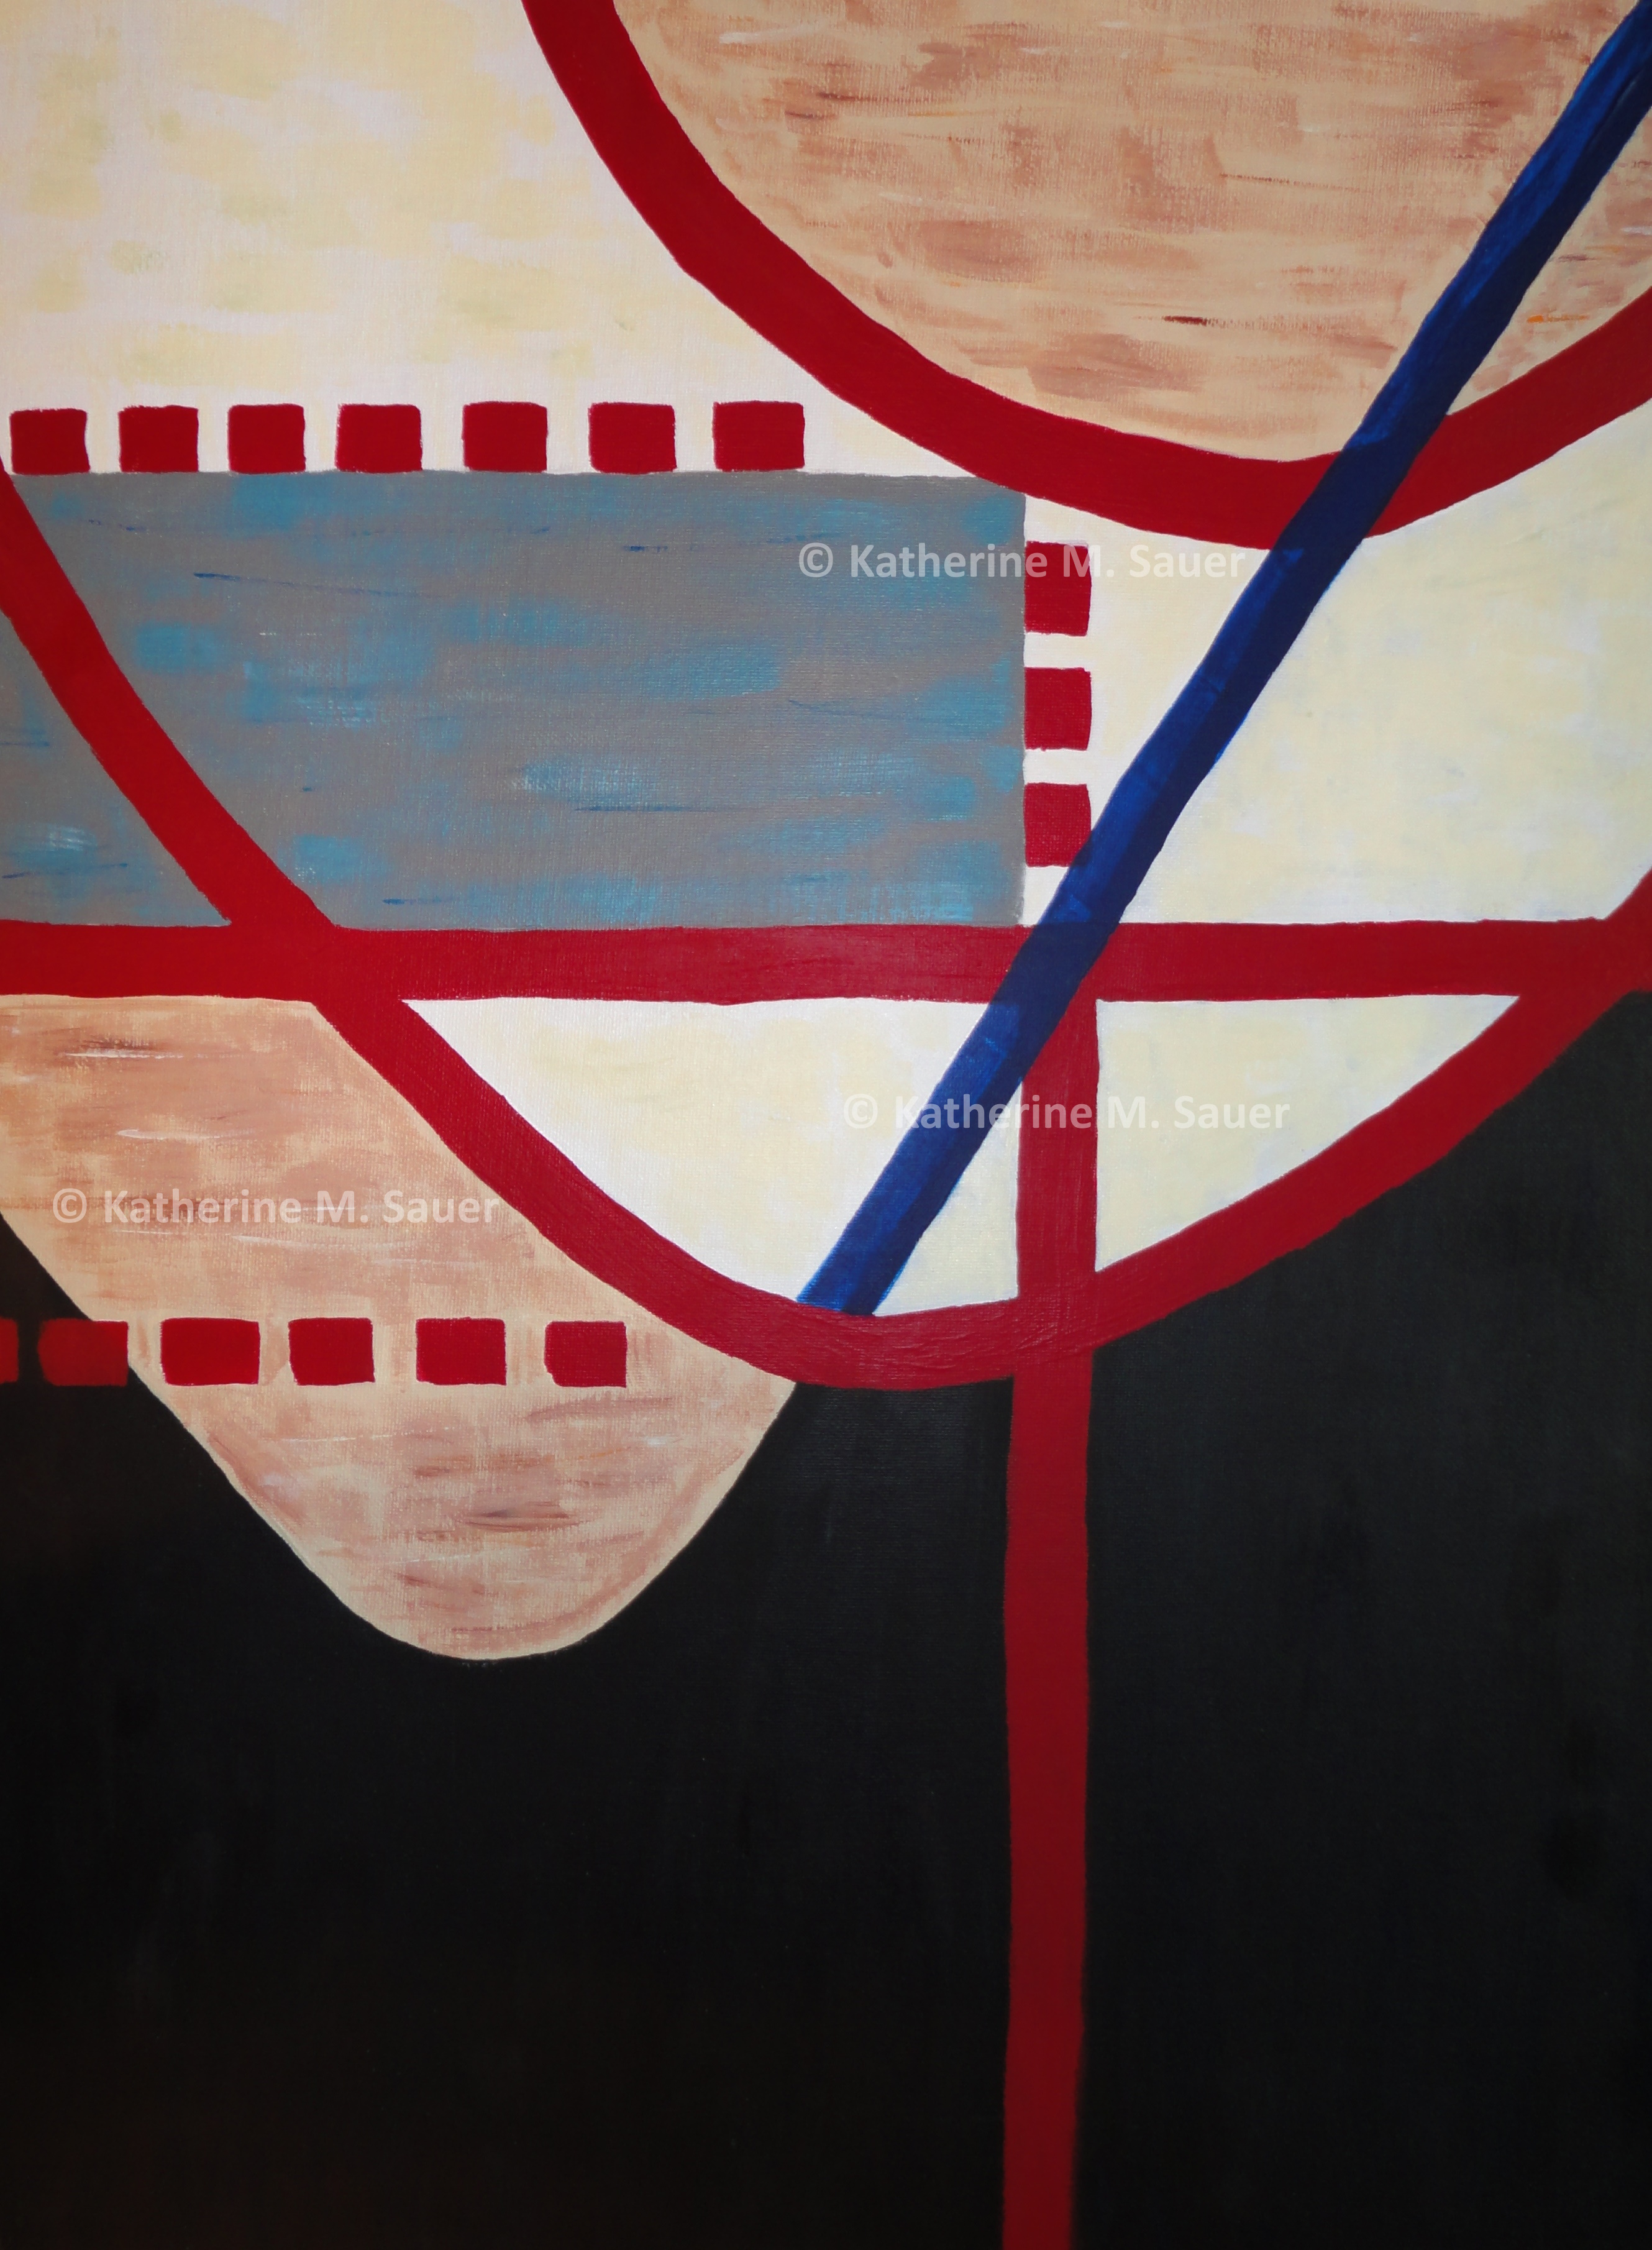

This series artistically explores common graphs from intermediate economics.
Edgeworth Box | 20" x 16" | acrylic on canvas | 2013 | An Edgeworth box is used to analyze potential trades between two people. The contract curve and indifference curves are visible.
Insurance | 16" x 12" | acrylic on canvas | 2014 | The marginal gains from insurance depend on the horizontal difference between expected utility and the utility under certainty.
Indifferent | 16" x 12" | acrylic on canvas | 2014 | An optimal consumer bundle.
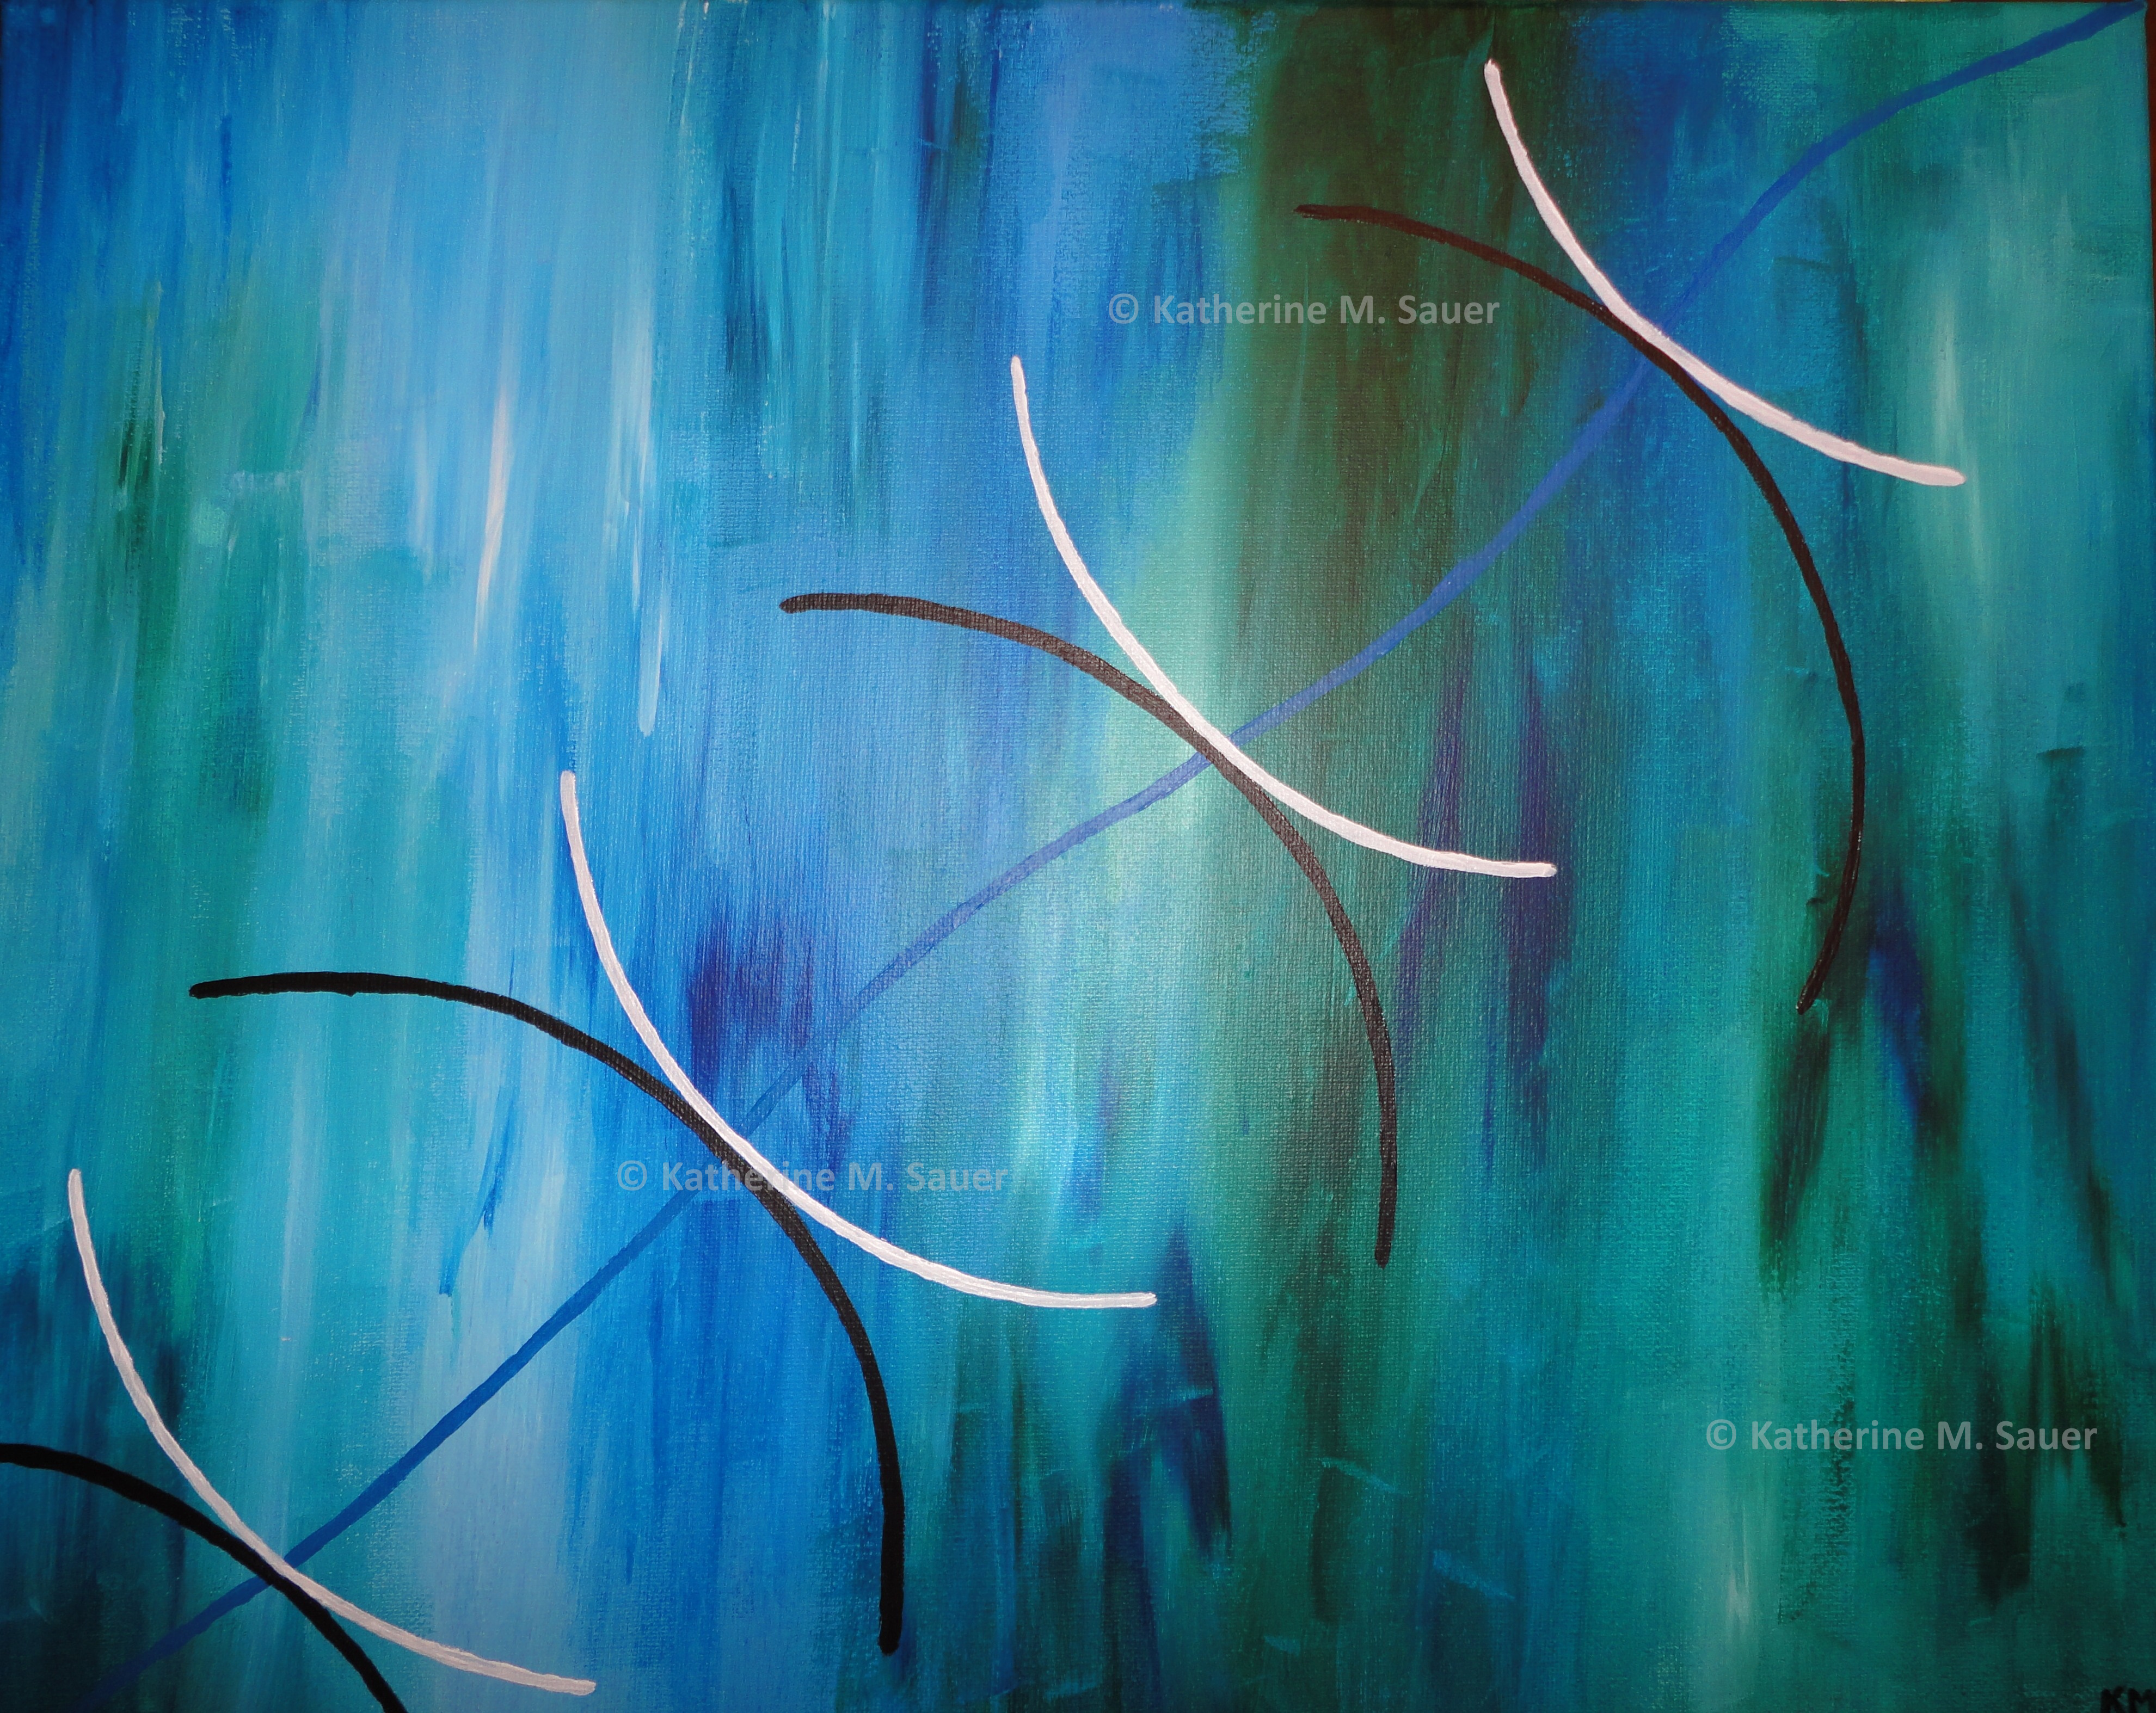
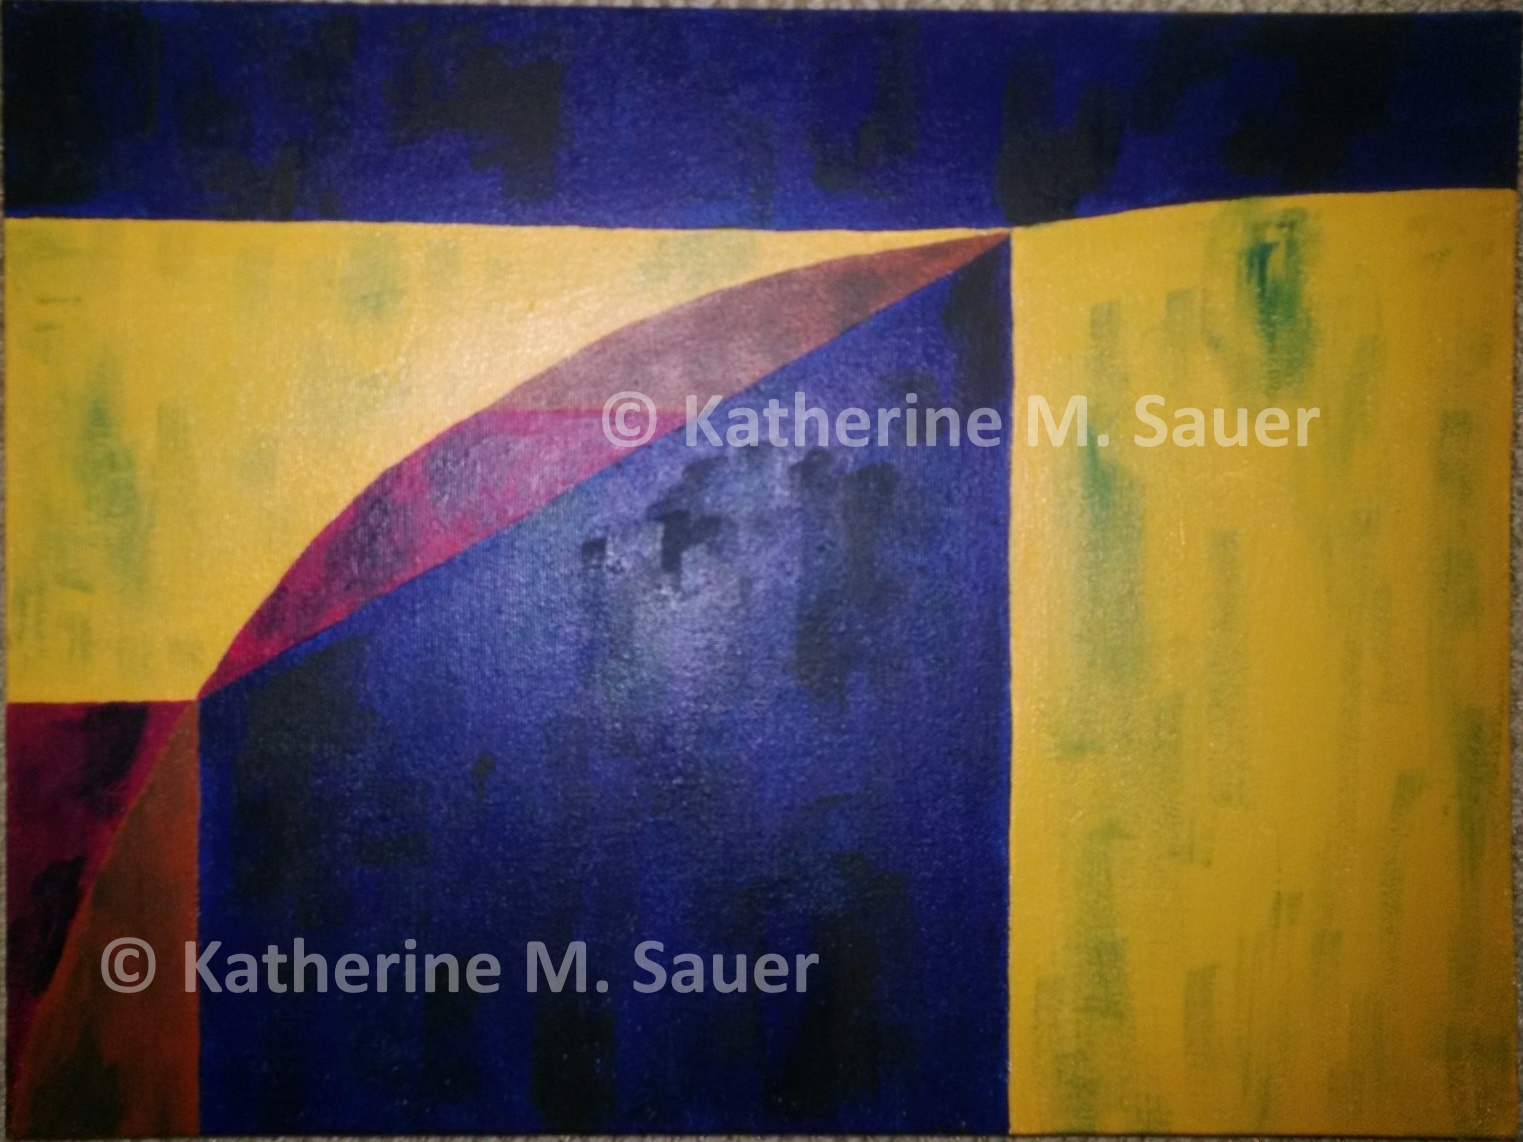
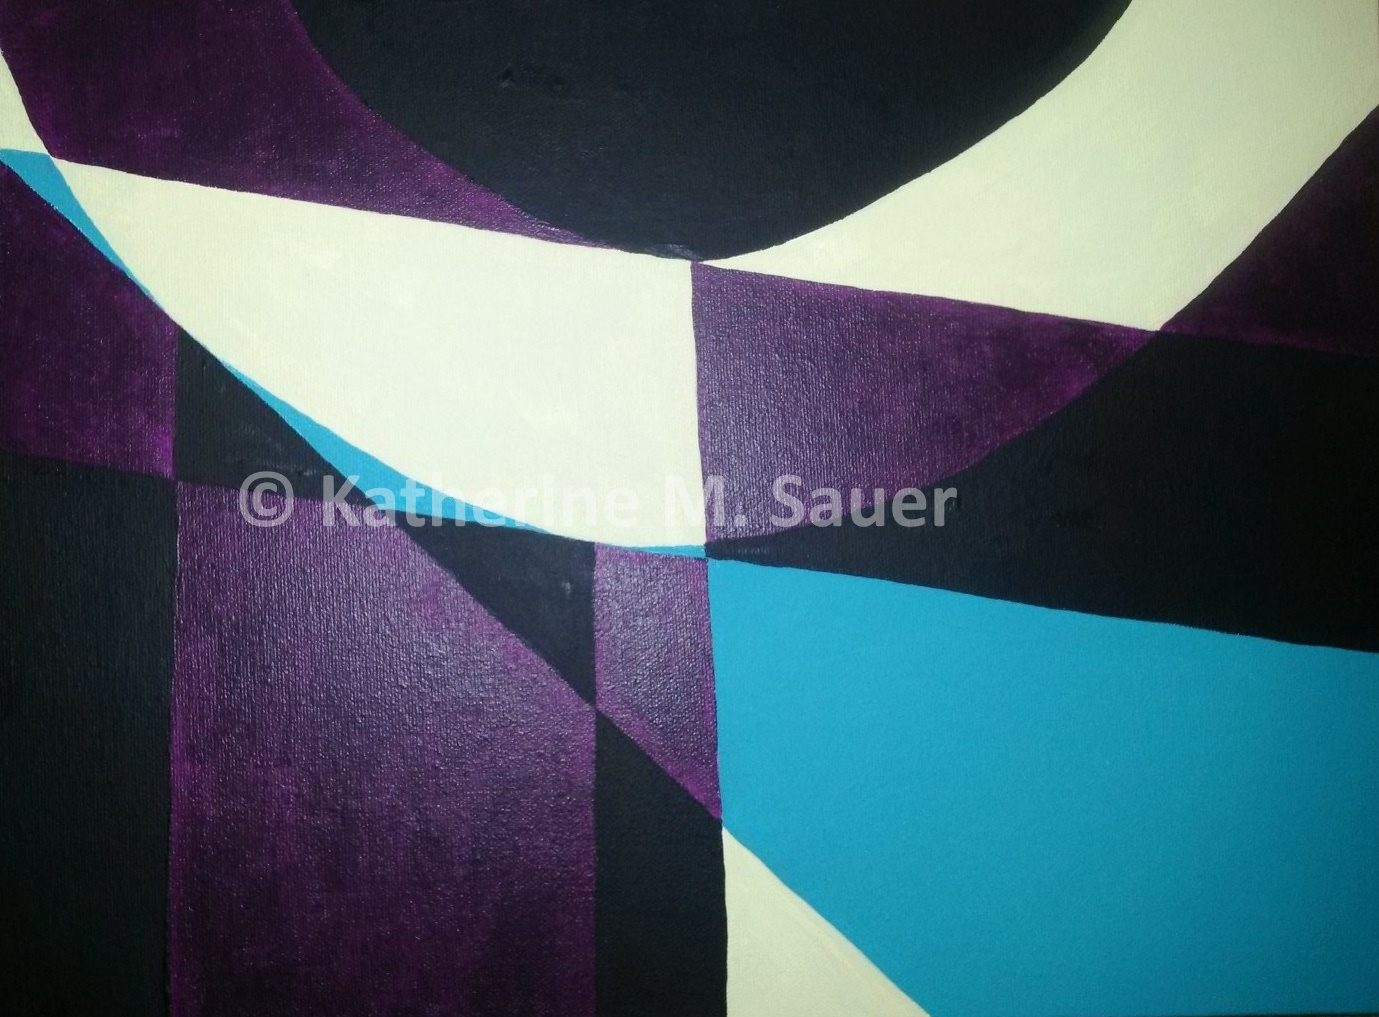
Adam Smith | 8.5" x 11" | oil pastel on paper
David Ricardo | 8.5" x 11" | oil pastel on paper


>36" x 24" | paper, acrylic, and glass on canvas
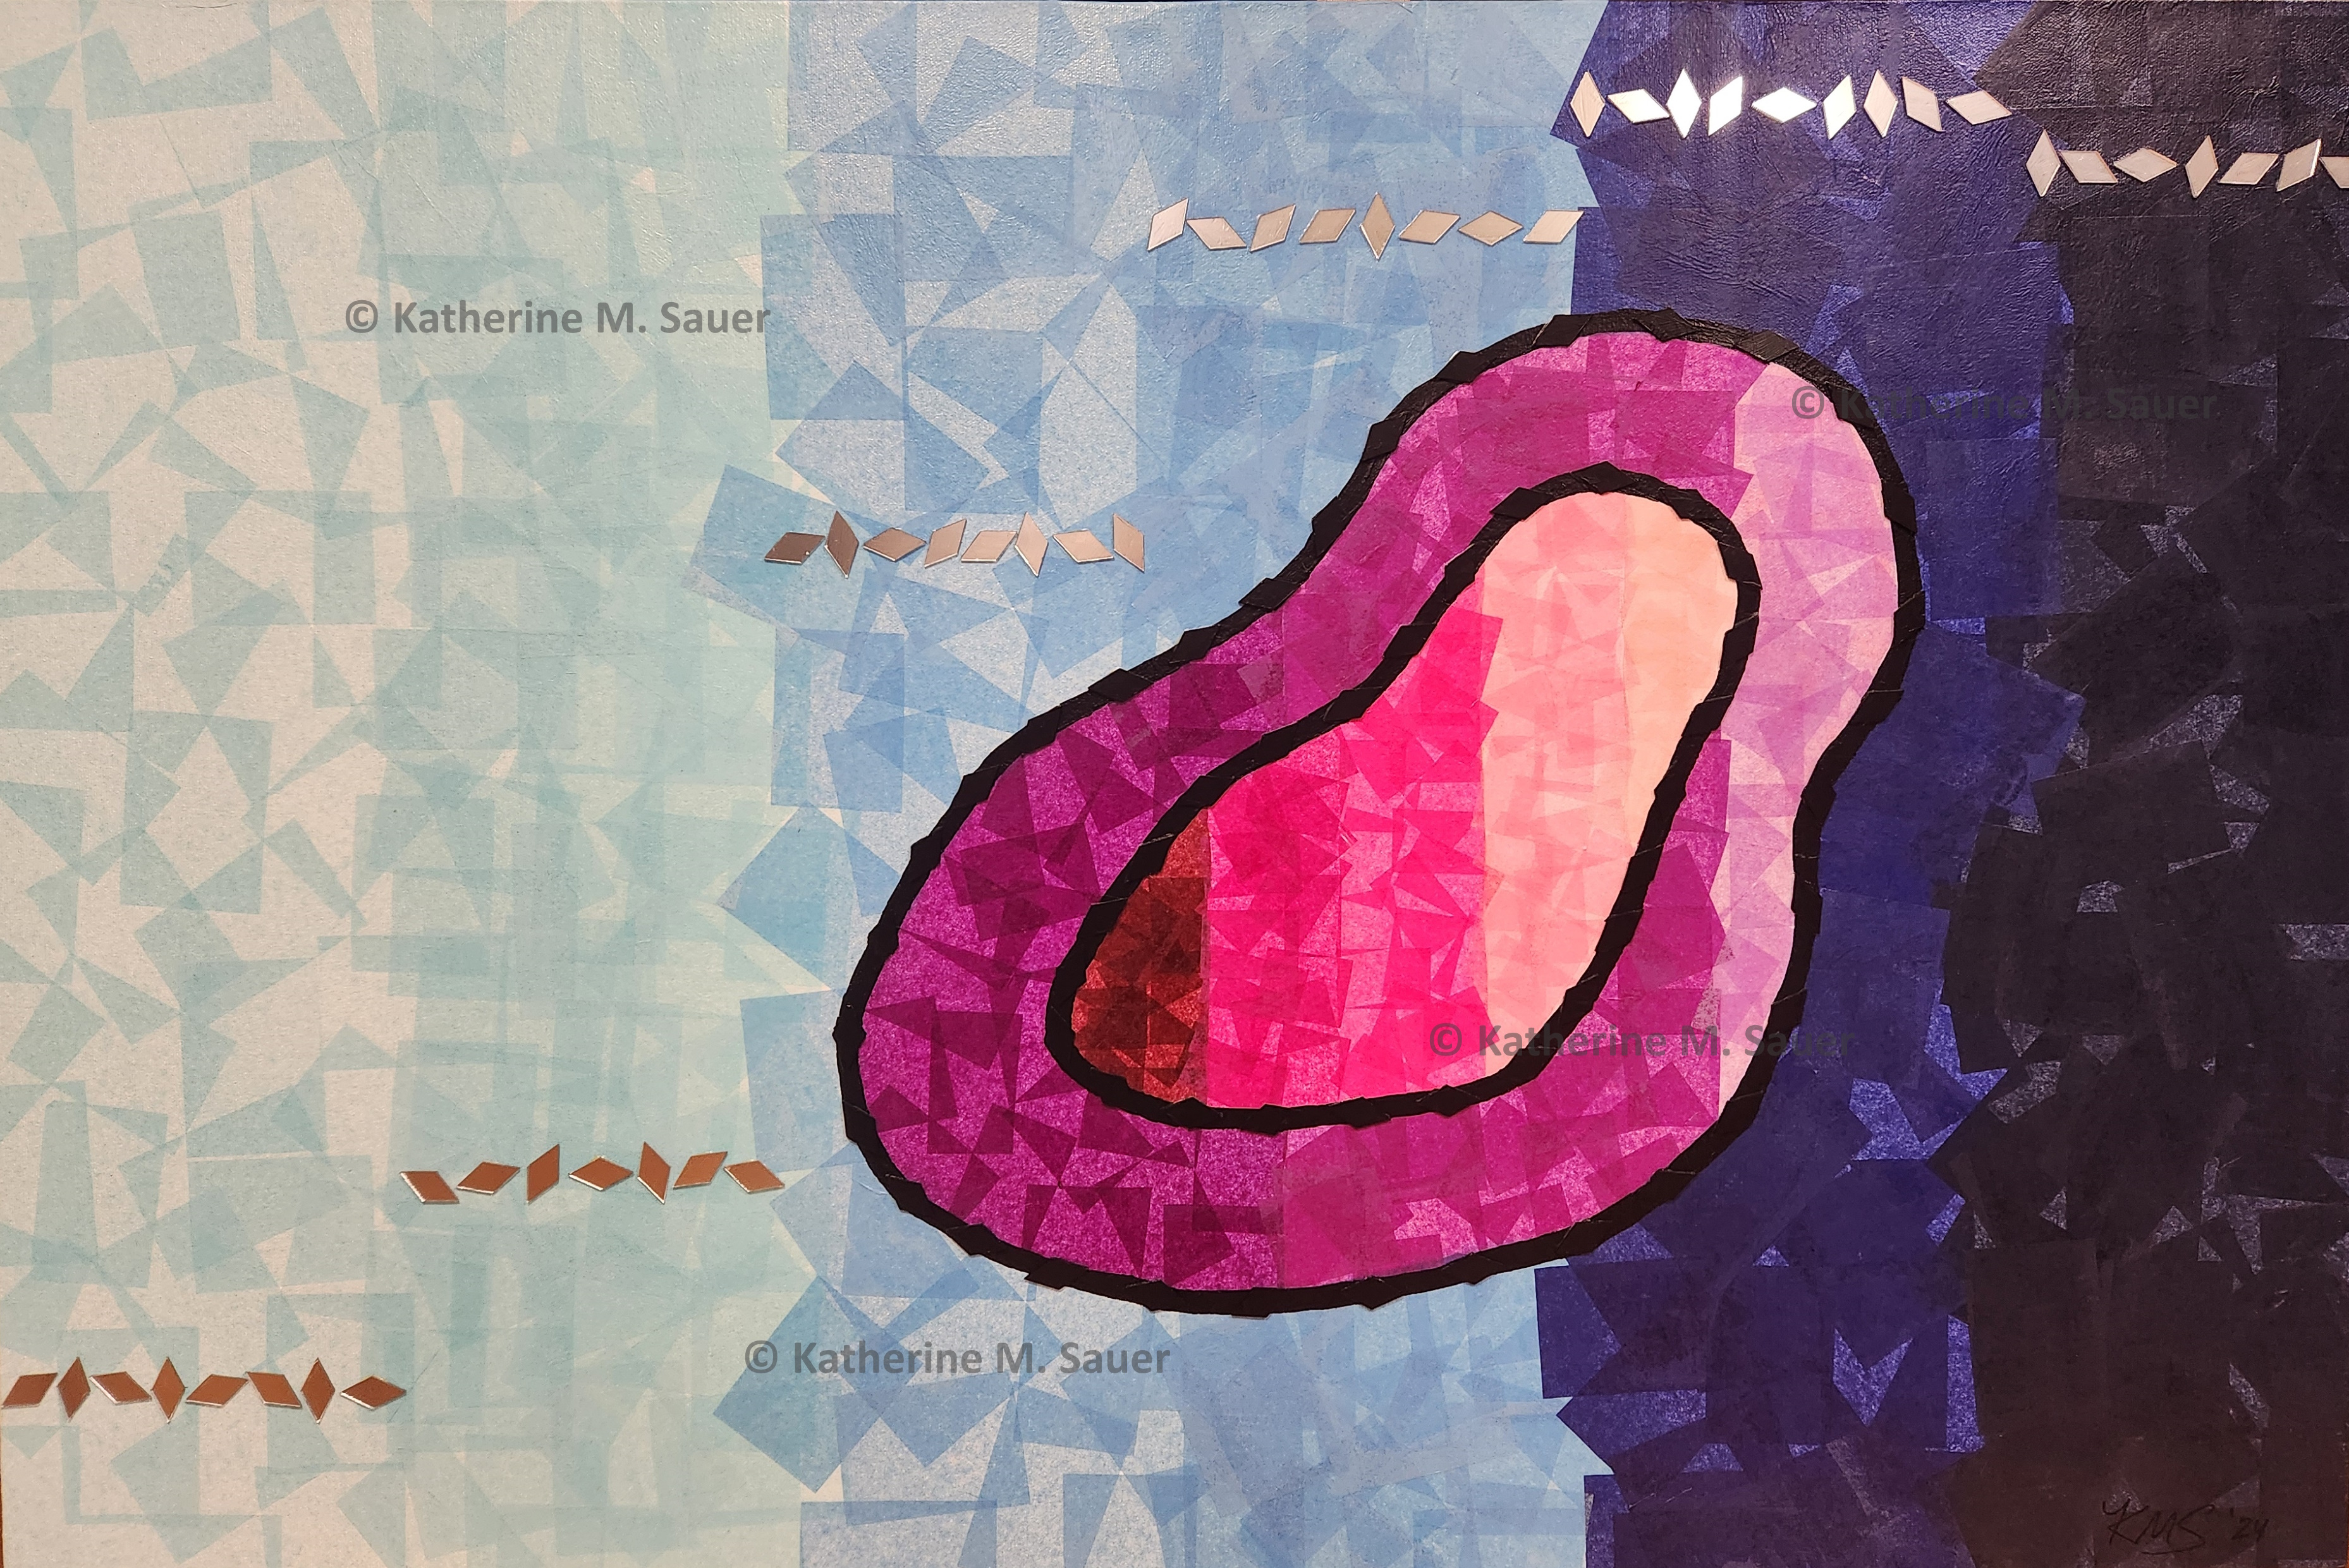
This piece depicts the status of all women globally over a fifty-year period (1970 to 2020). Average years of schooling more than doubled while average number of children born per woman was halved and is illustrated by the two figures symbolizing a mother and a child. Collectively, civil liberties of women rose for decades and then fell in the last one. The number of missing women – who would be alive in the absence of sex discrimination – is shown in the blue backdrop. A mosaic effect throughout the piece reflects that individual women have vastly different experiences than the aggregated data illustrate.
each 11" x 8.5" | ink on paper
Satellites | 48" x 24" | acrylic, ribbon, and glass beads on canvas | 2021
May | 4' x 3' | acrylic on canvas | 2012
Orange Geometric | 20" x 16" | acrylic on canvas | 2010
Disco | 2' x 3' | acrylic on canvas | 2006
RGB Circles | 2' x 3' | acrylic on canvas | 2006
RGB Lines | 2' x 3' | acrylic on canvas | 2006
RGB Rectangles | 2' x 3' | acrylic on canvas | 2006
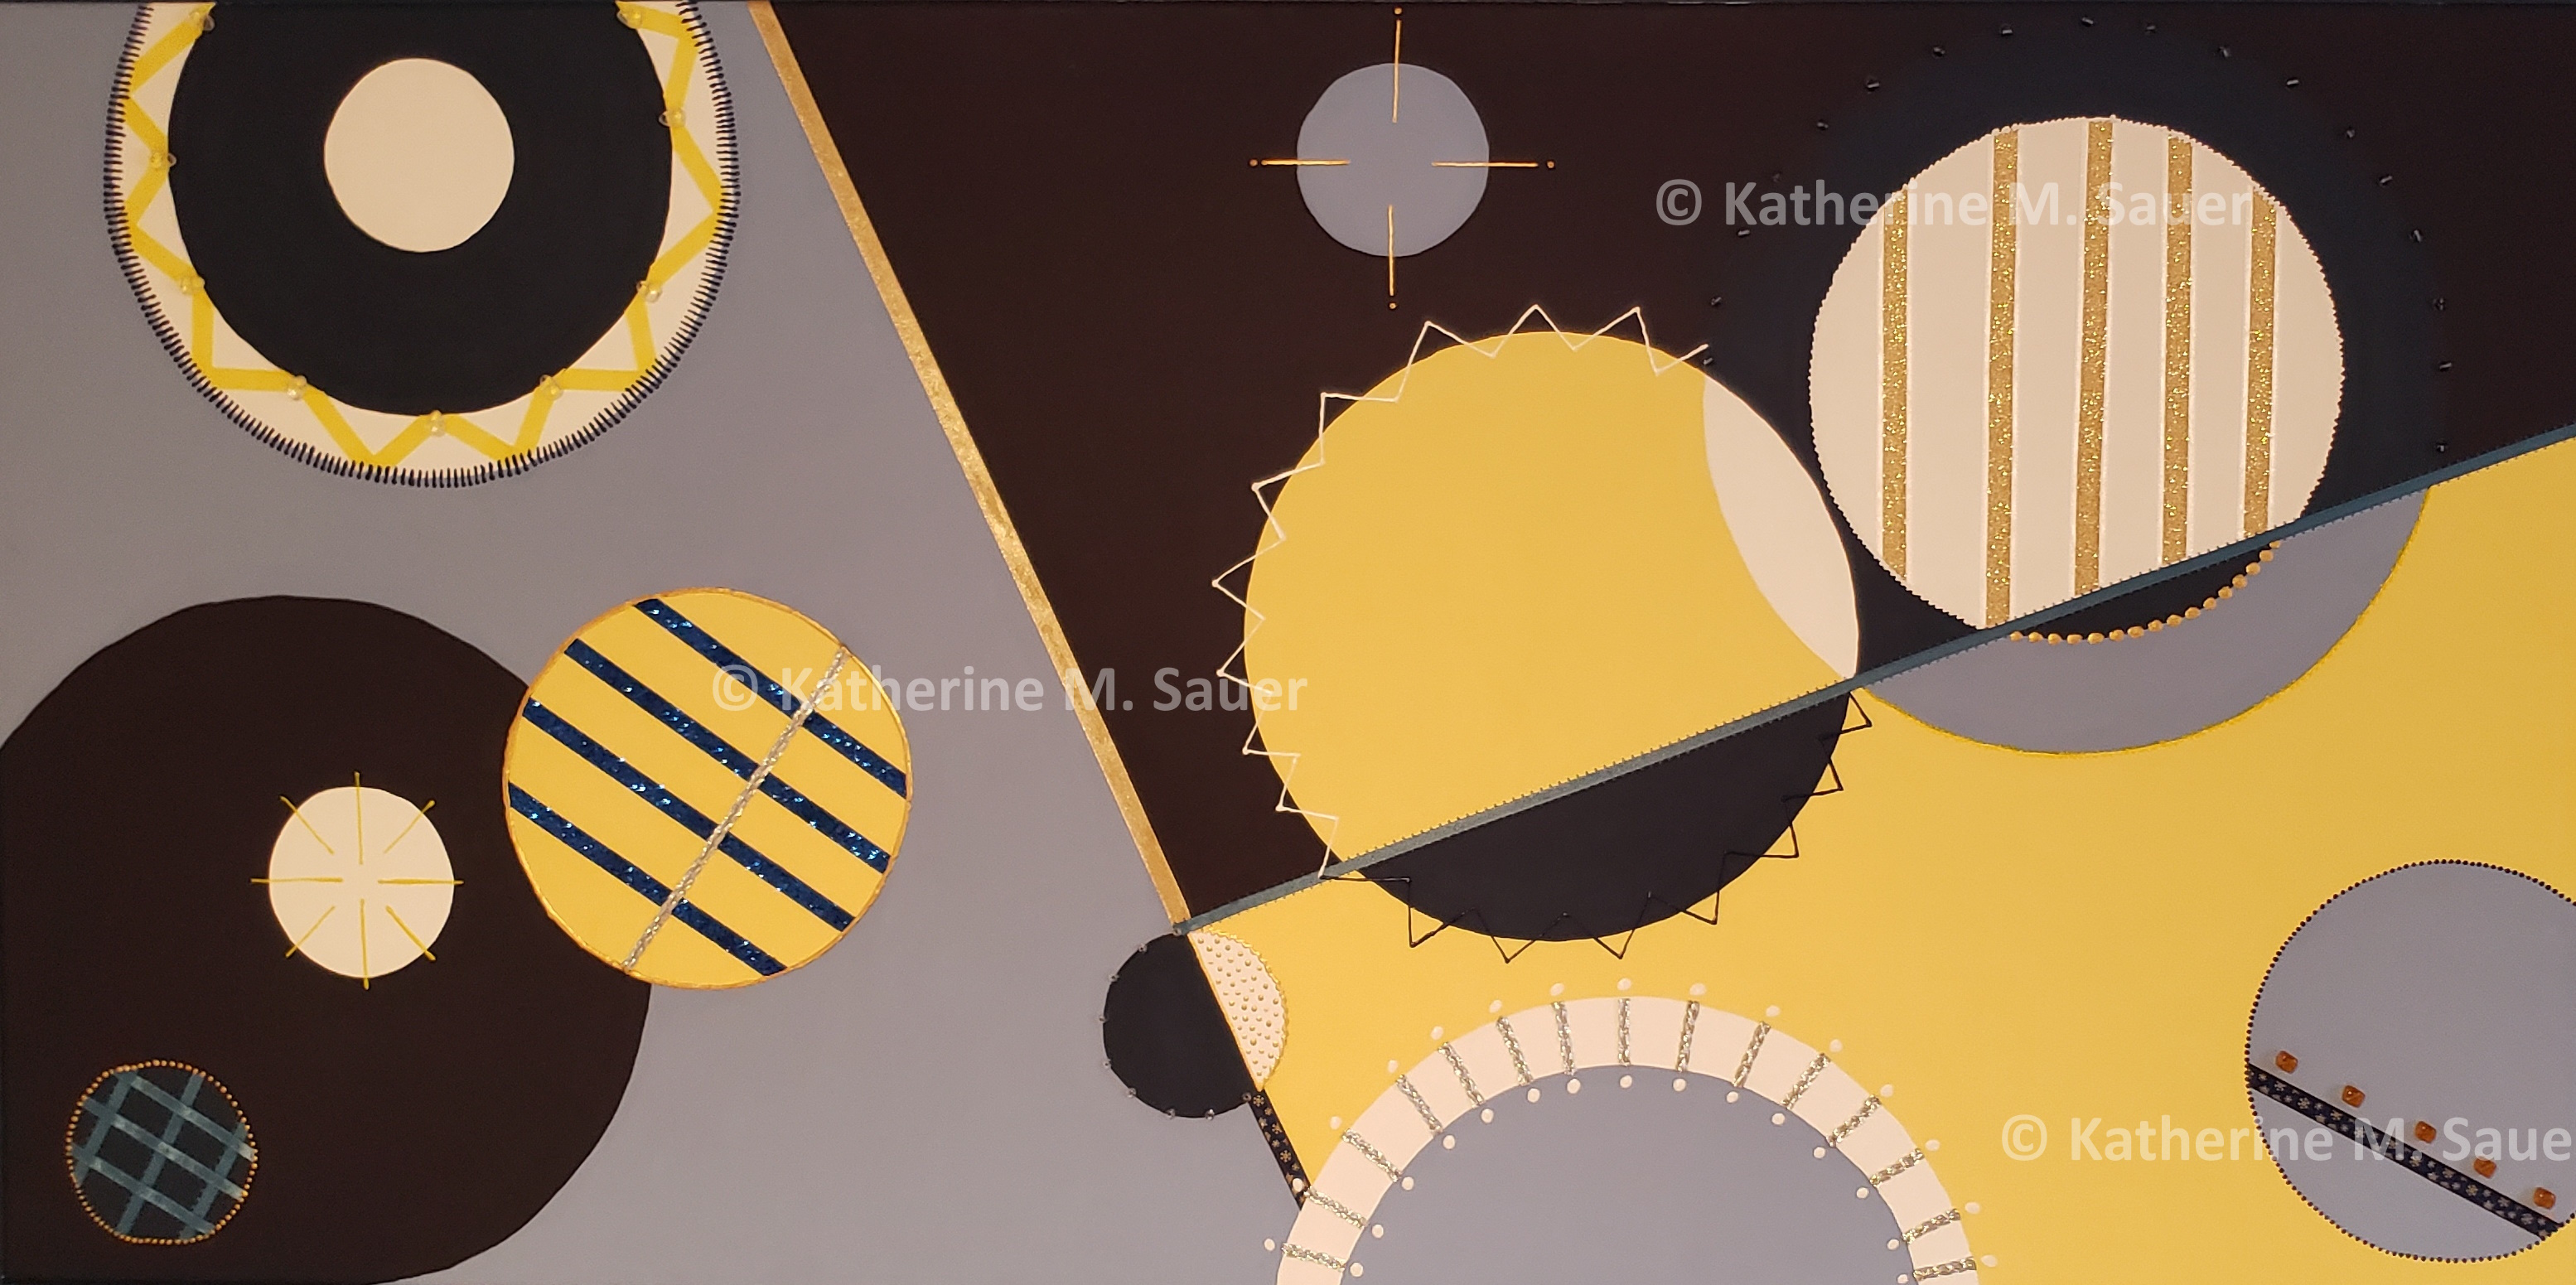
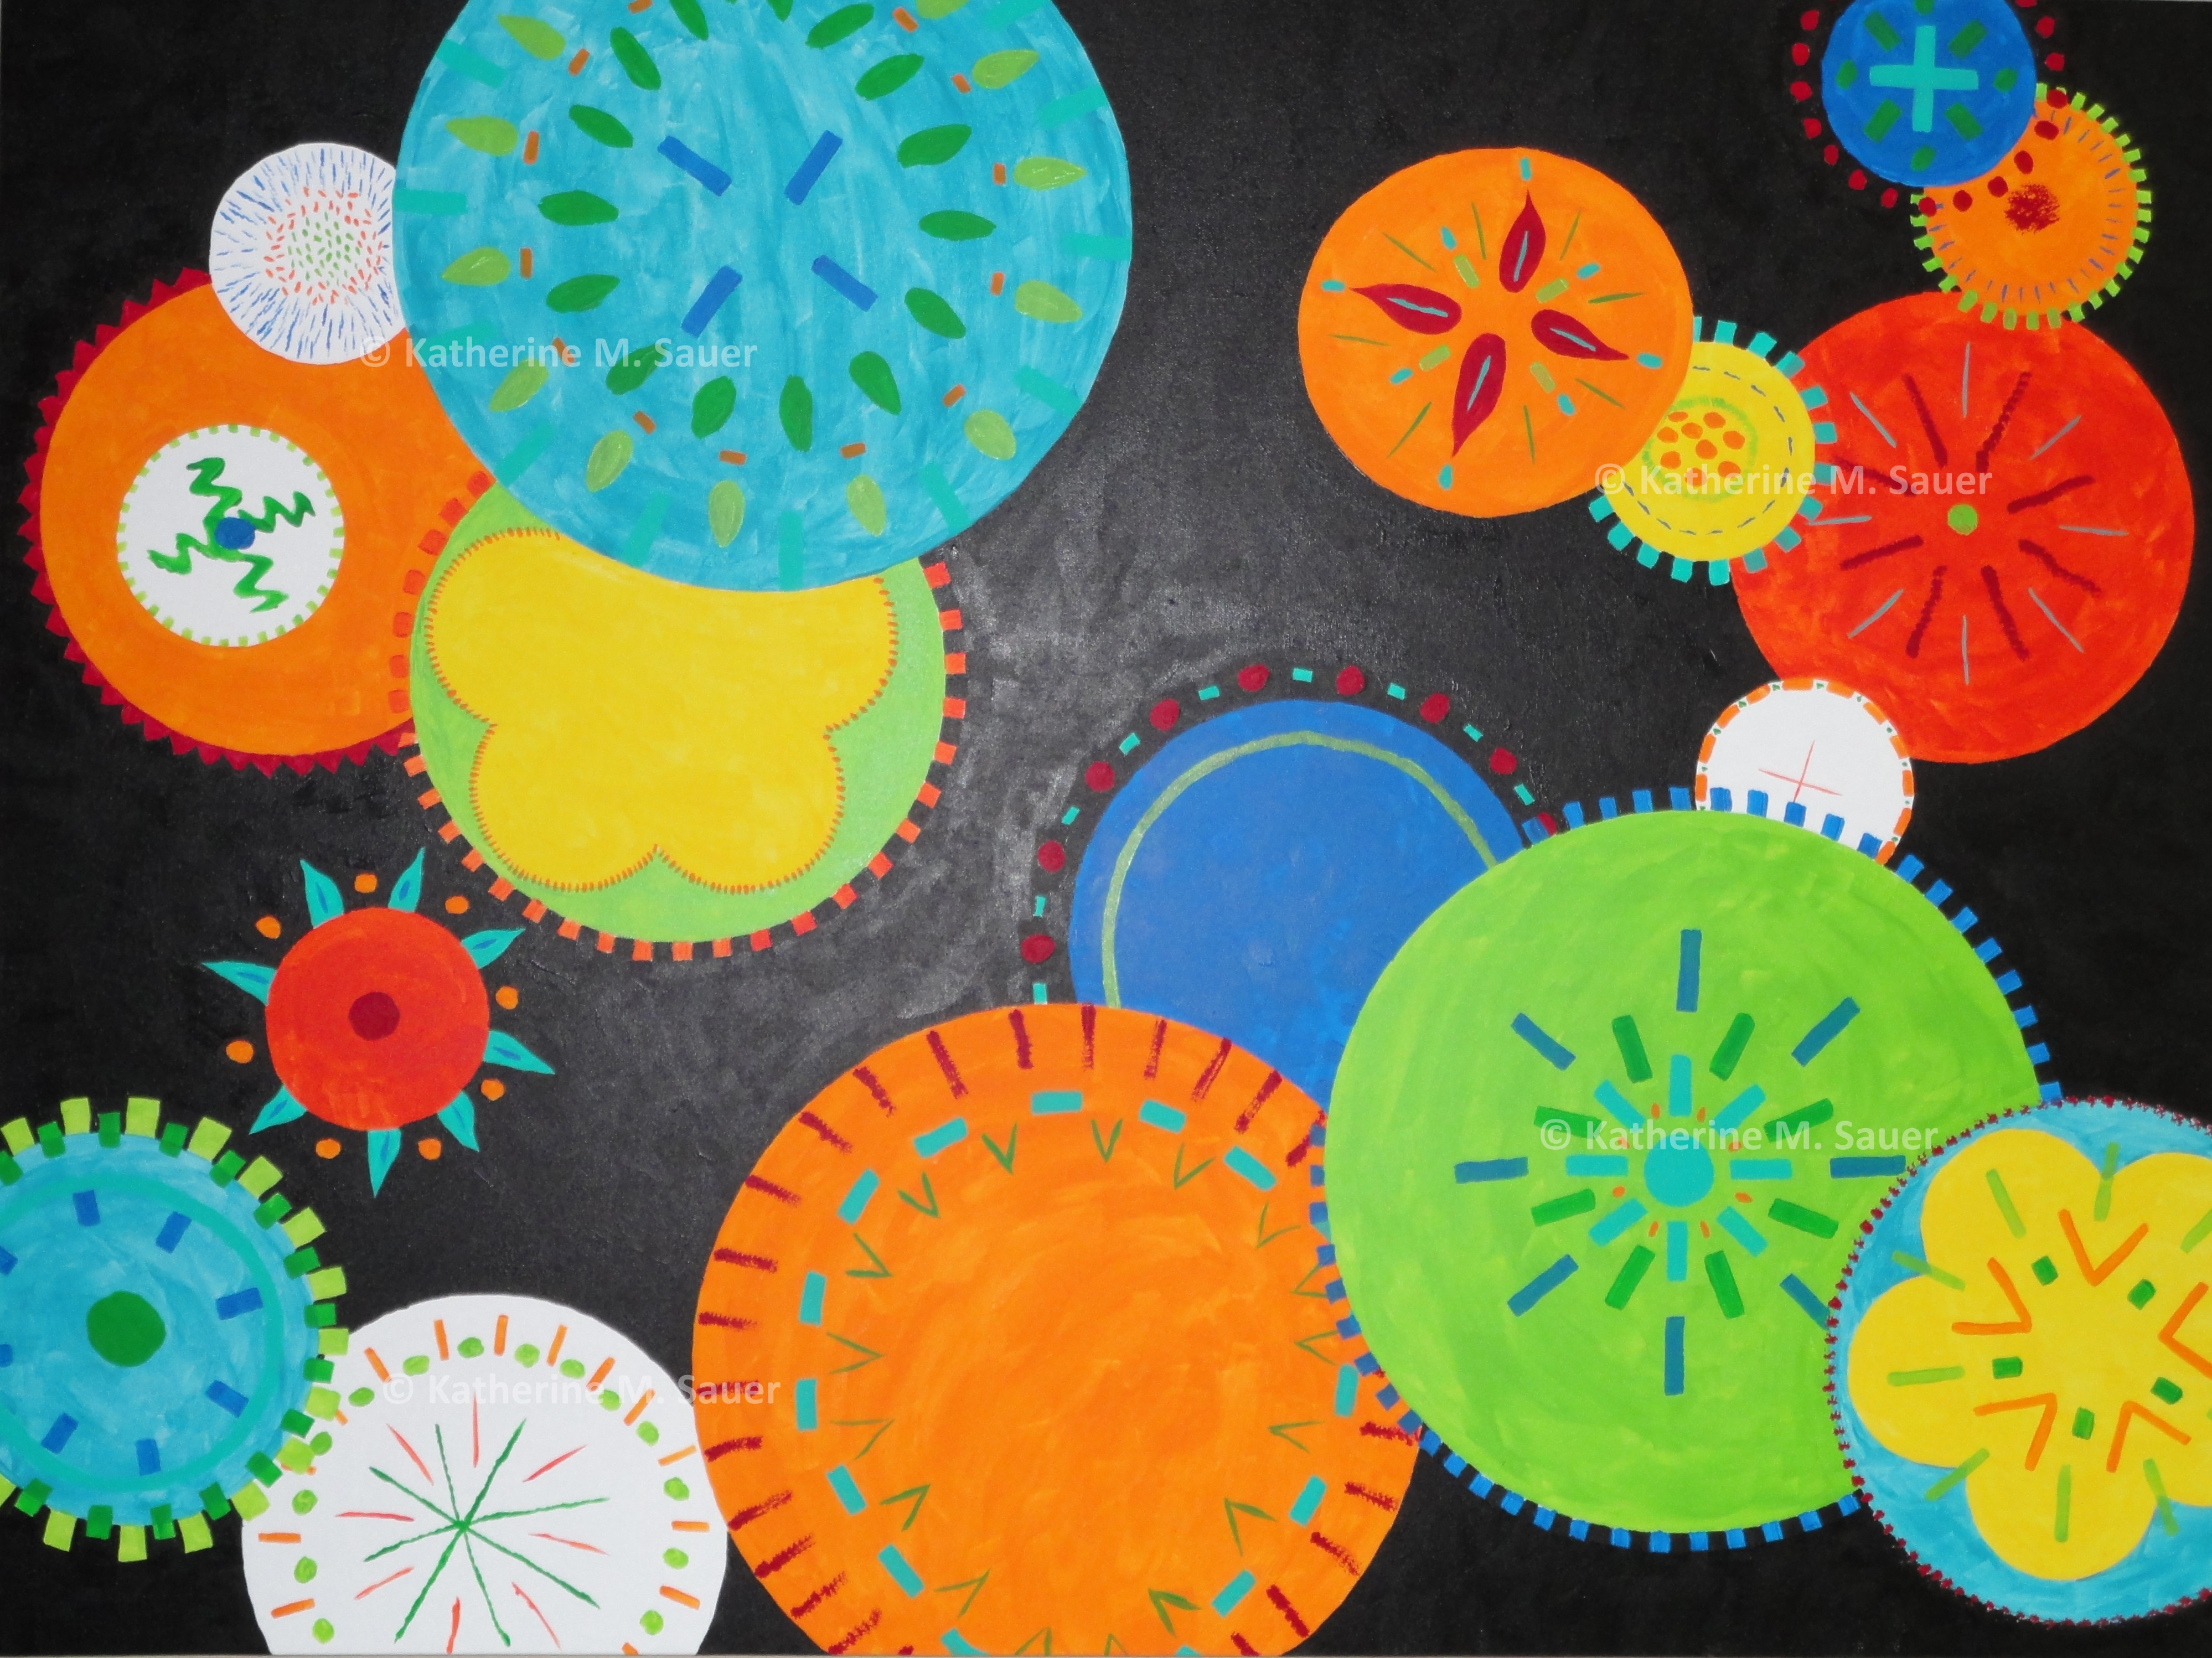


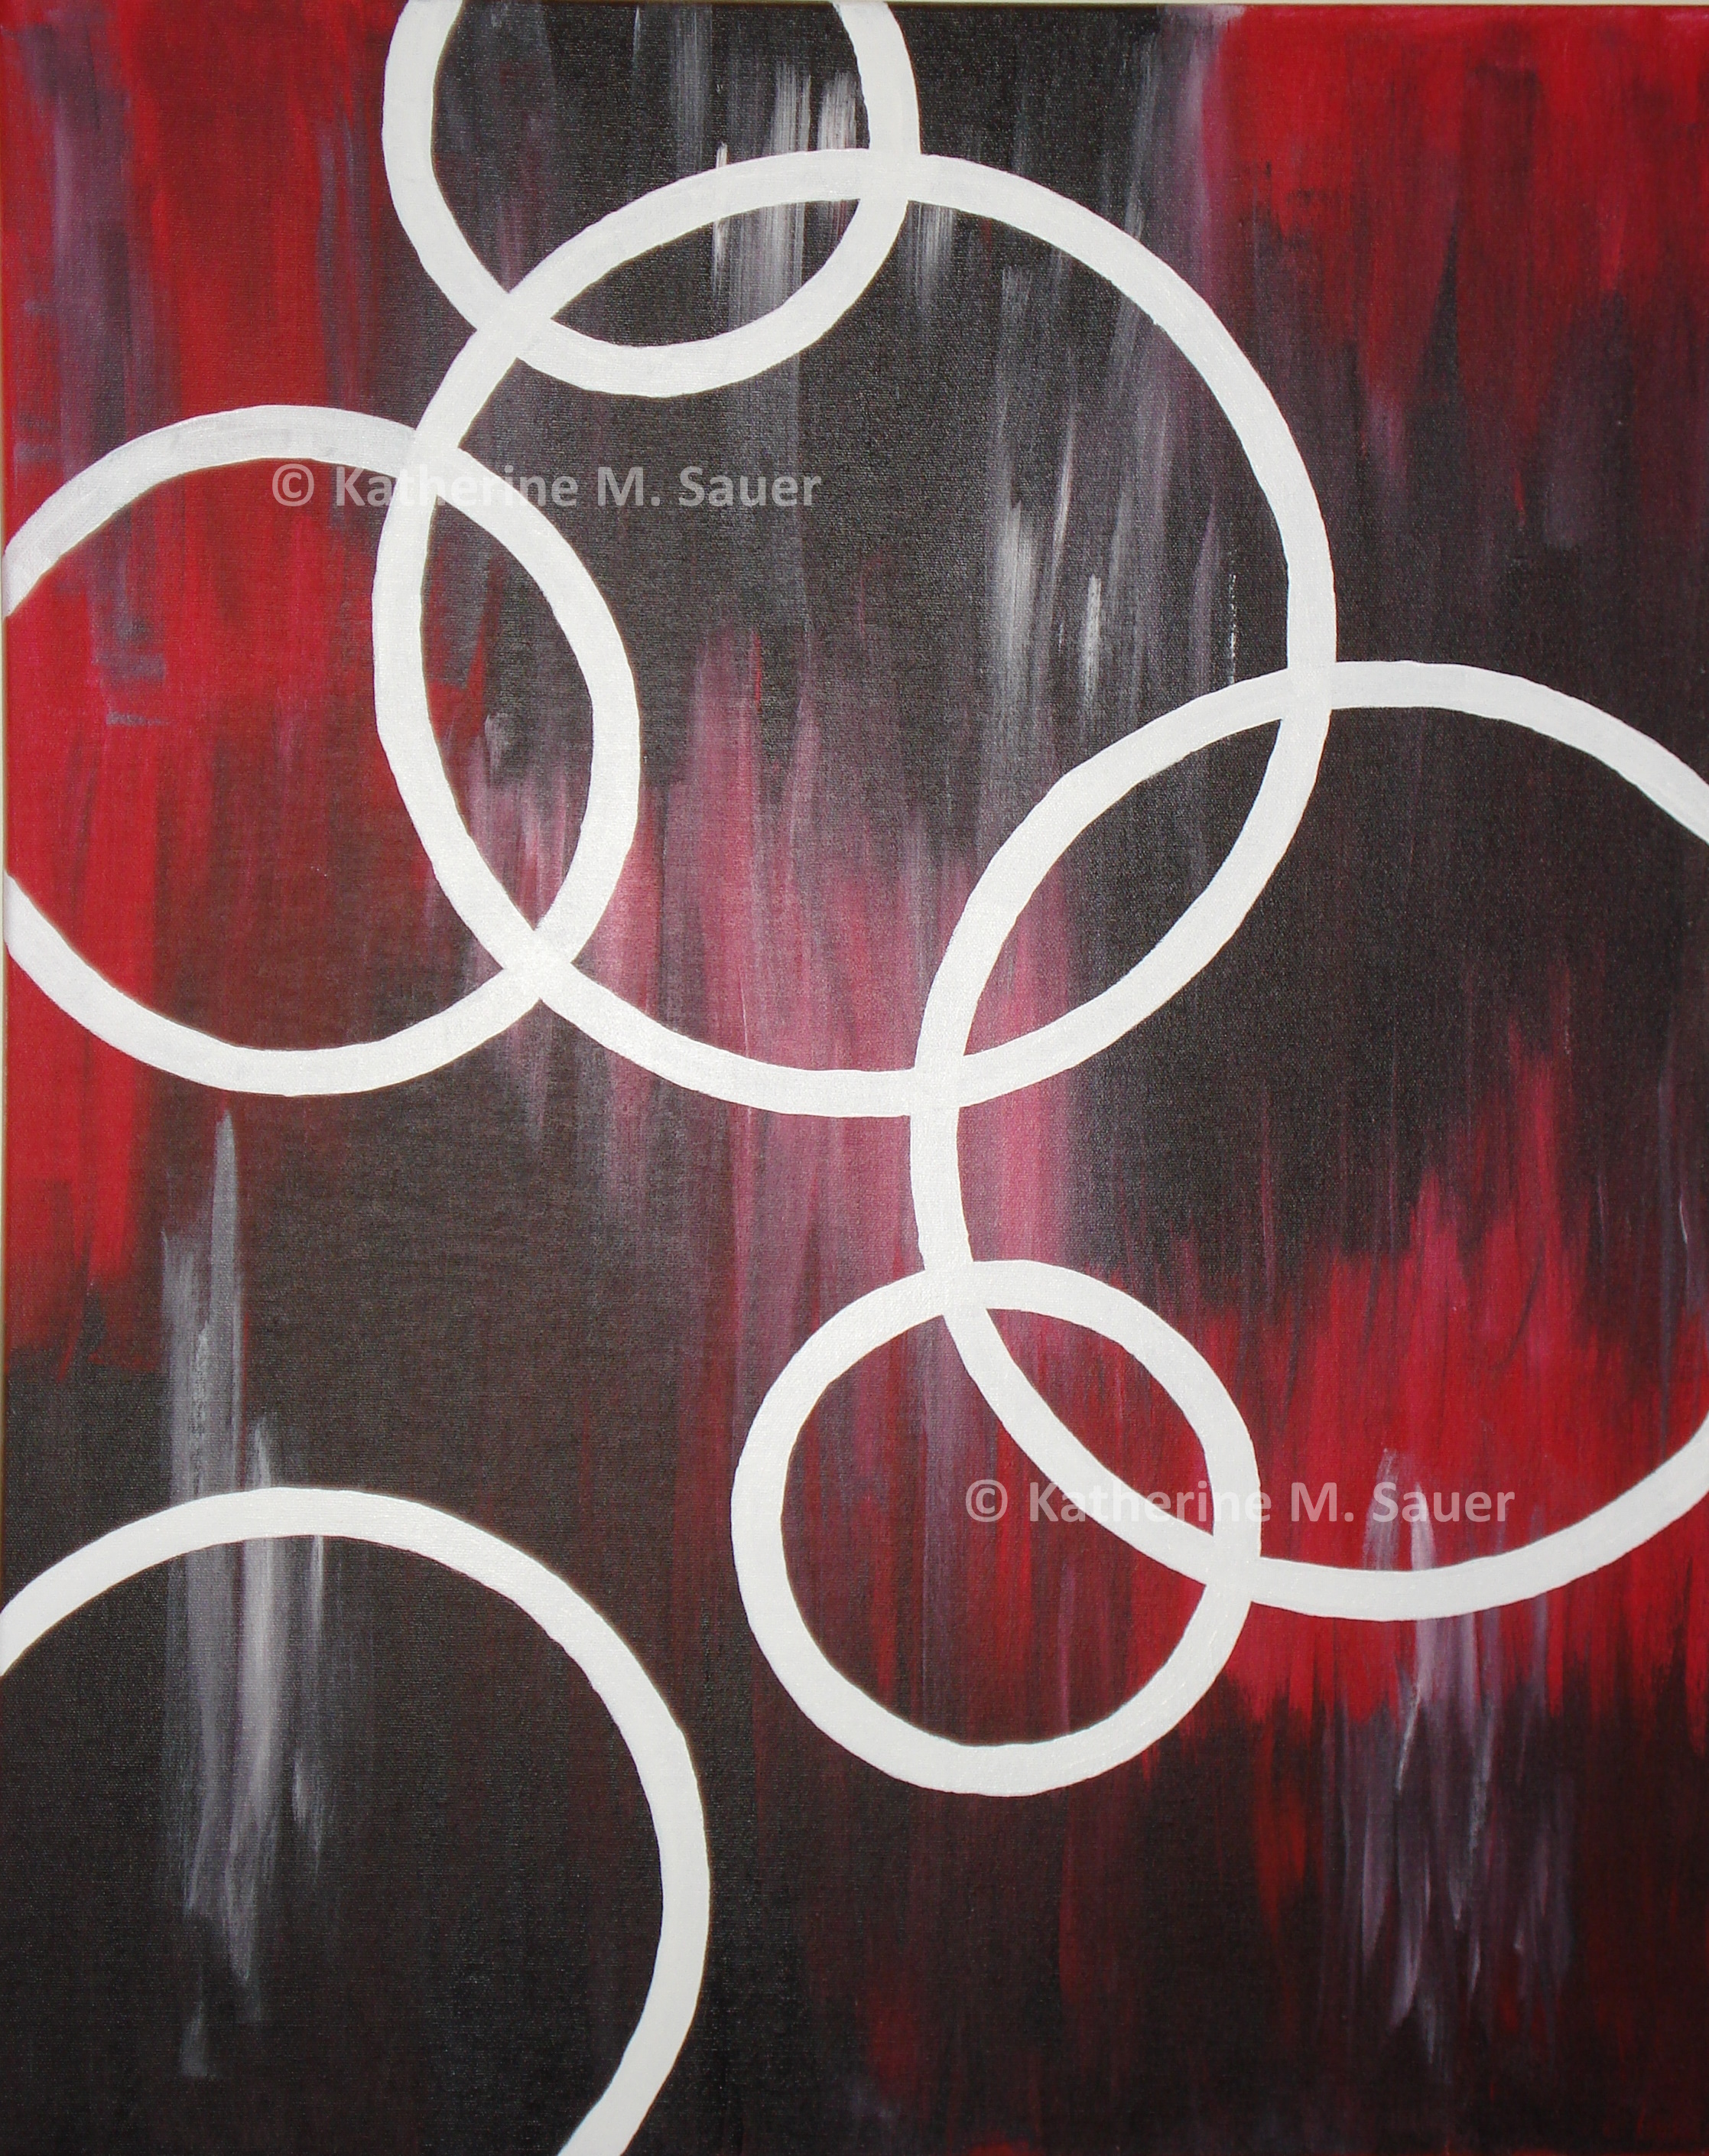
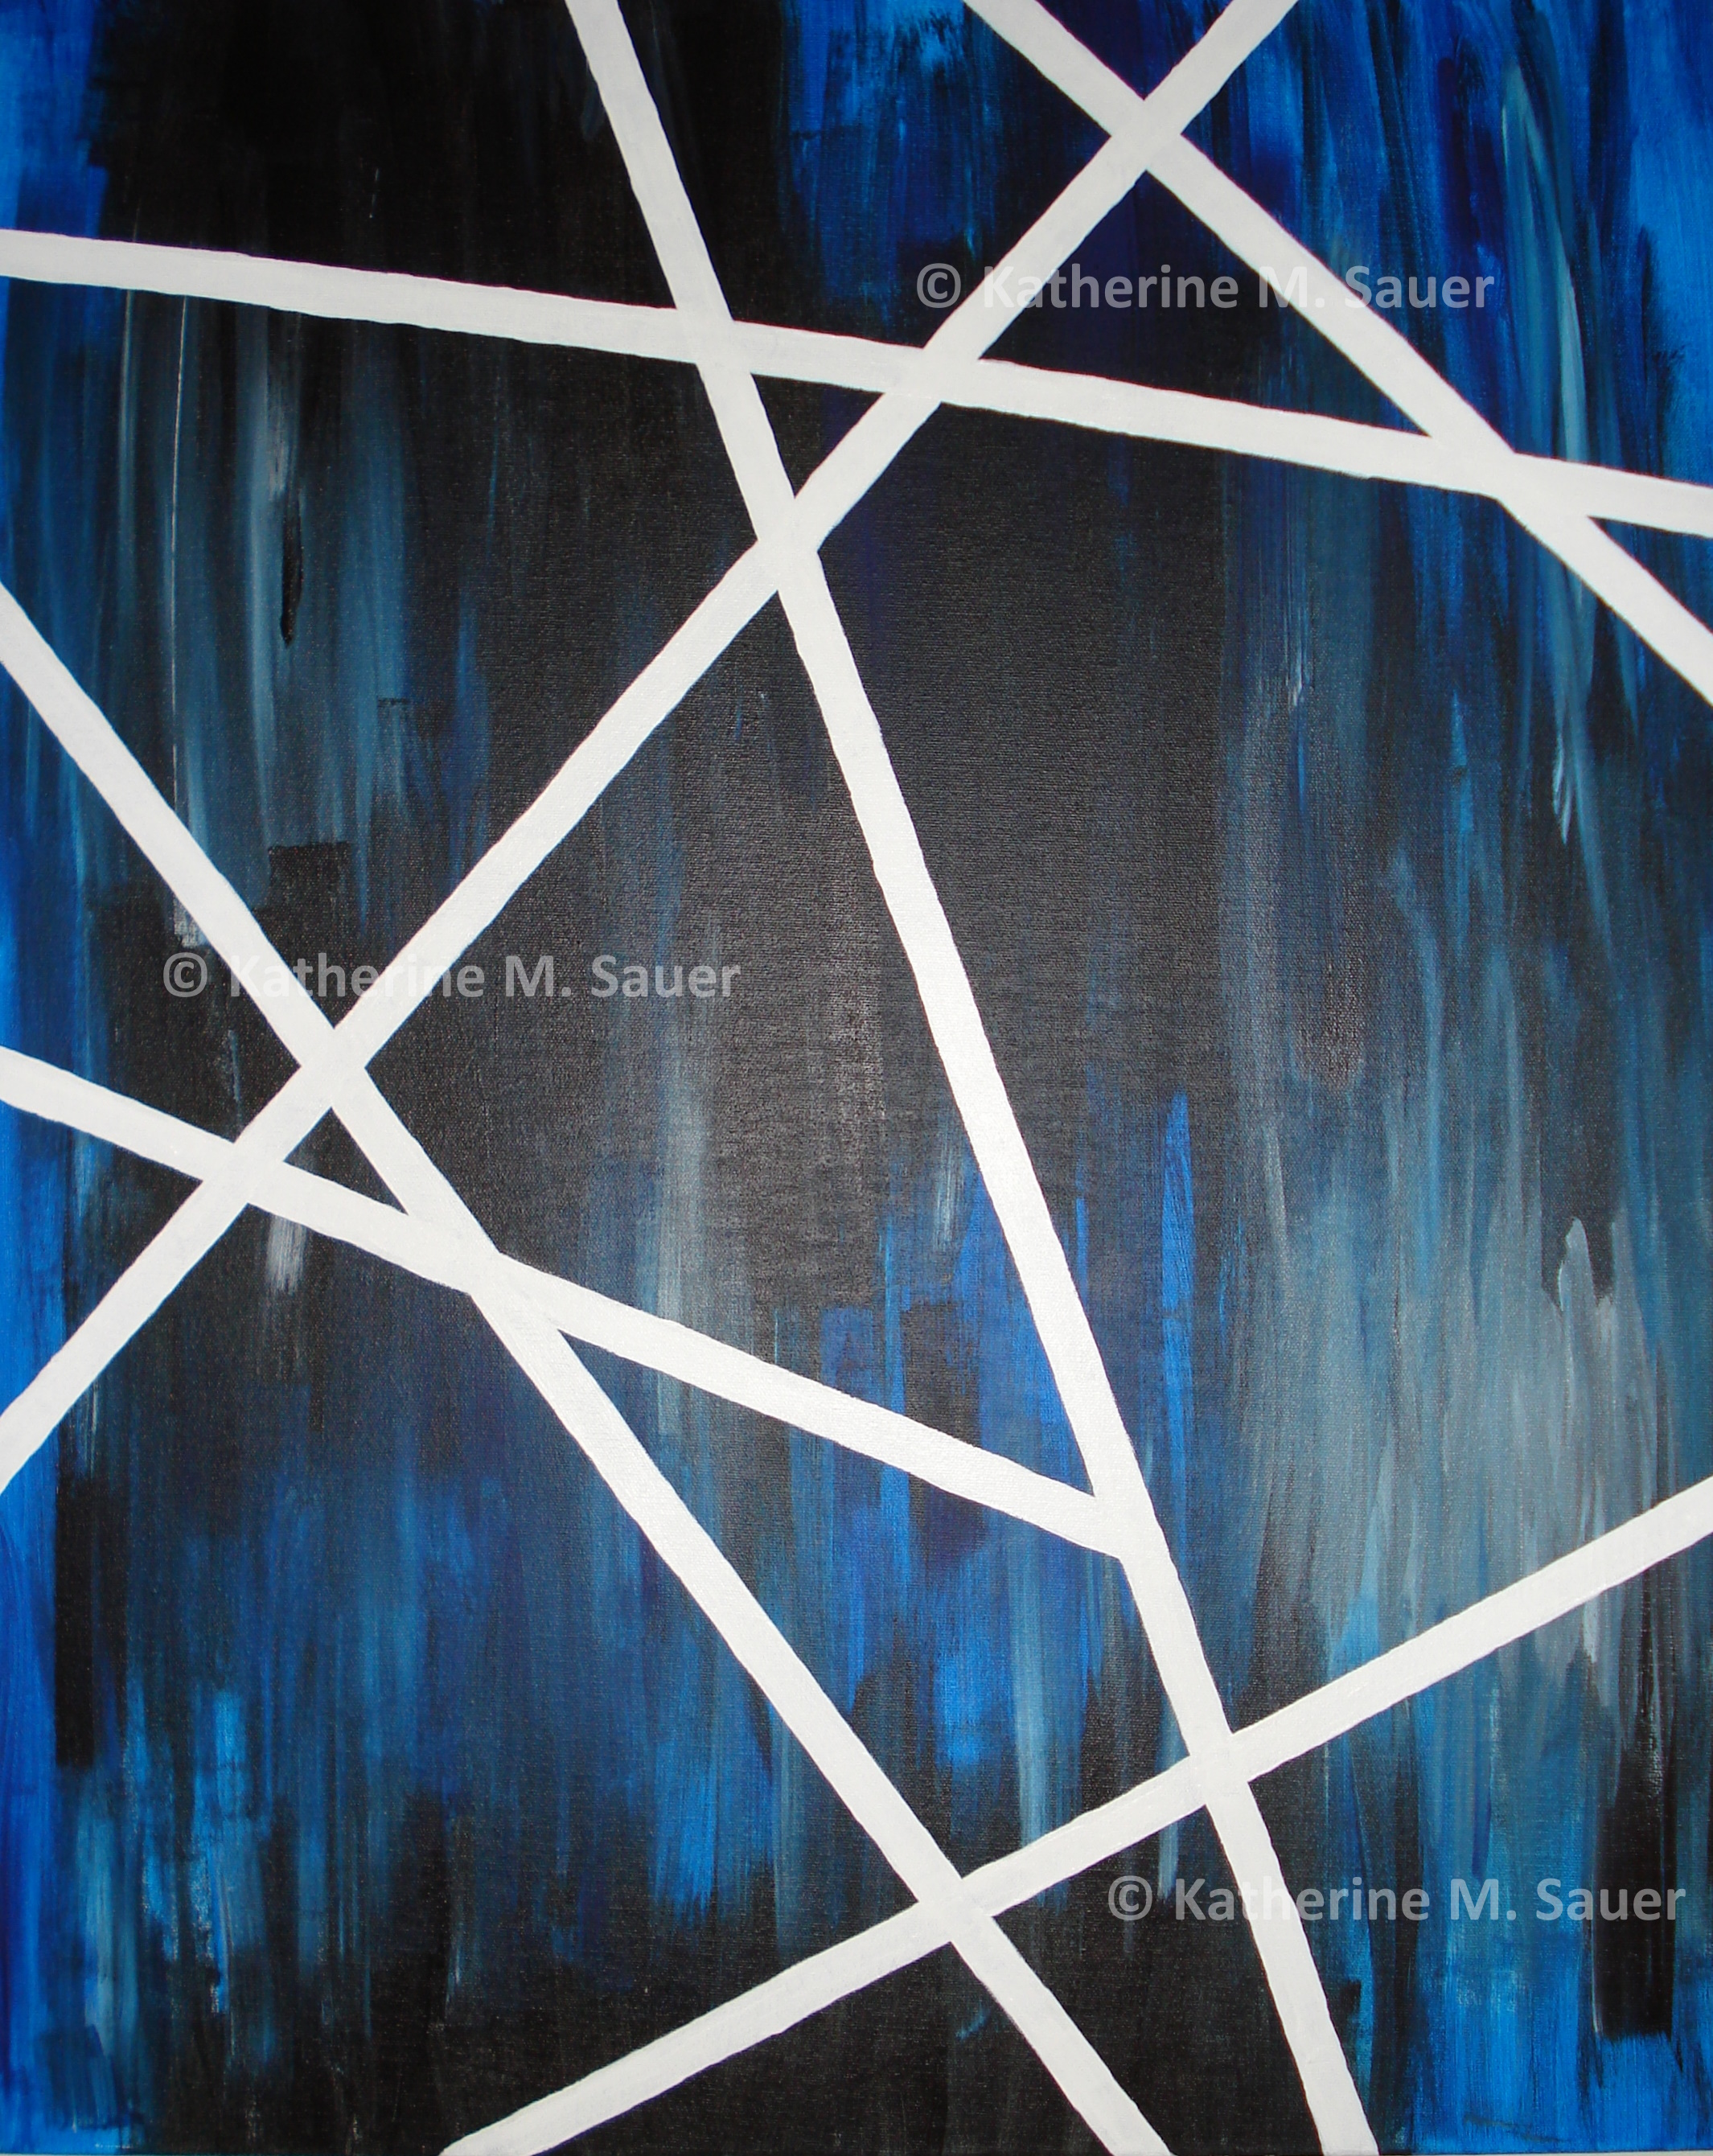
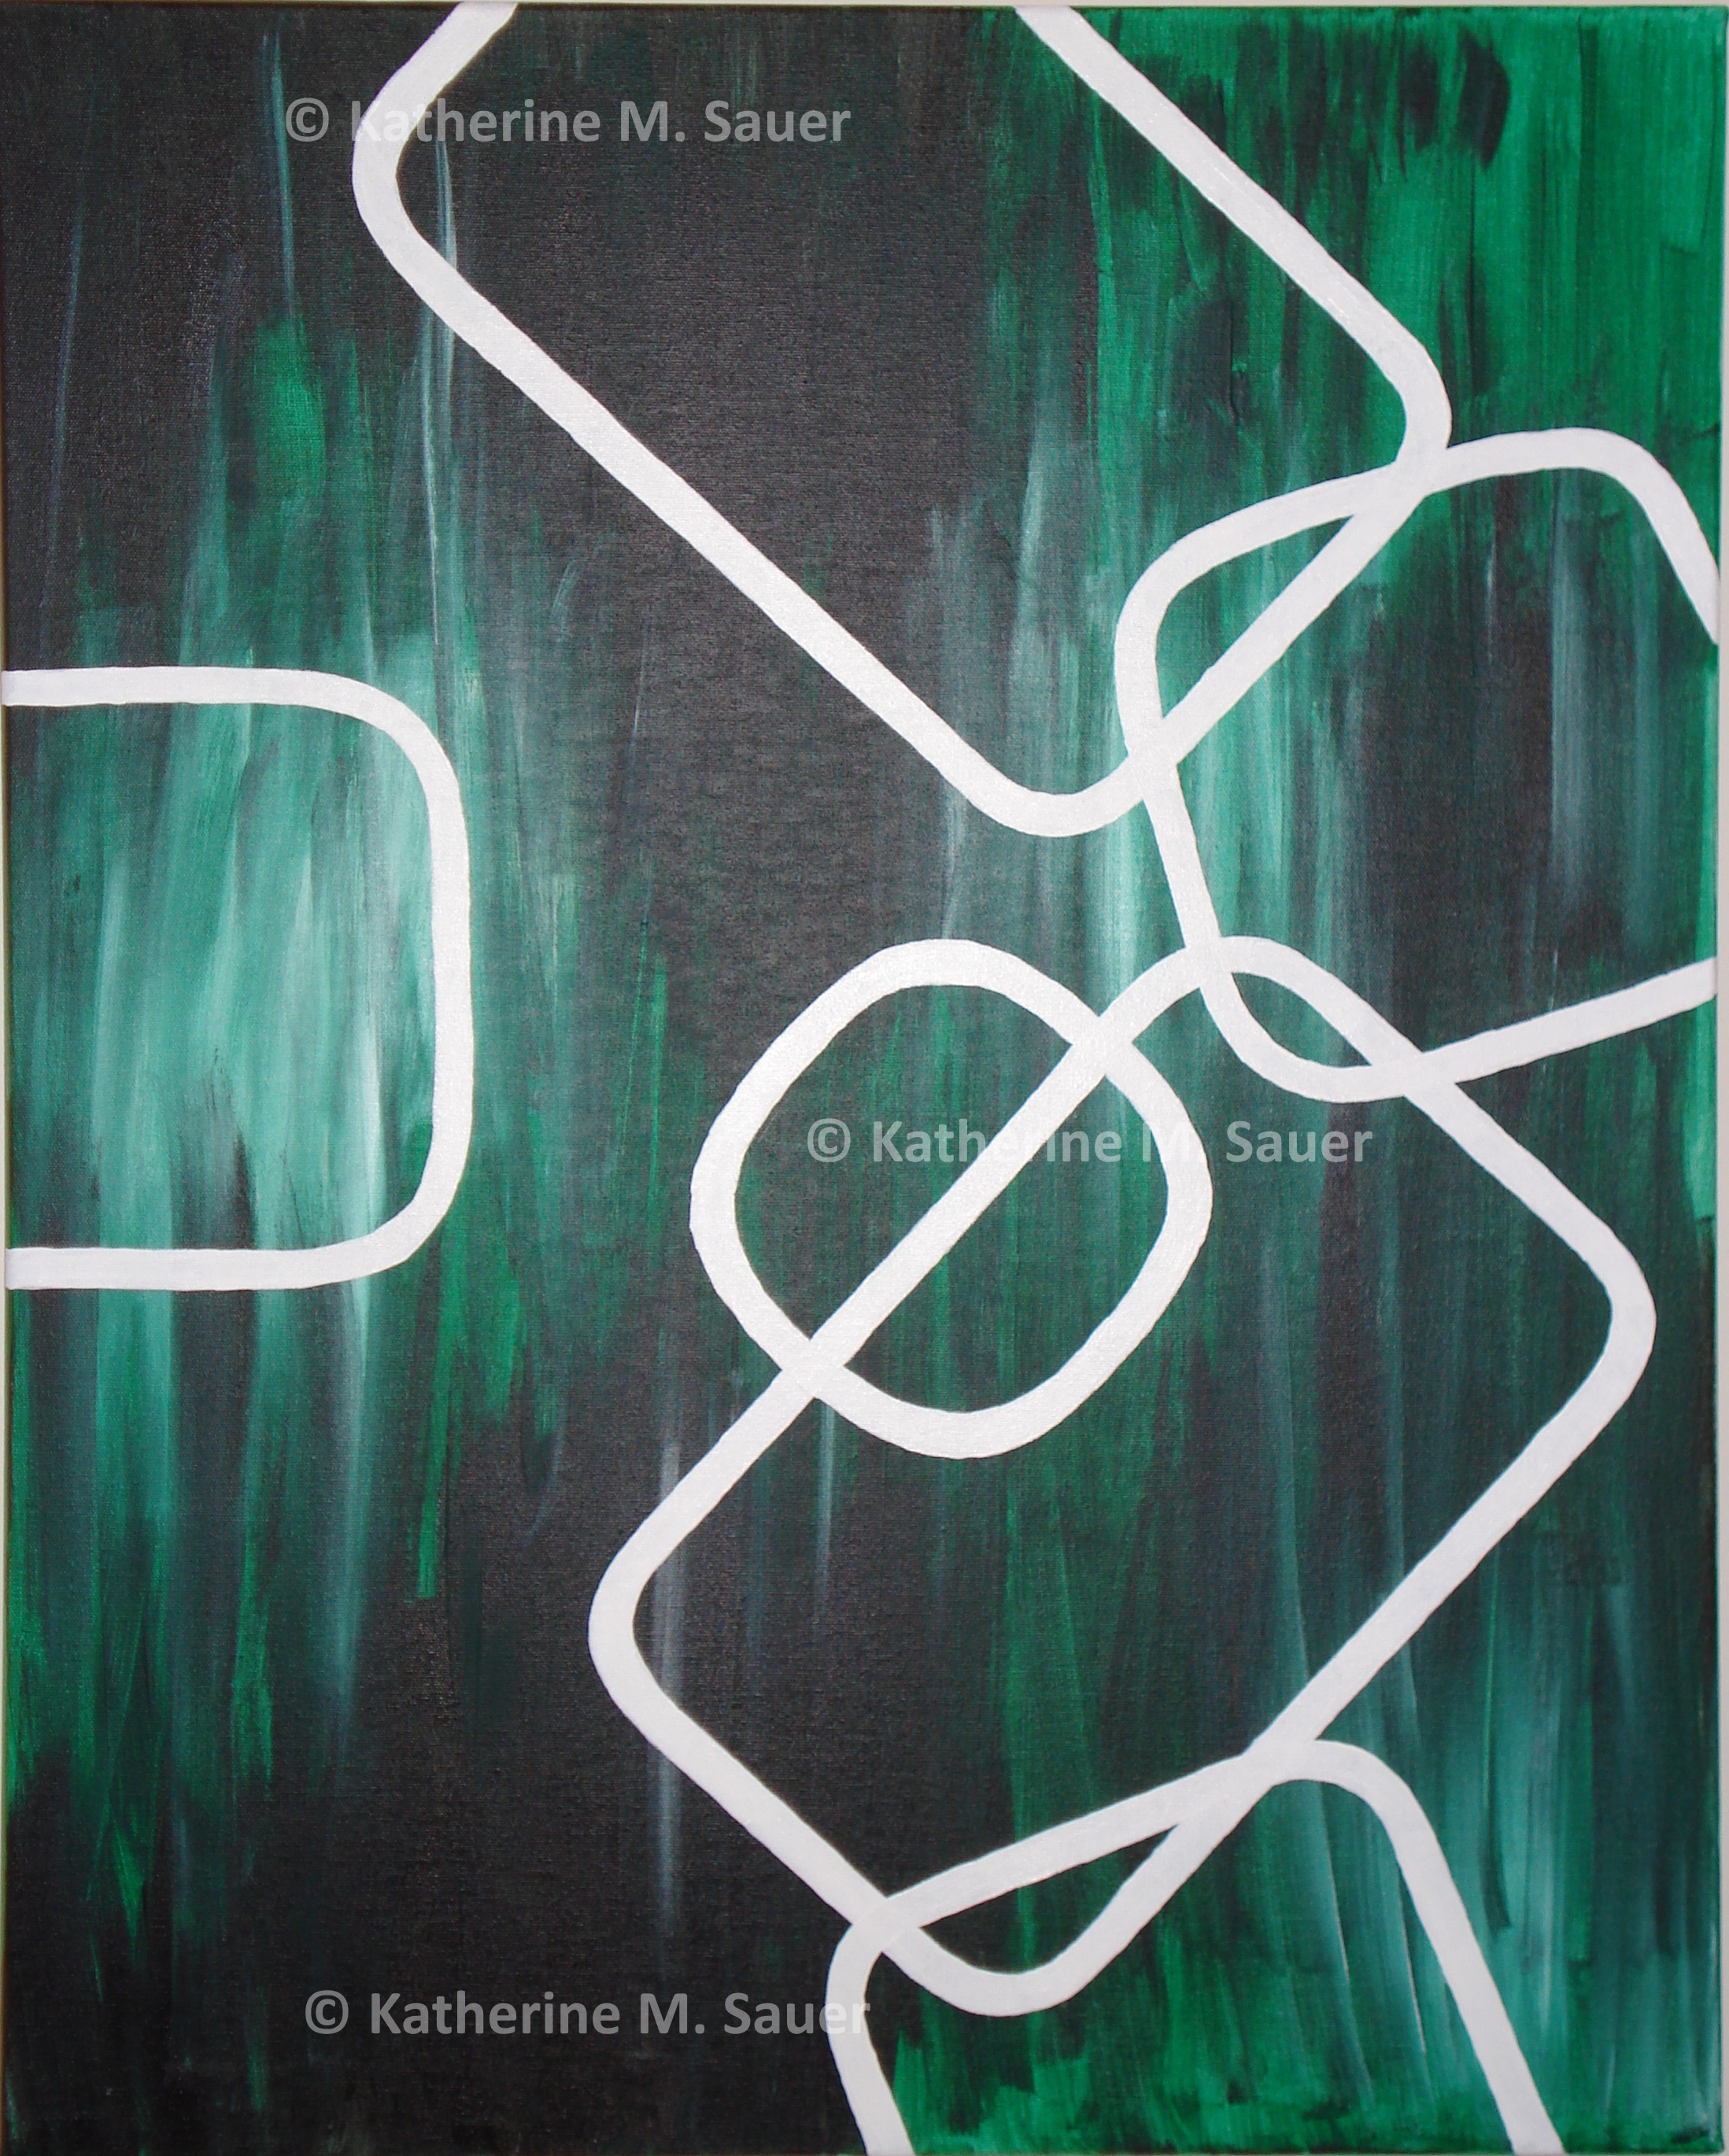
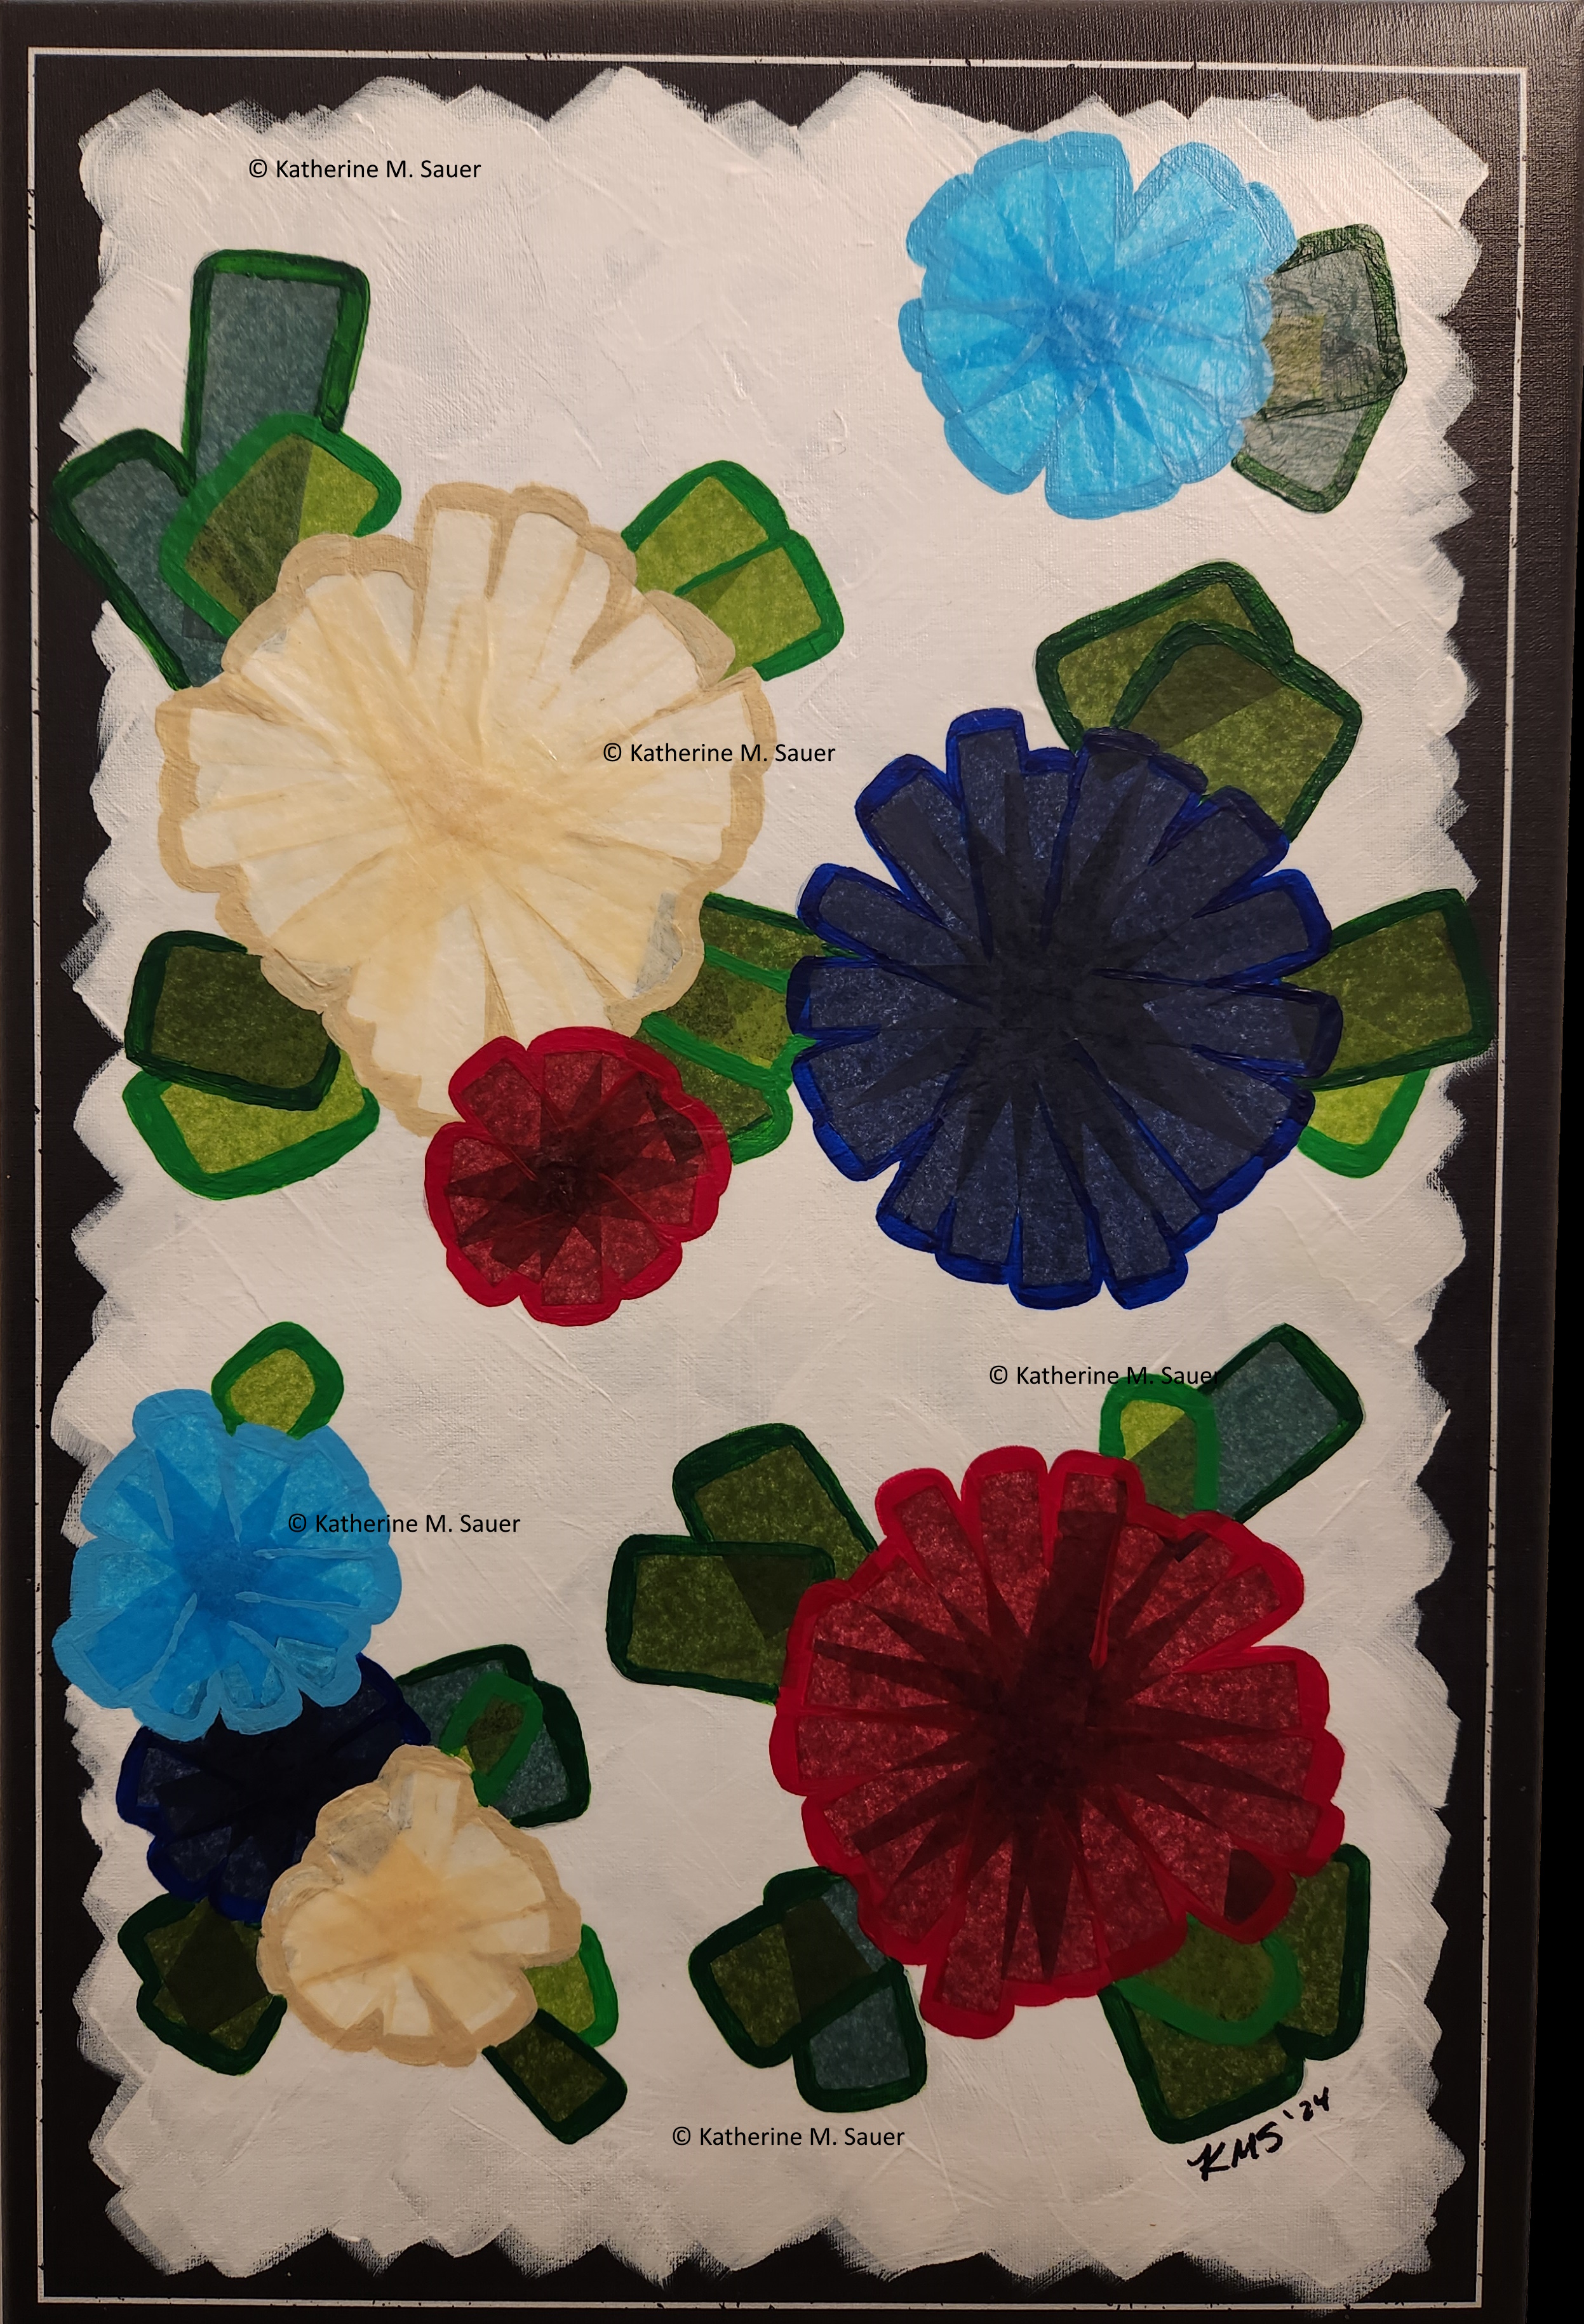
Dahlias | 12" x 18" | paper and acrylic on coated recylced canvas | 2024
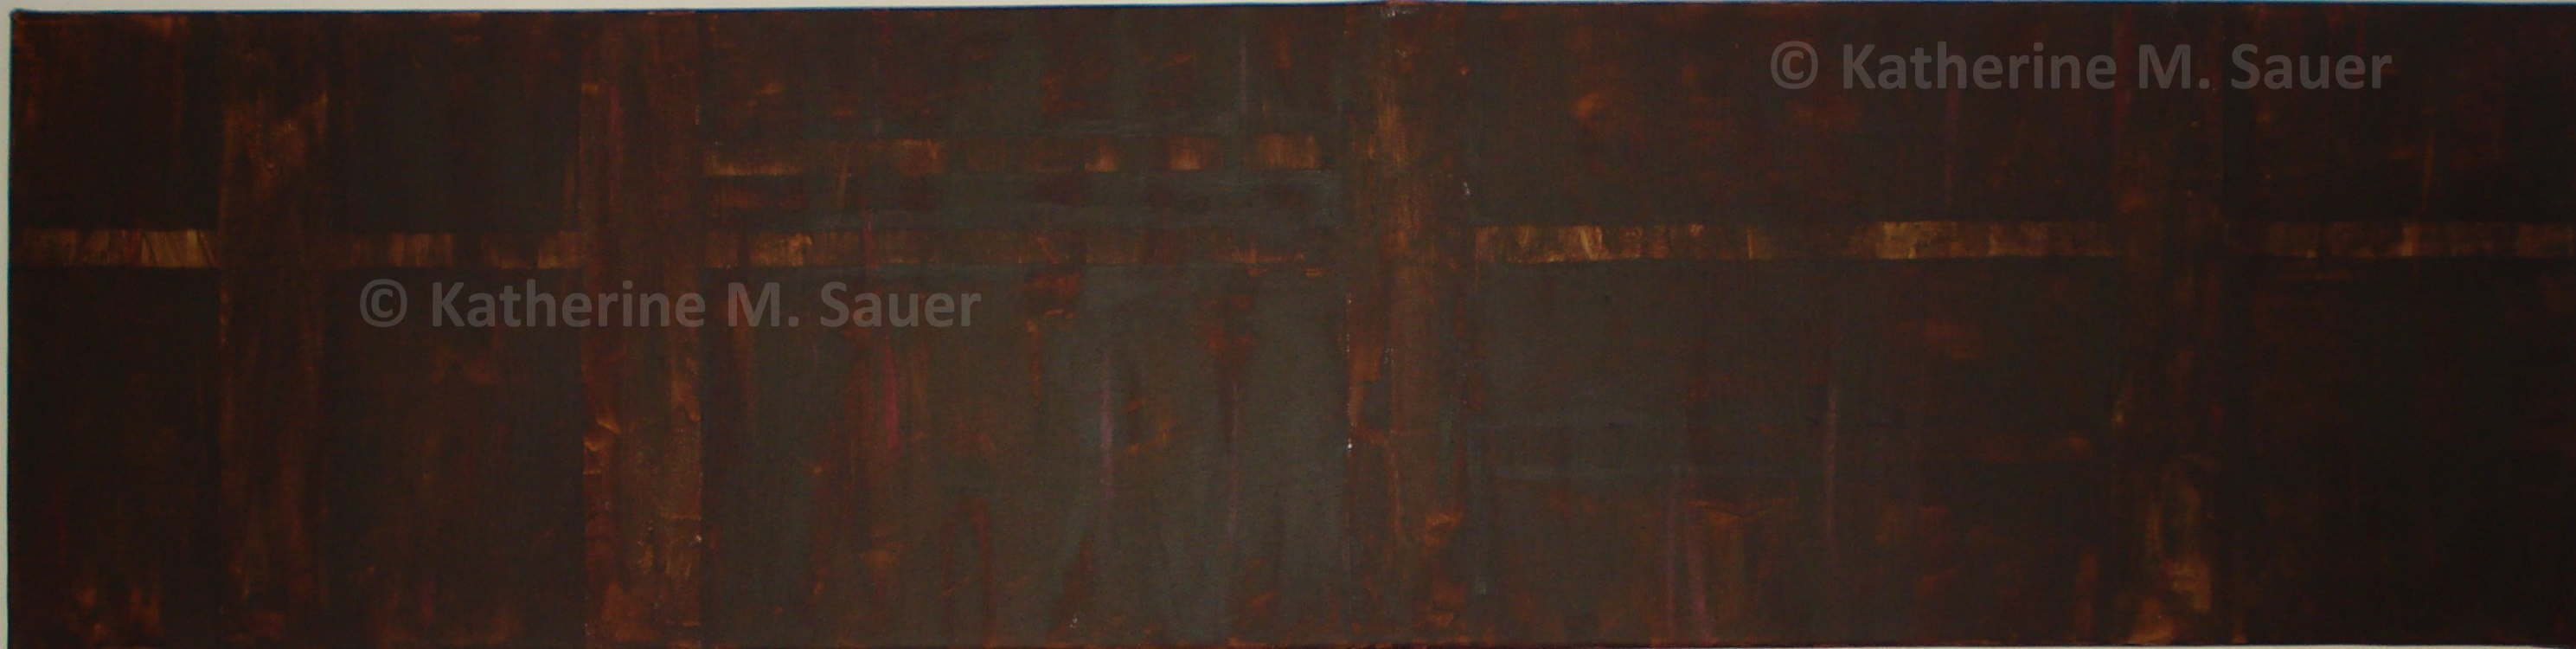
Panel I | 36" x 12" | acrylic on canvas | 2010
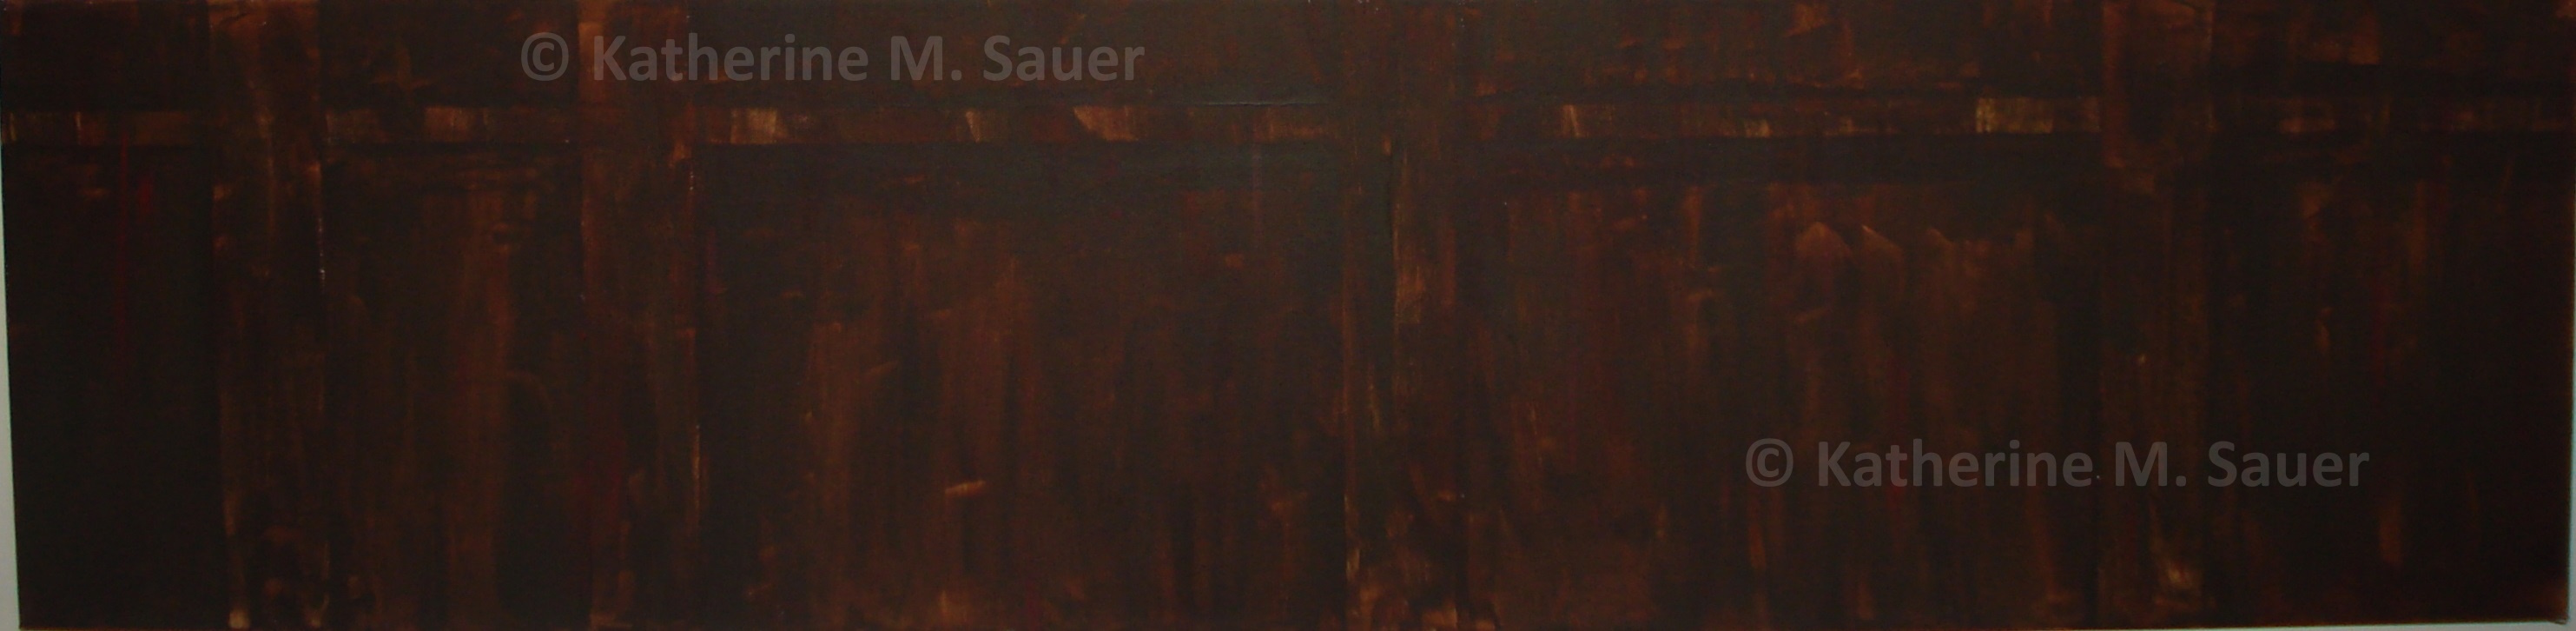
Panel II | 36" x 12" | acrylic on canvas | 2010
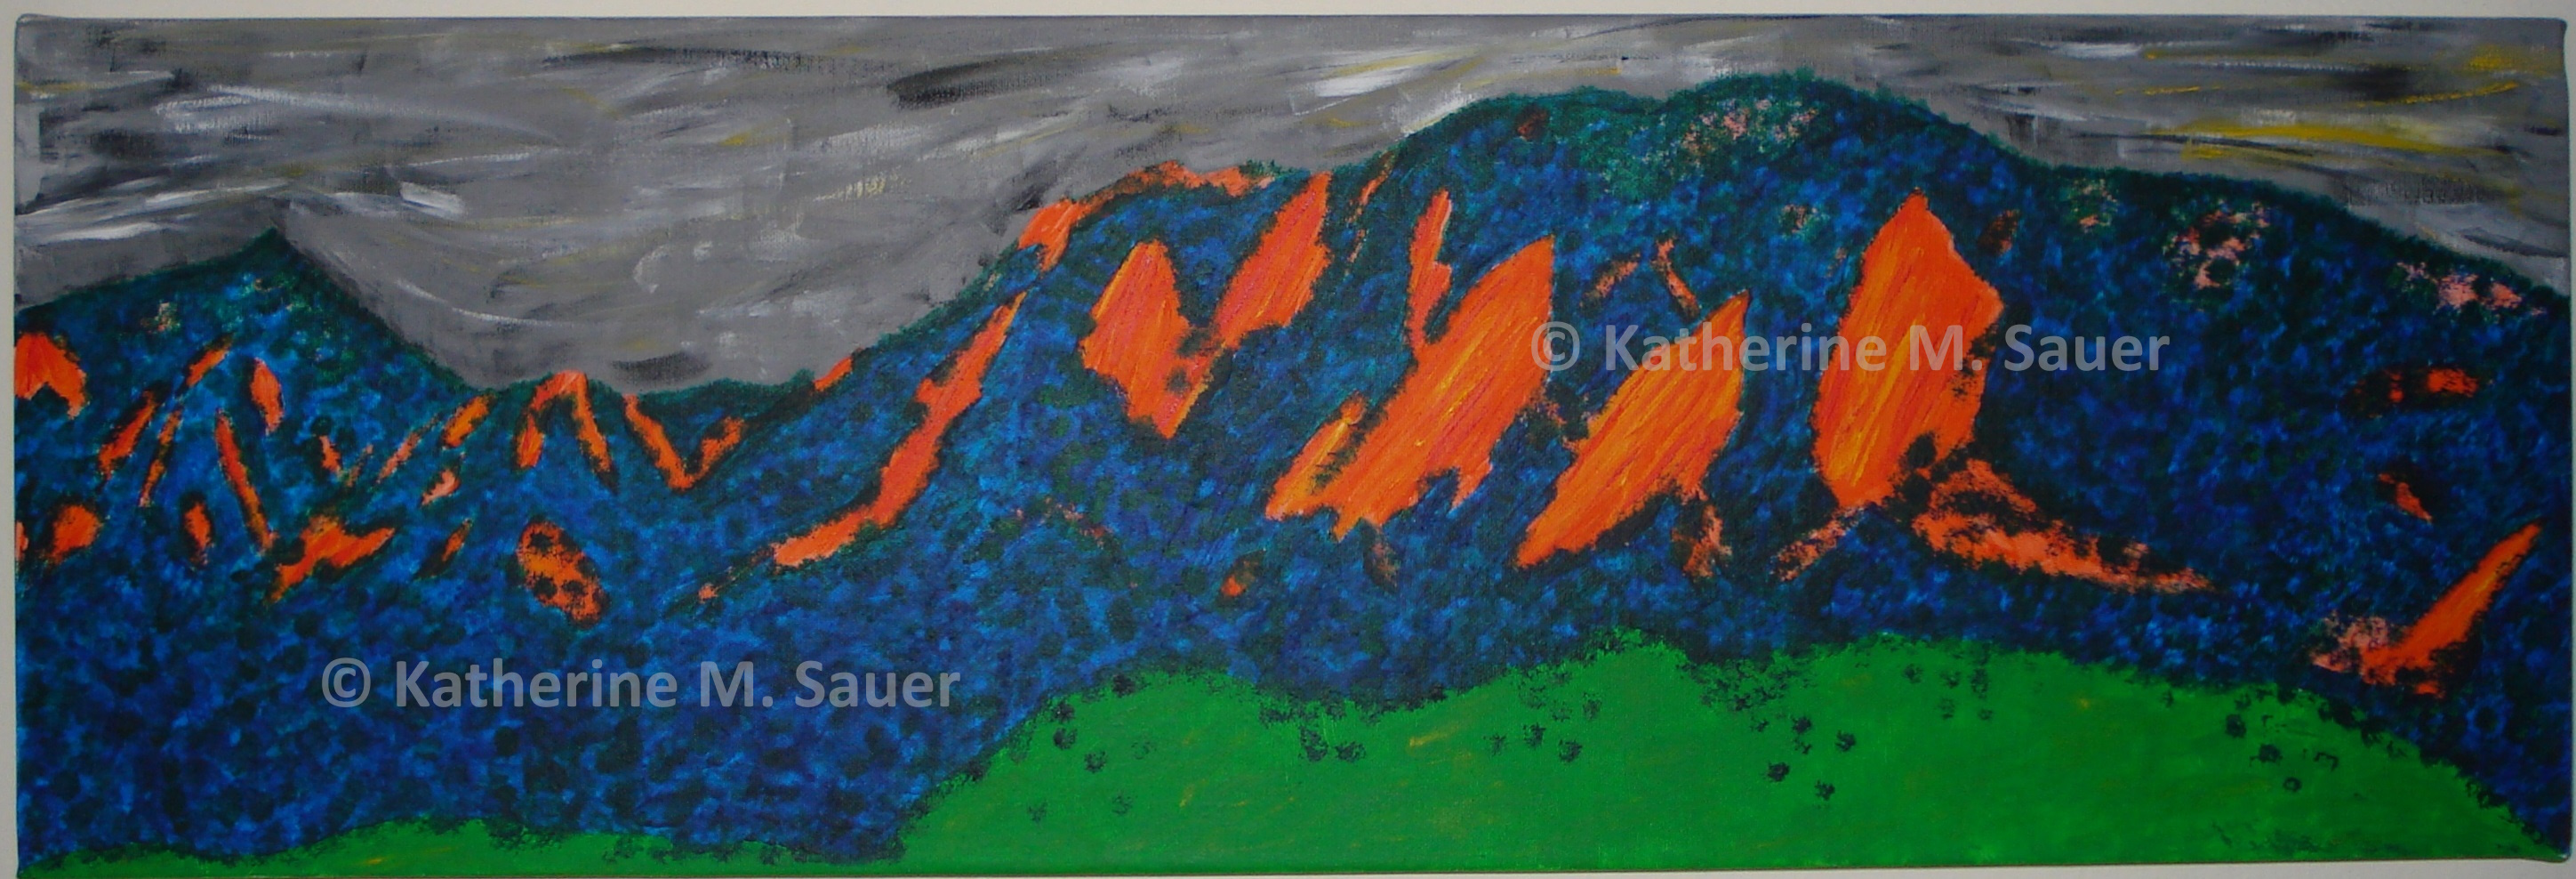
Flatirons | 36" x 12" | acrylic on canvas | 2010
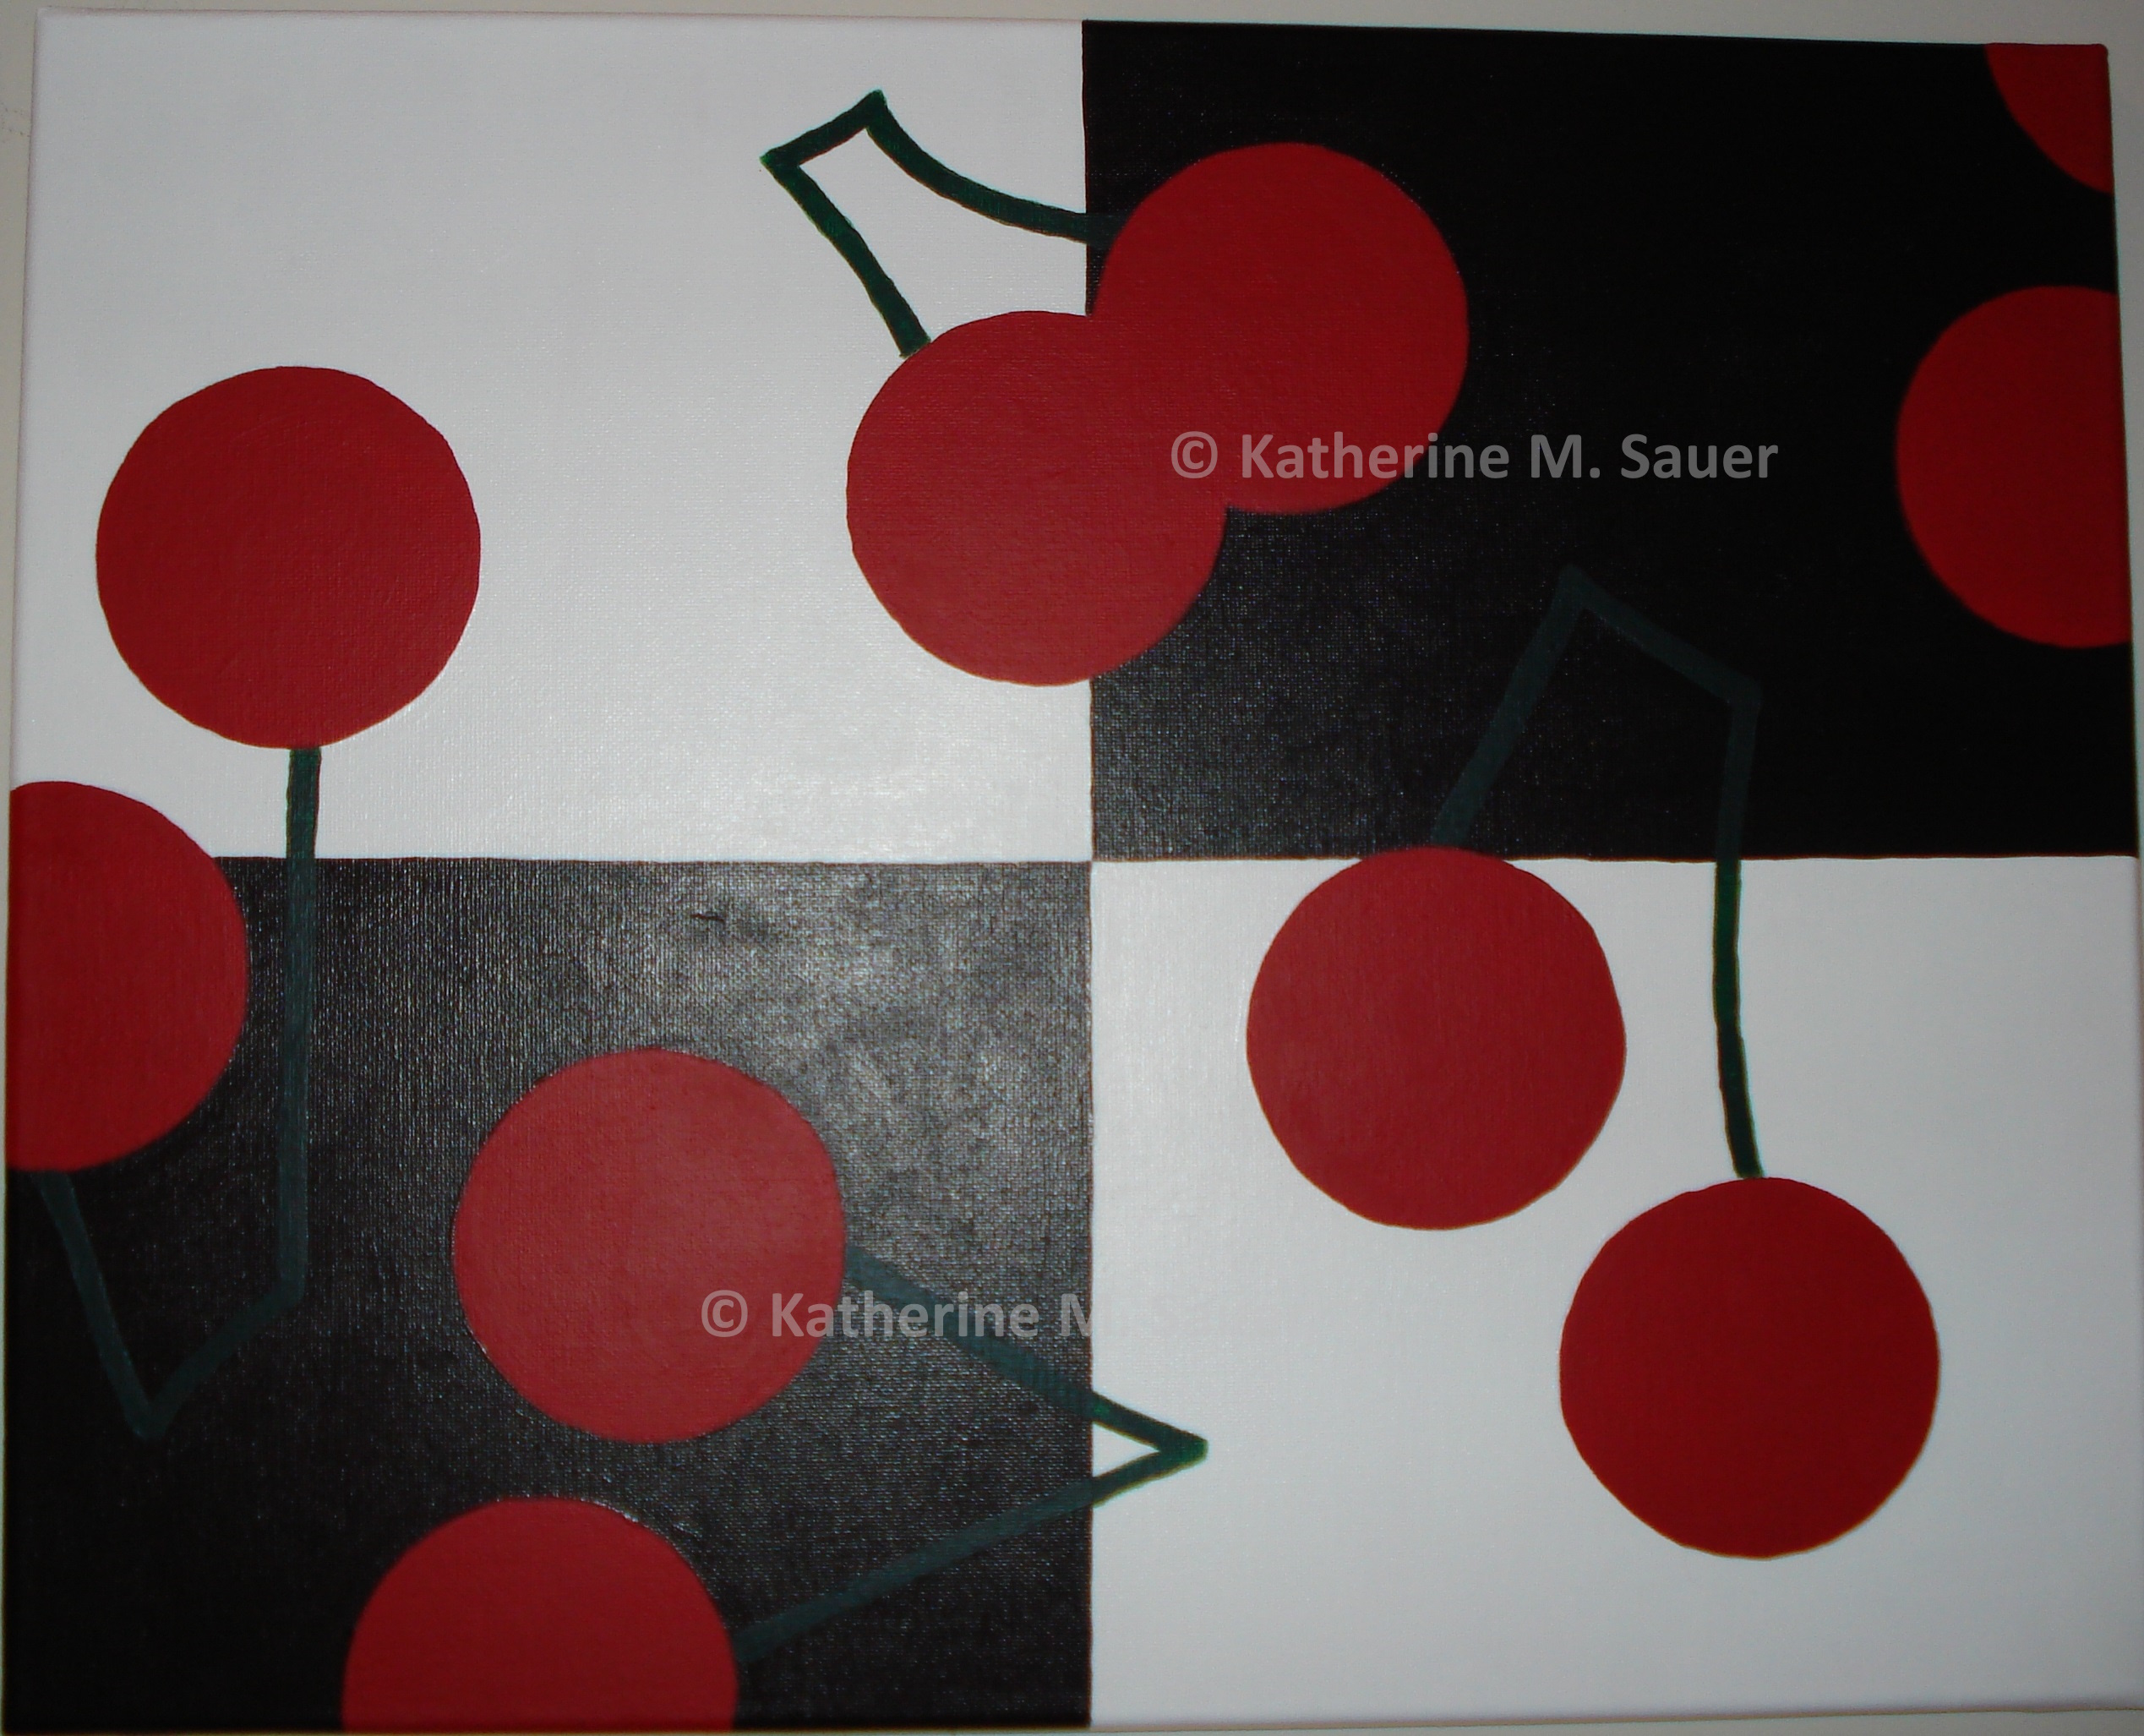
Cherries | 20" x 16" | acrylic on canvas | 2006
Labyrinth | 20" x 16" | acrylic on canvas | 2006


The pop-up exhibition showcased thirteen new pieces, each juxtaposing traditional economics with “feminine” treatments such as colors, ruffles, and home crafts.