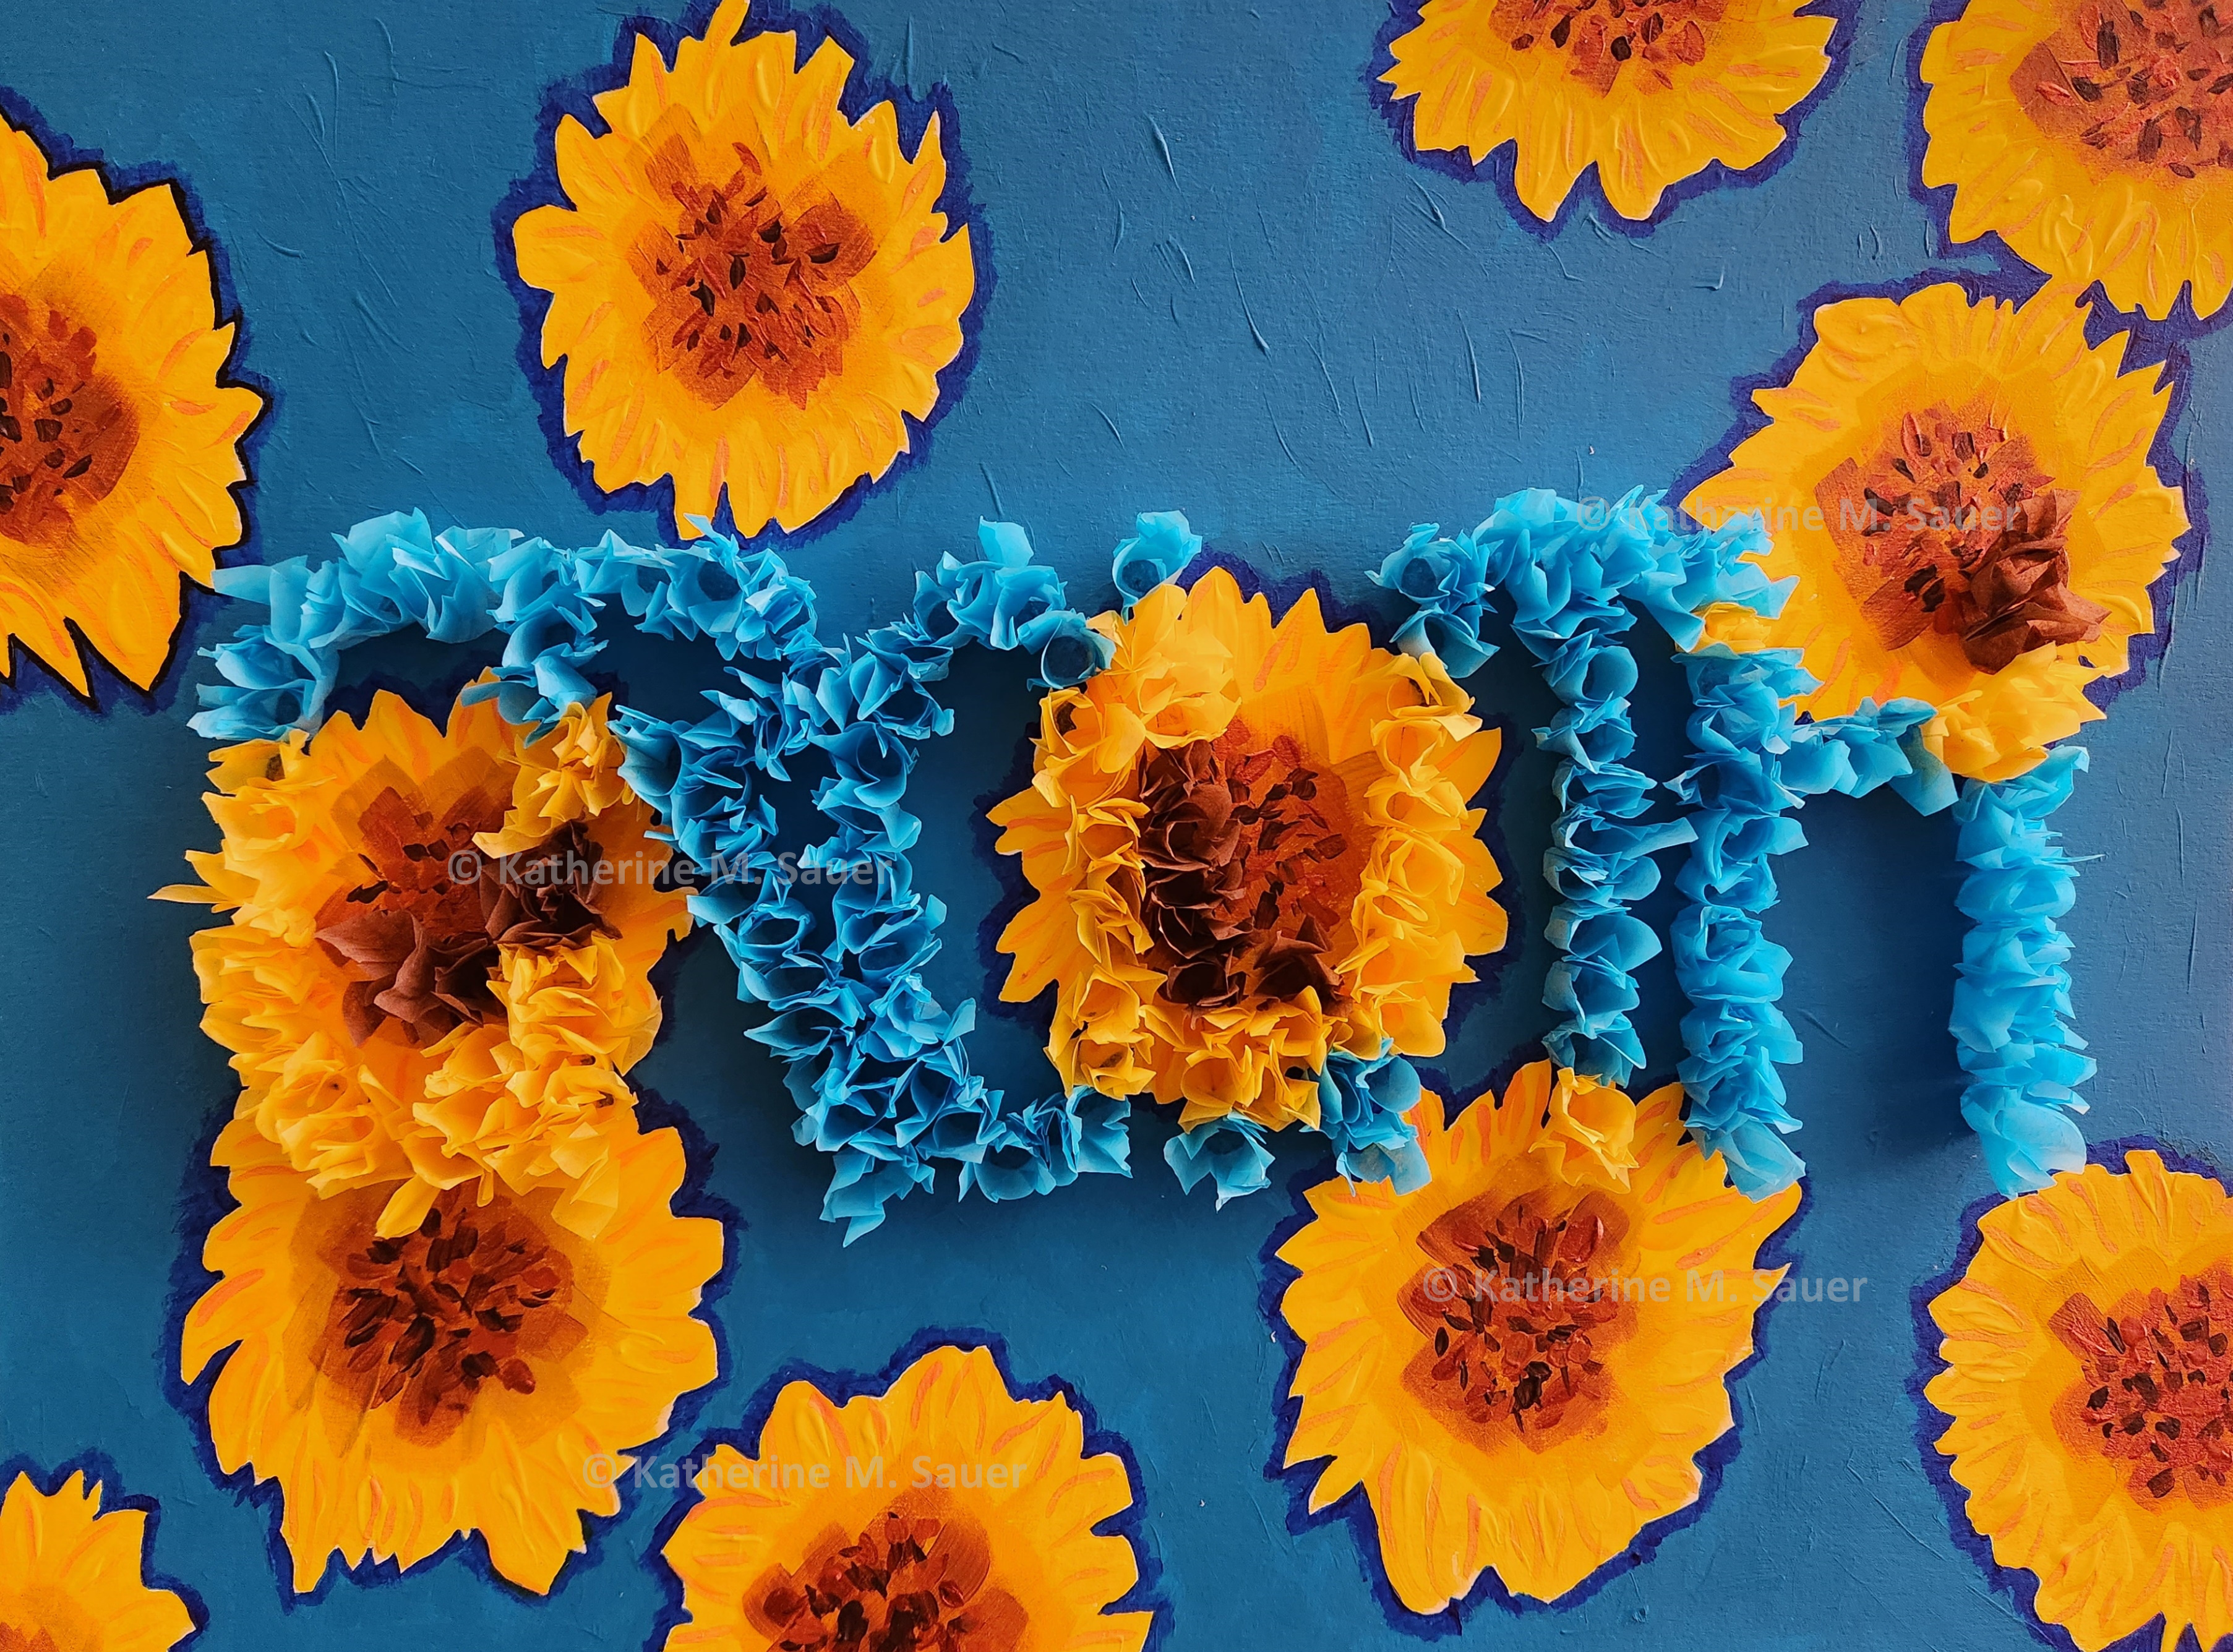
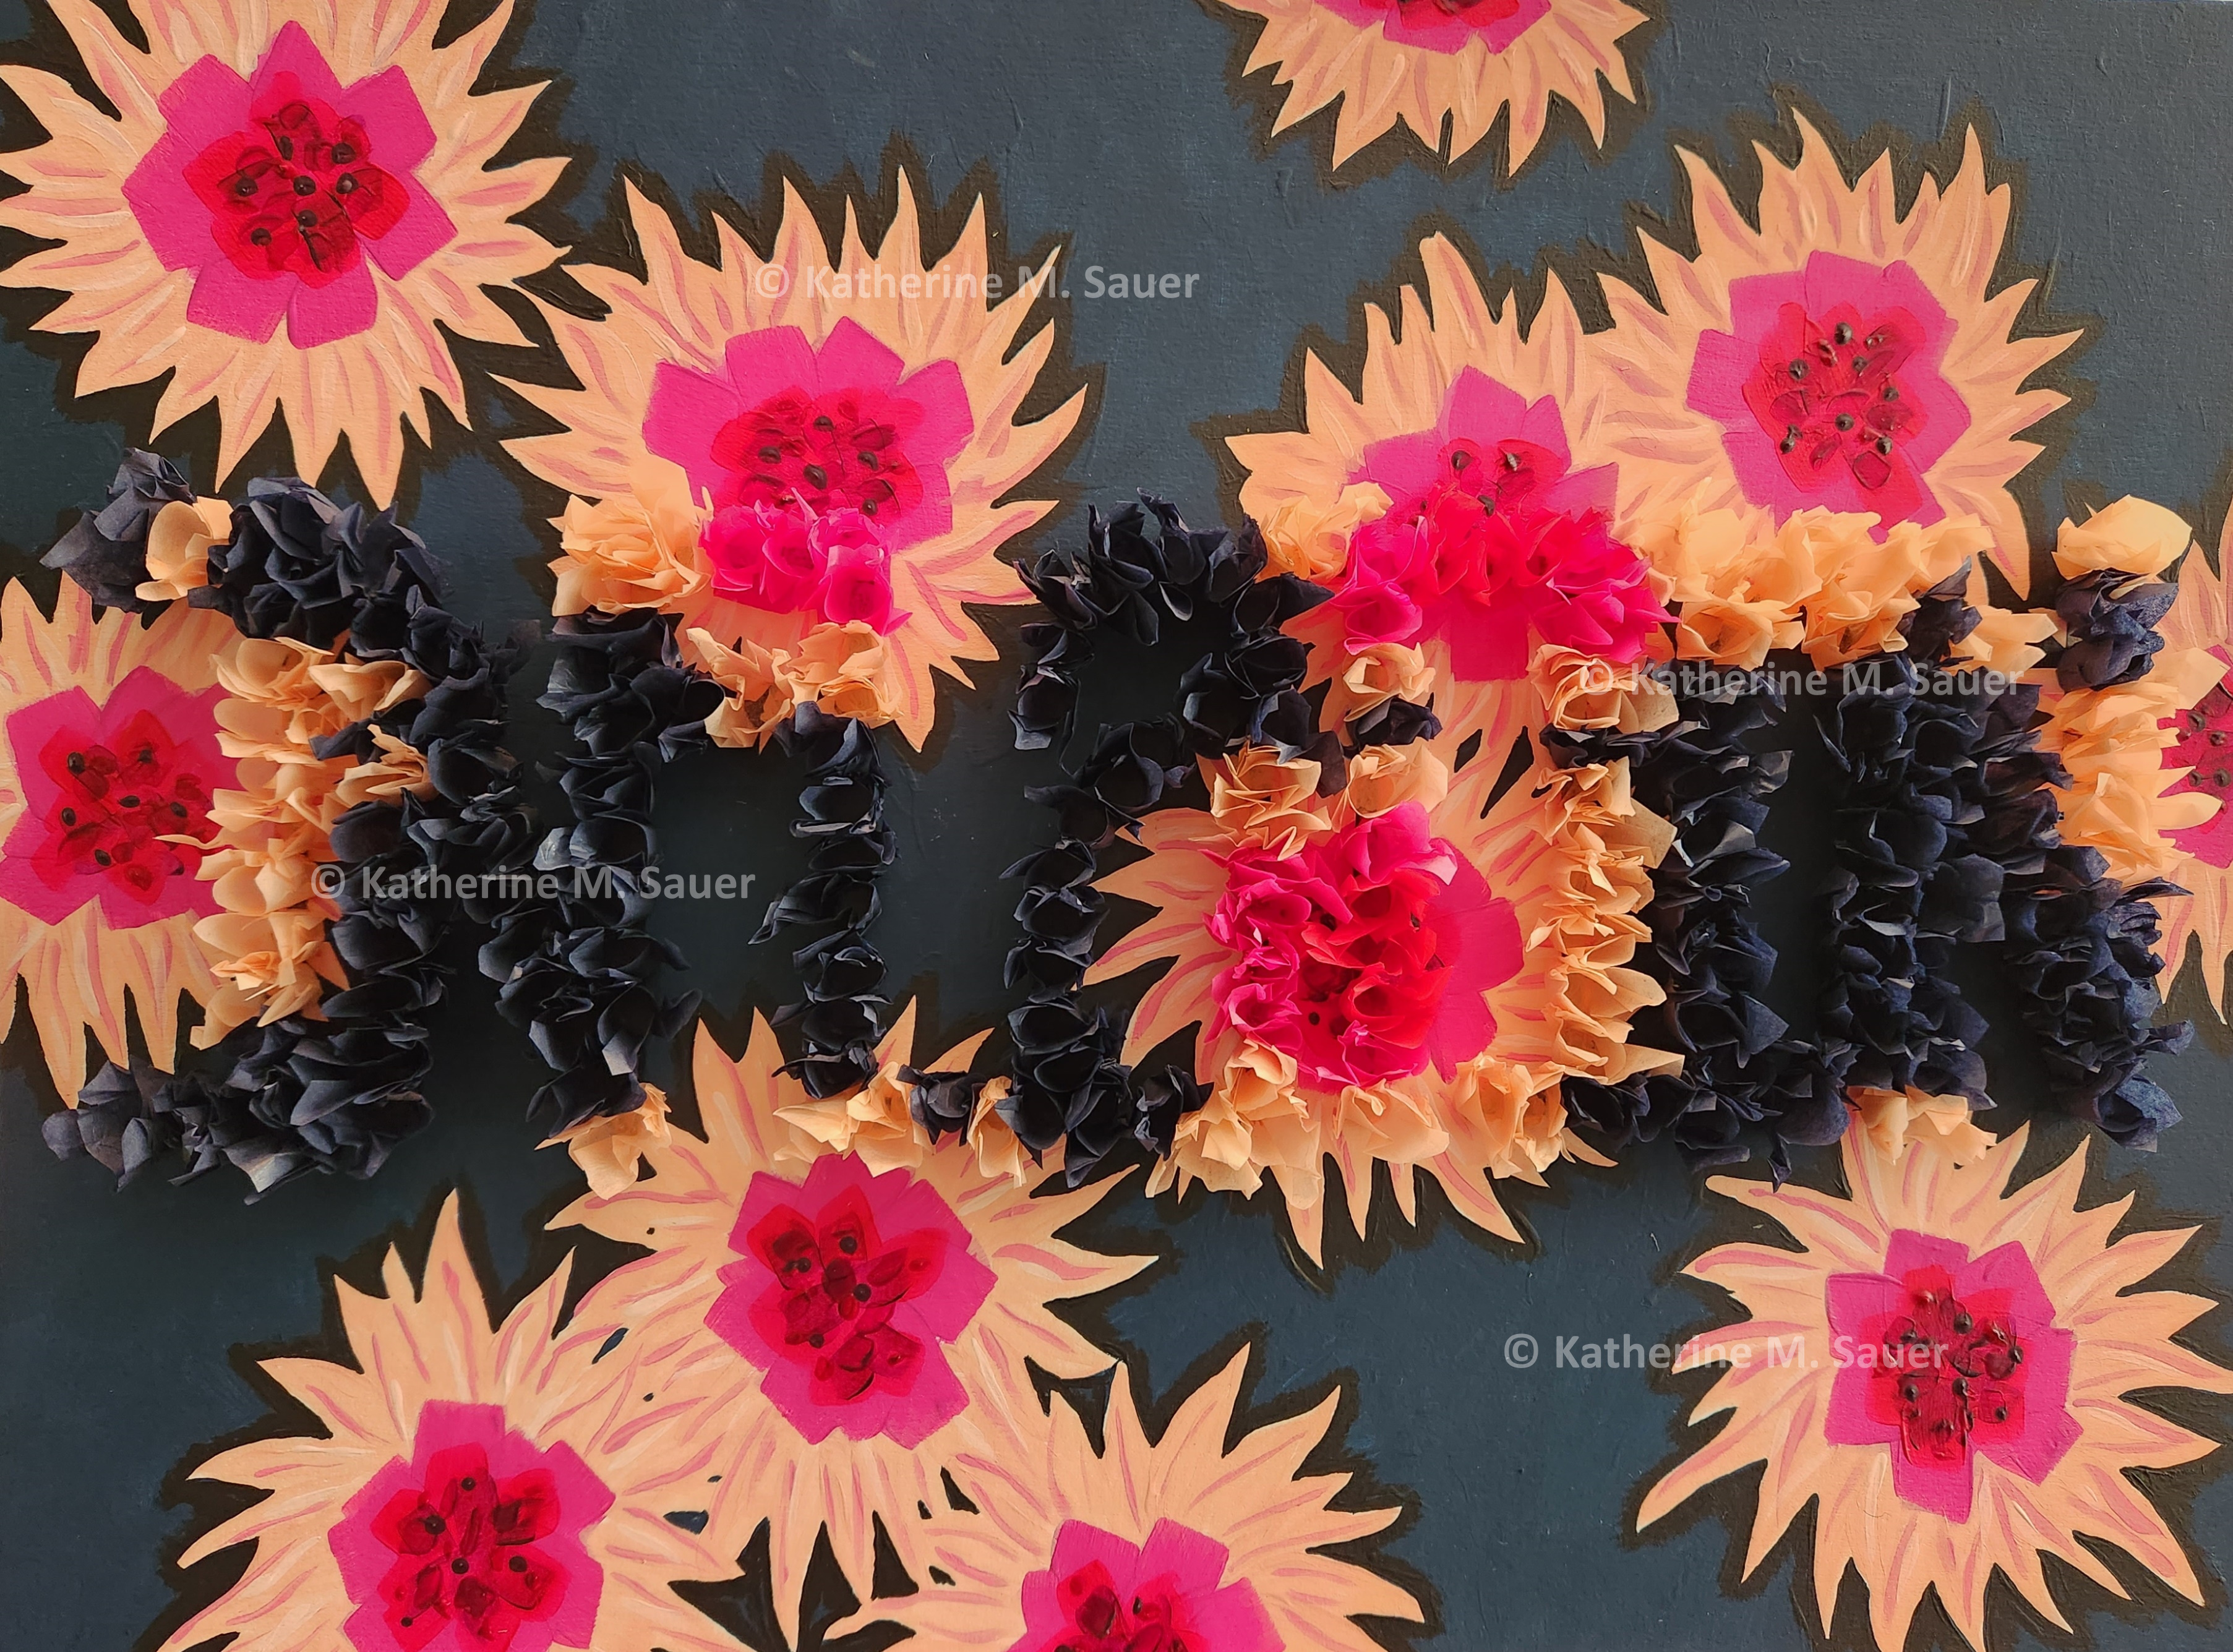
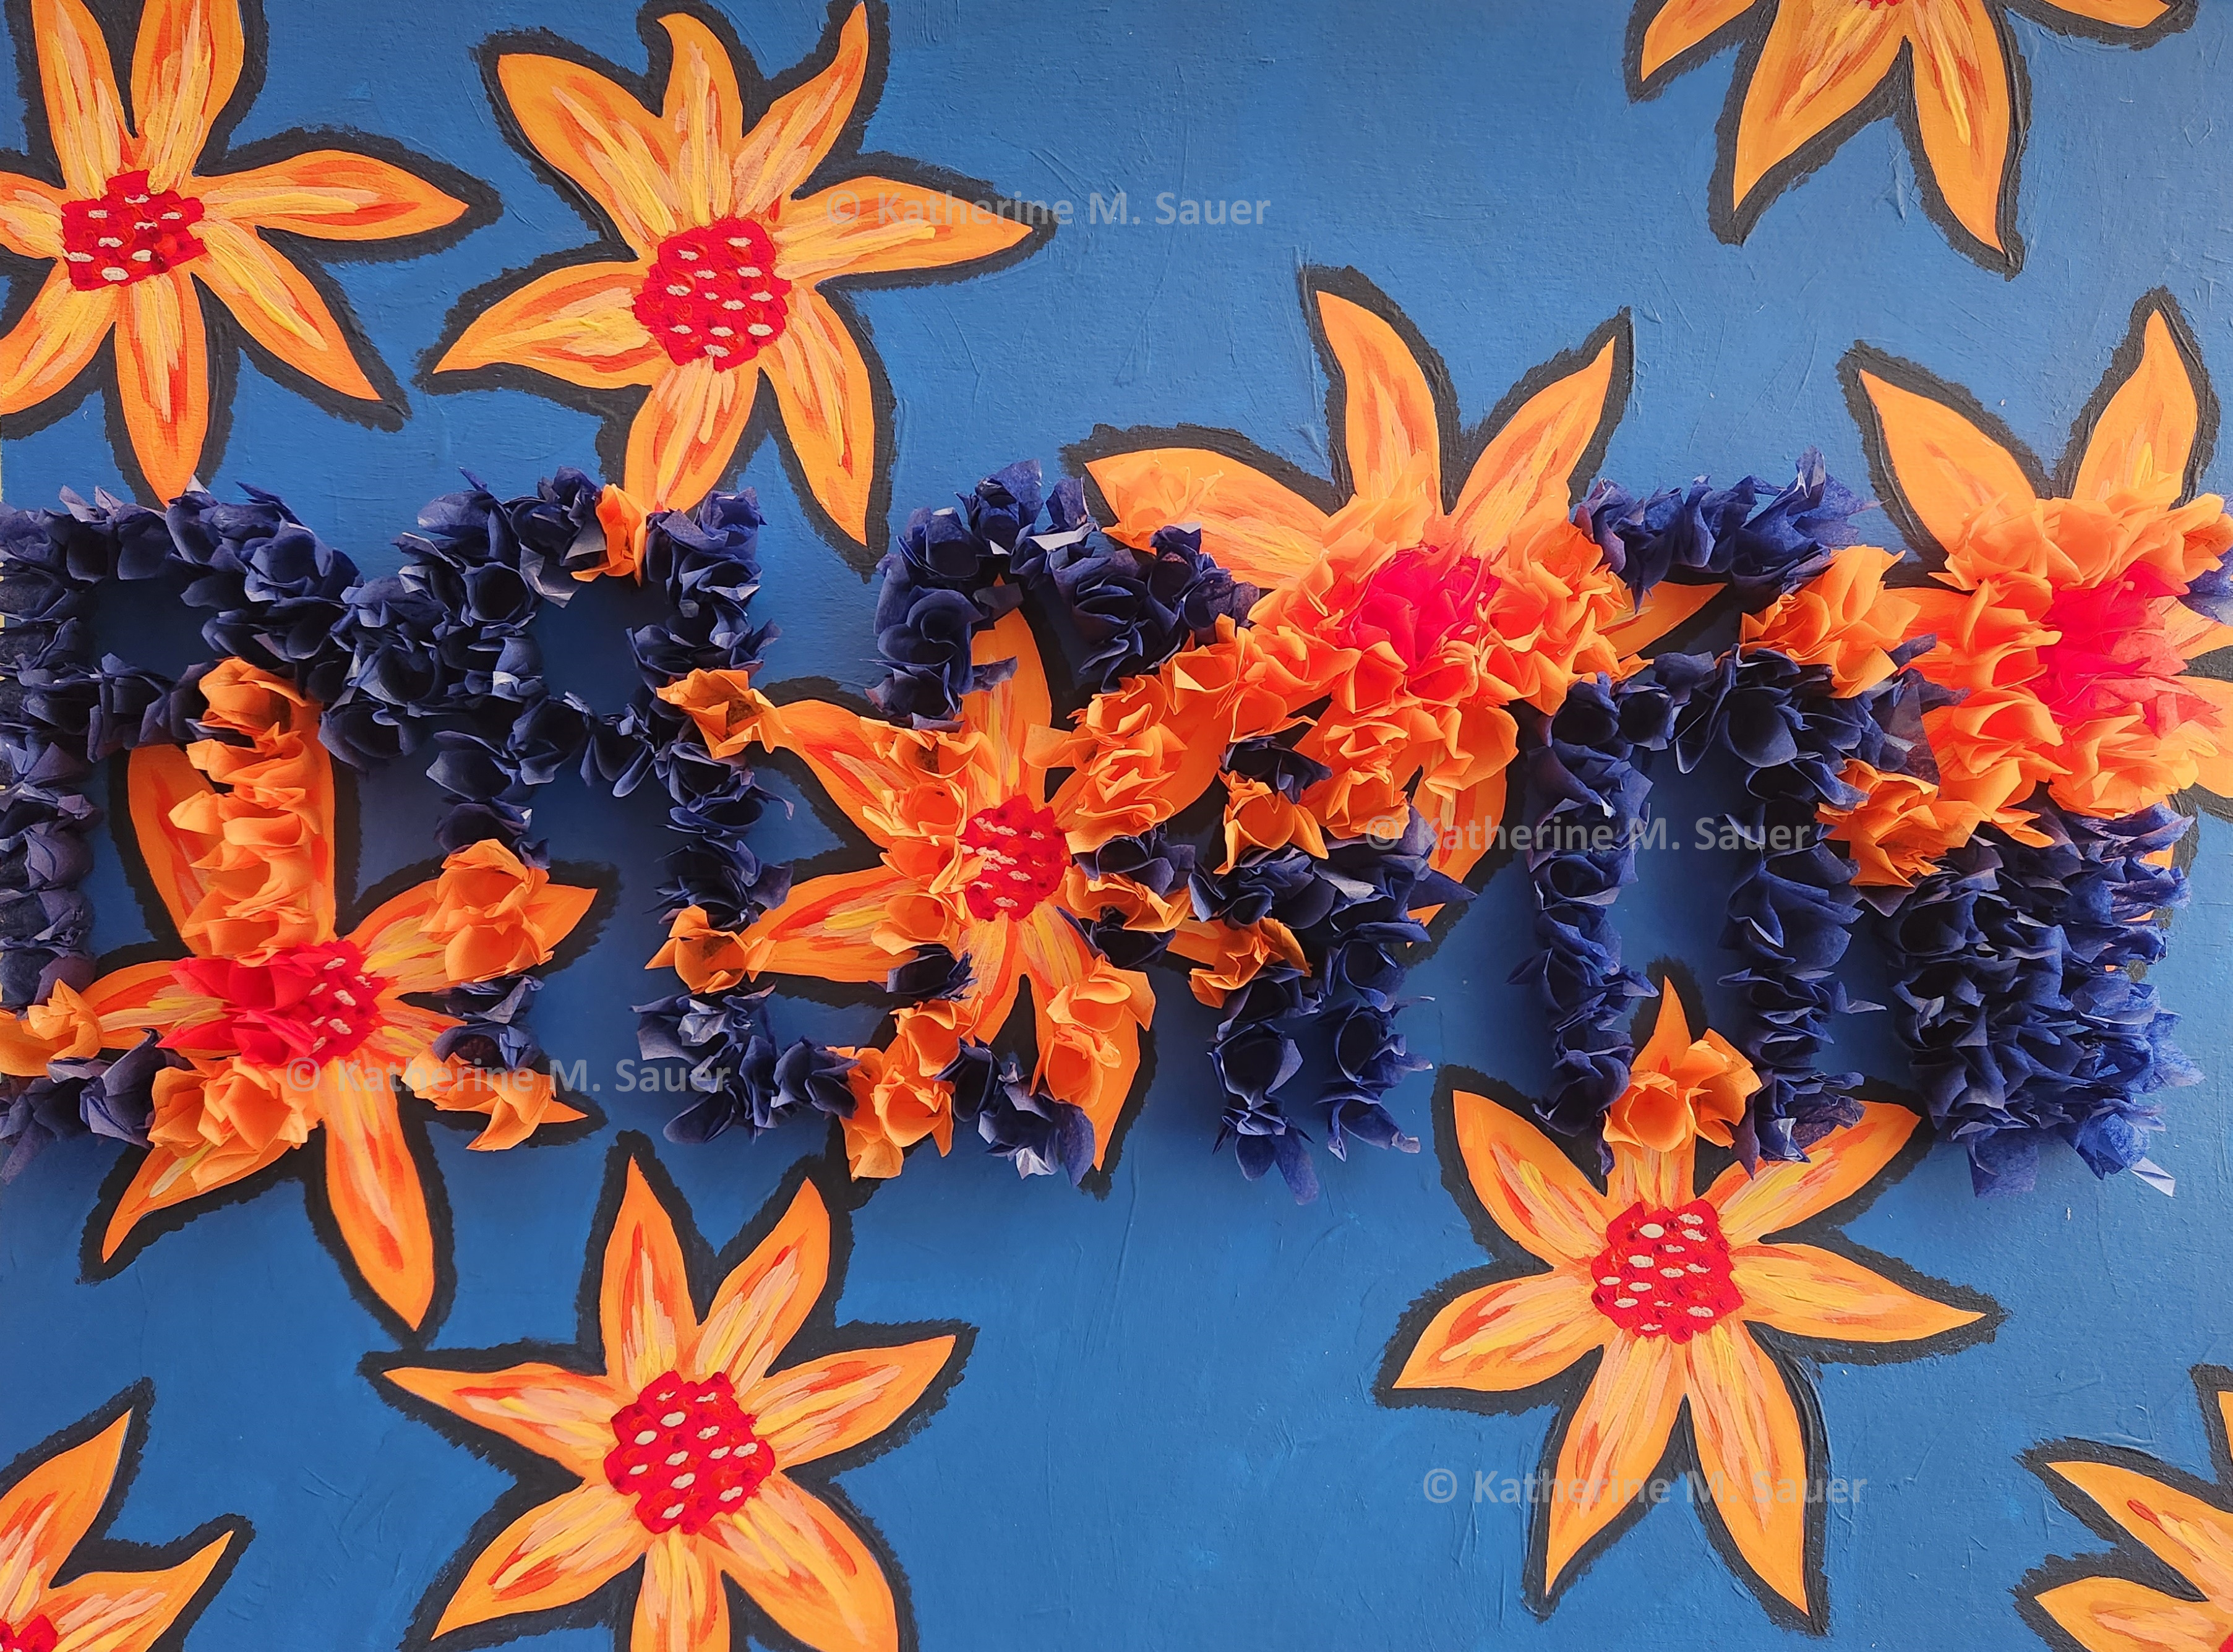
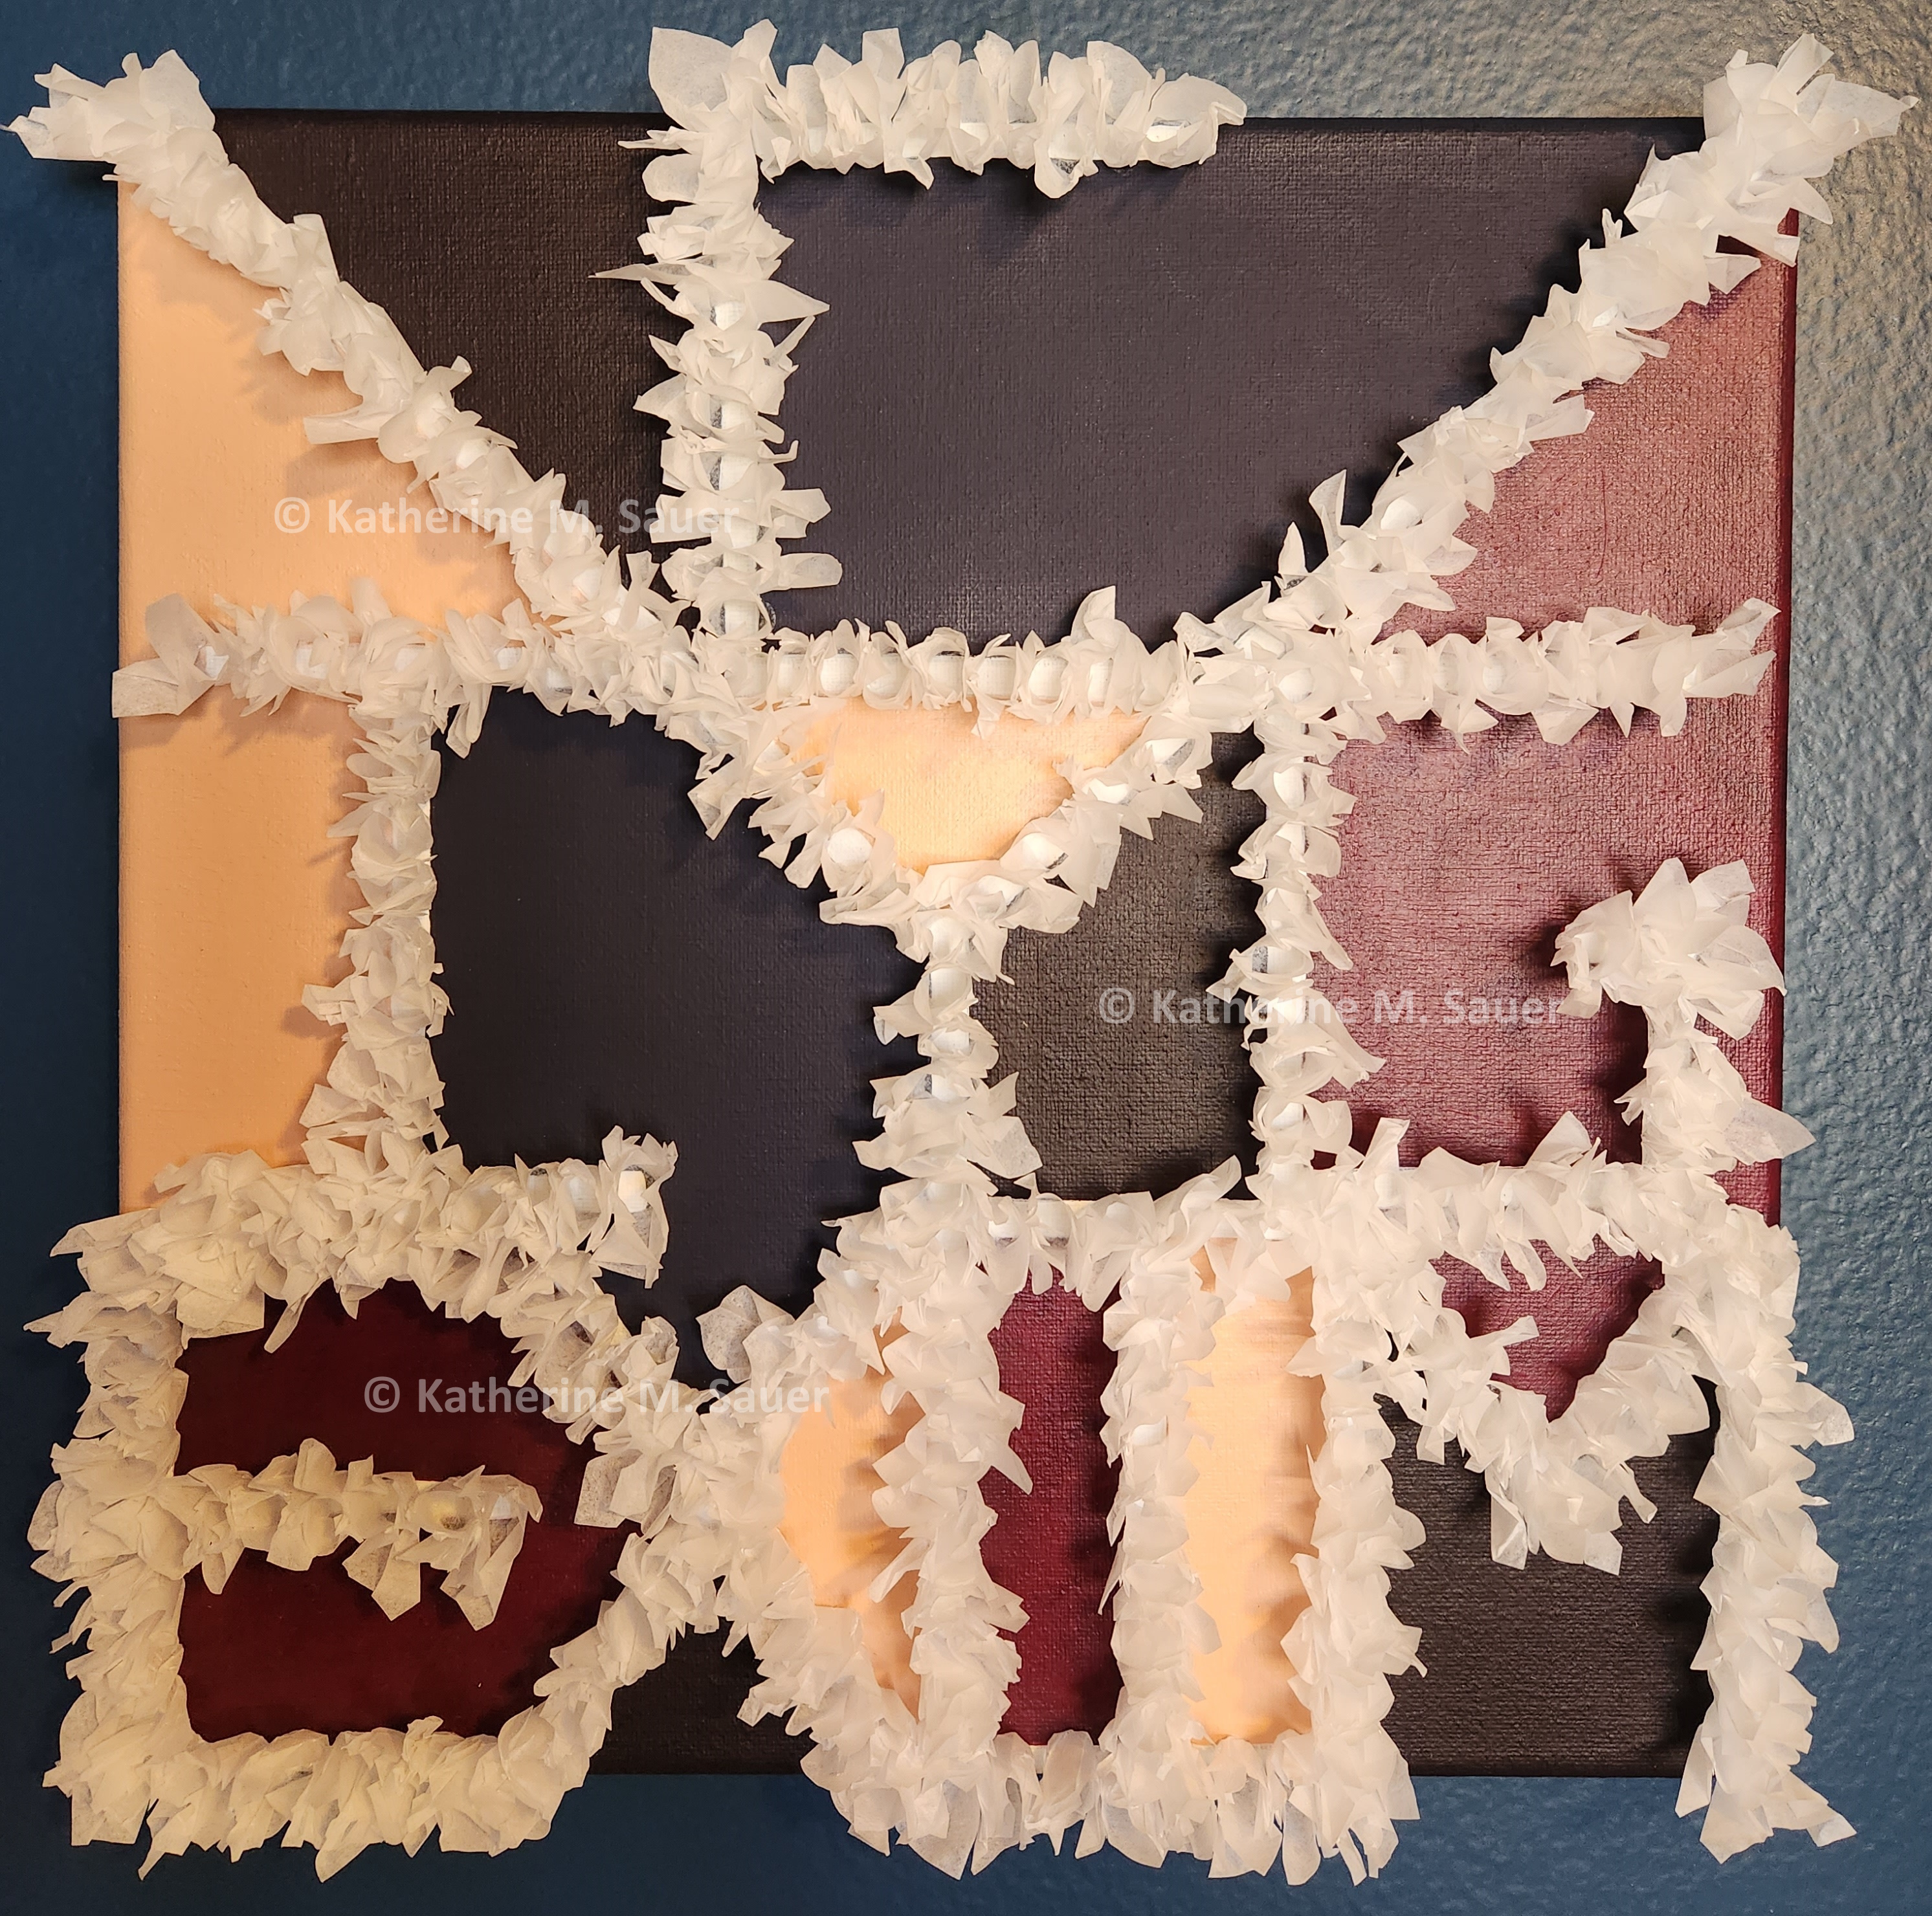
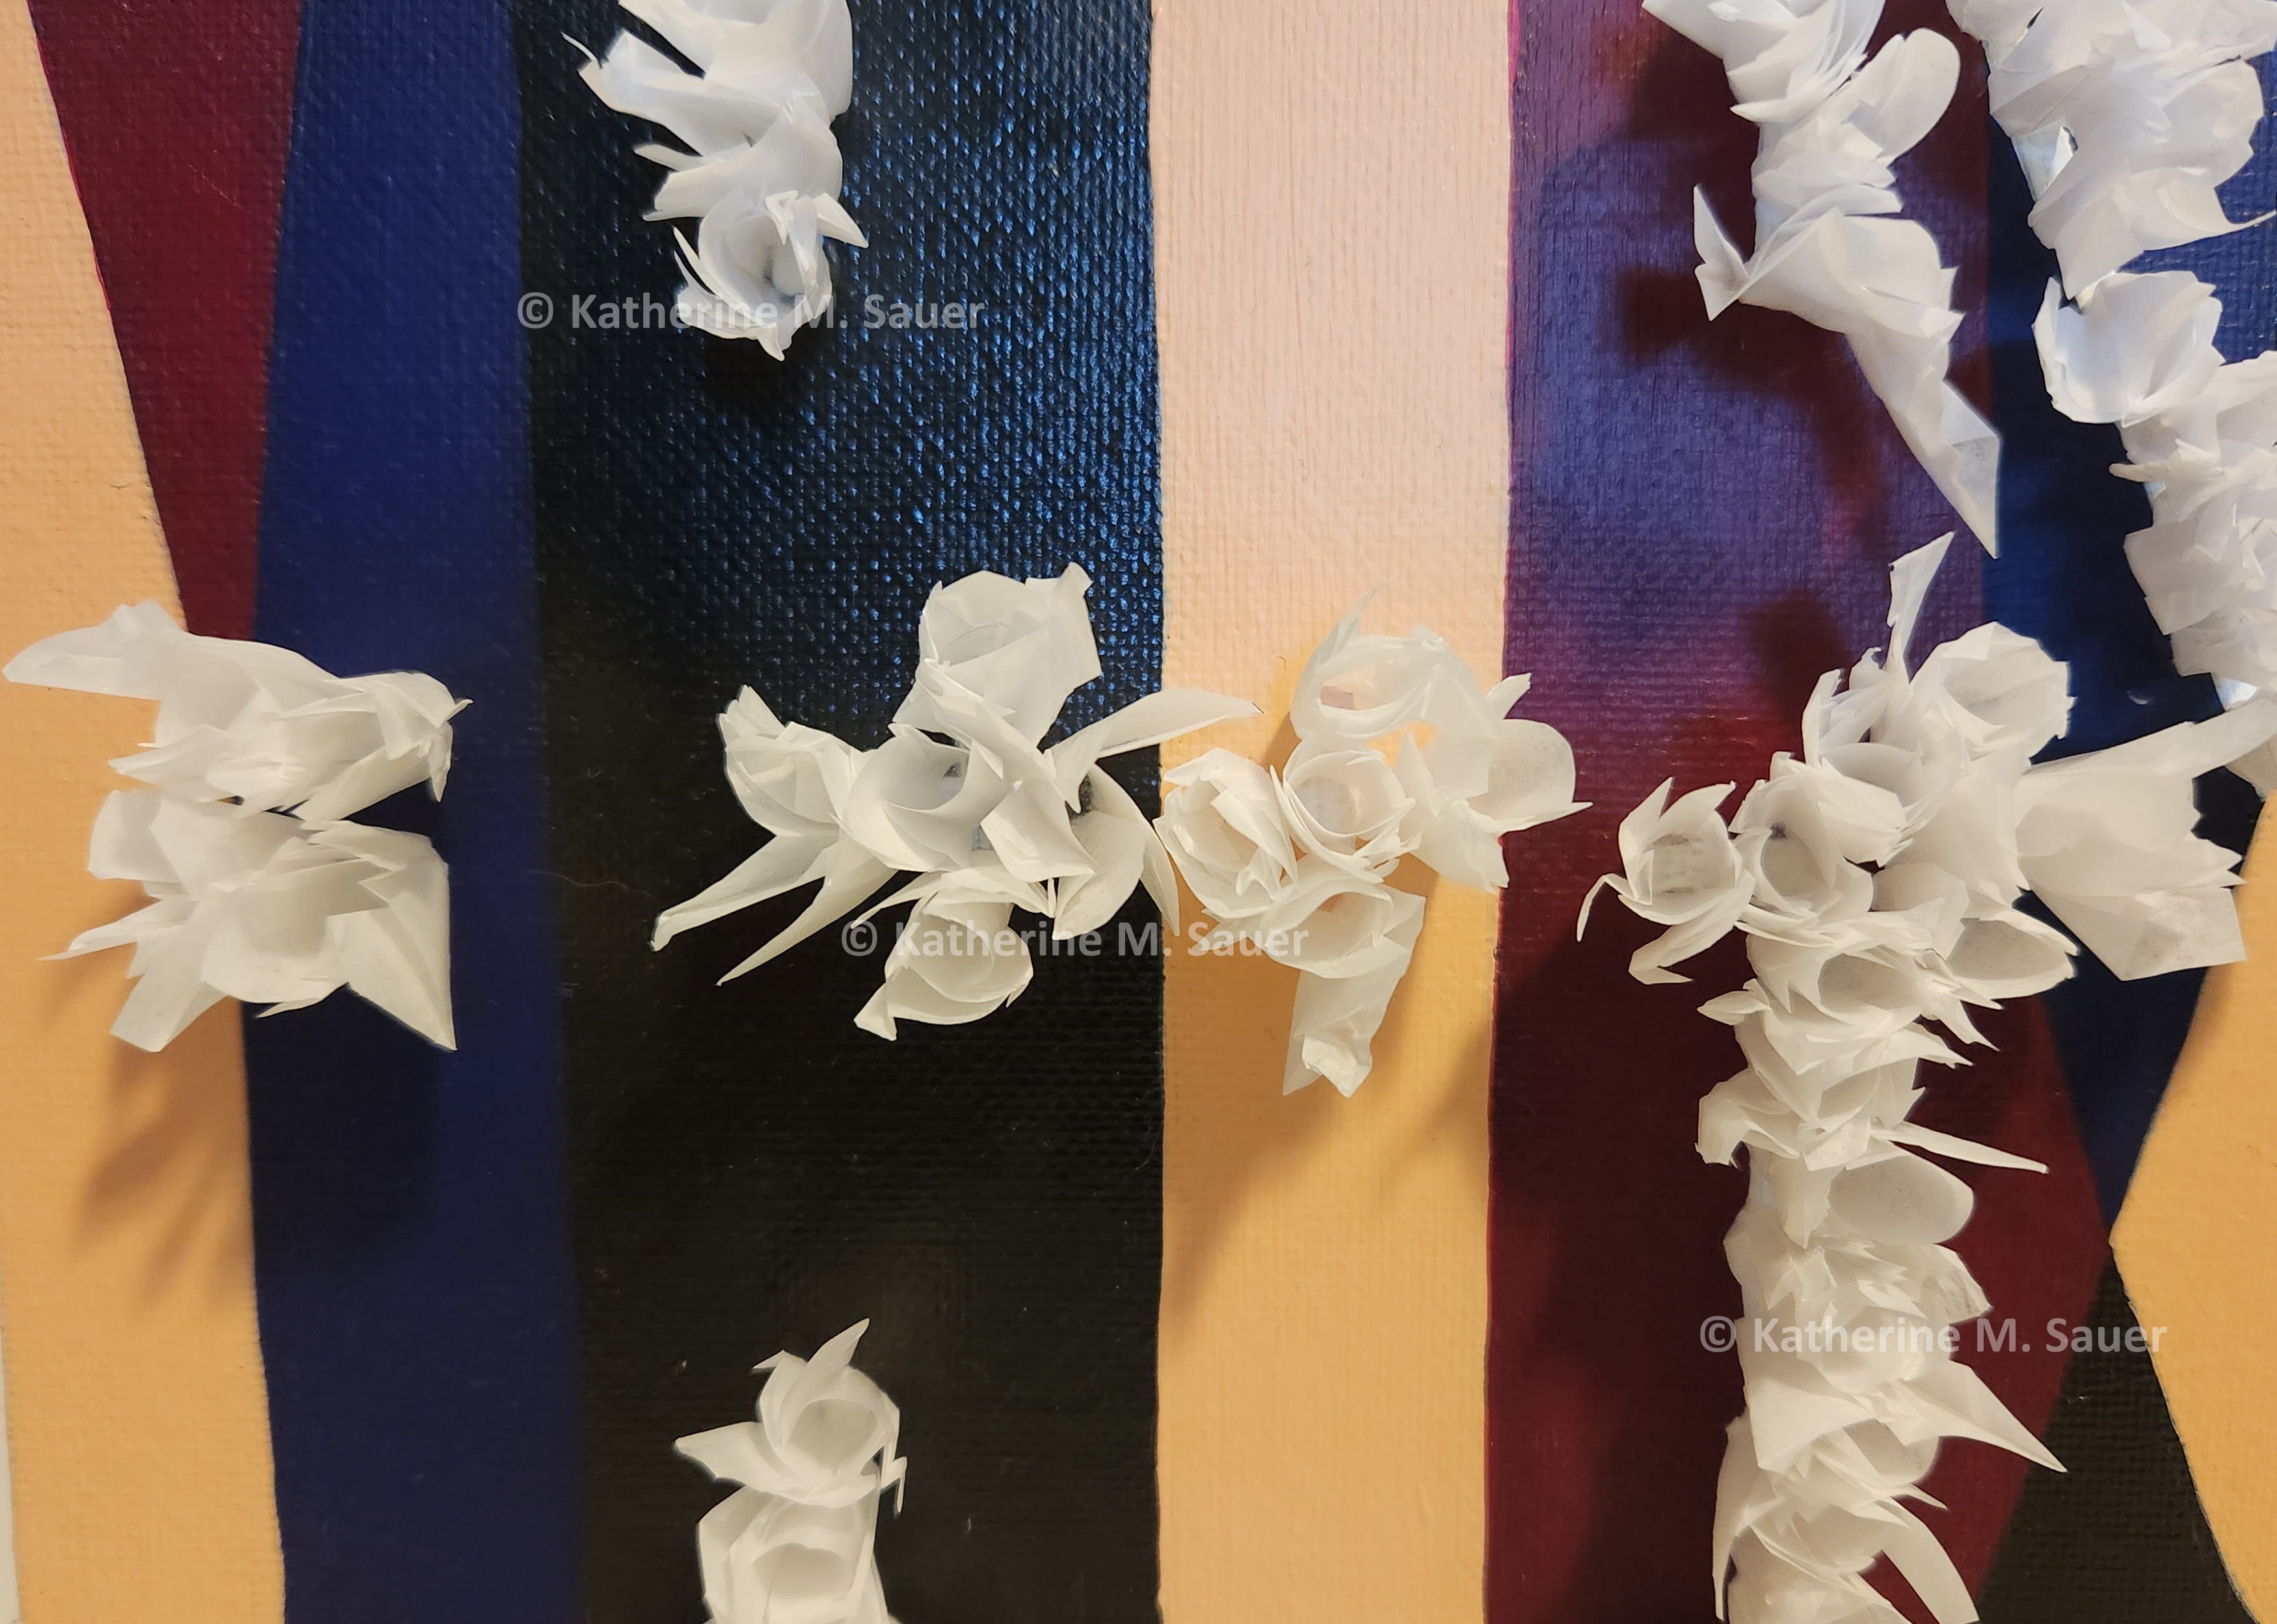
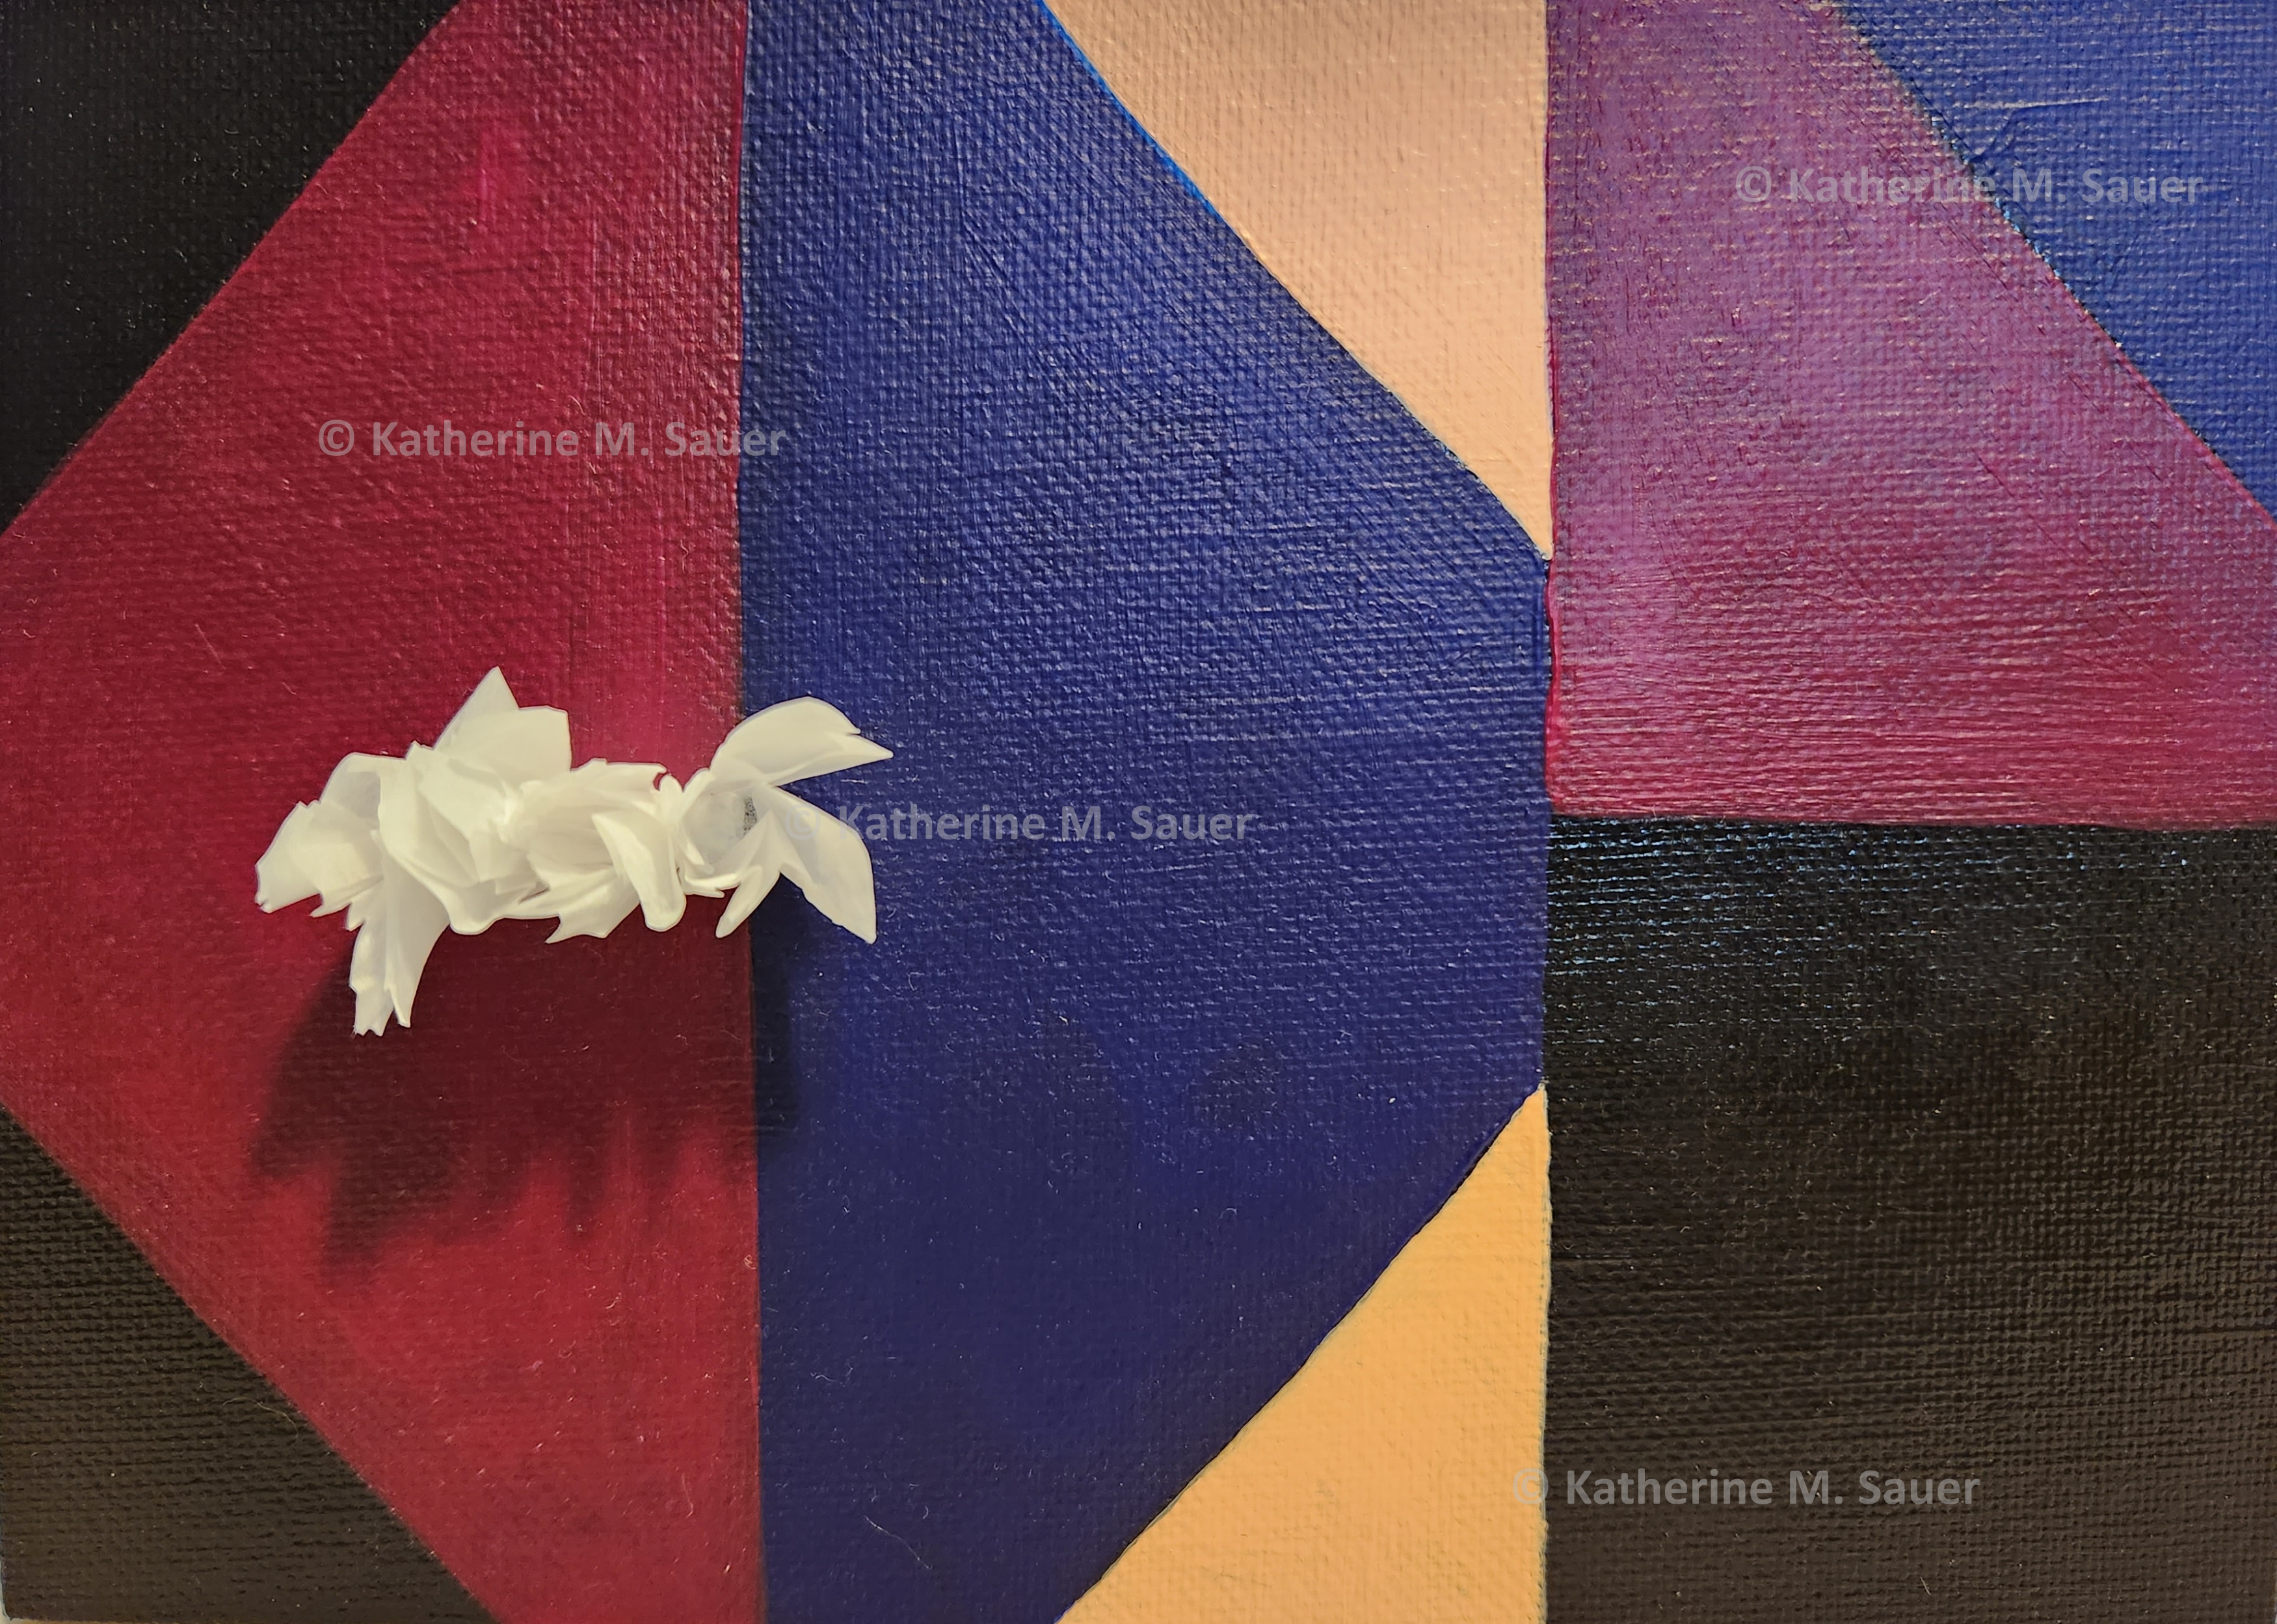
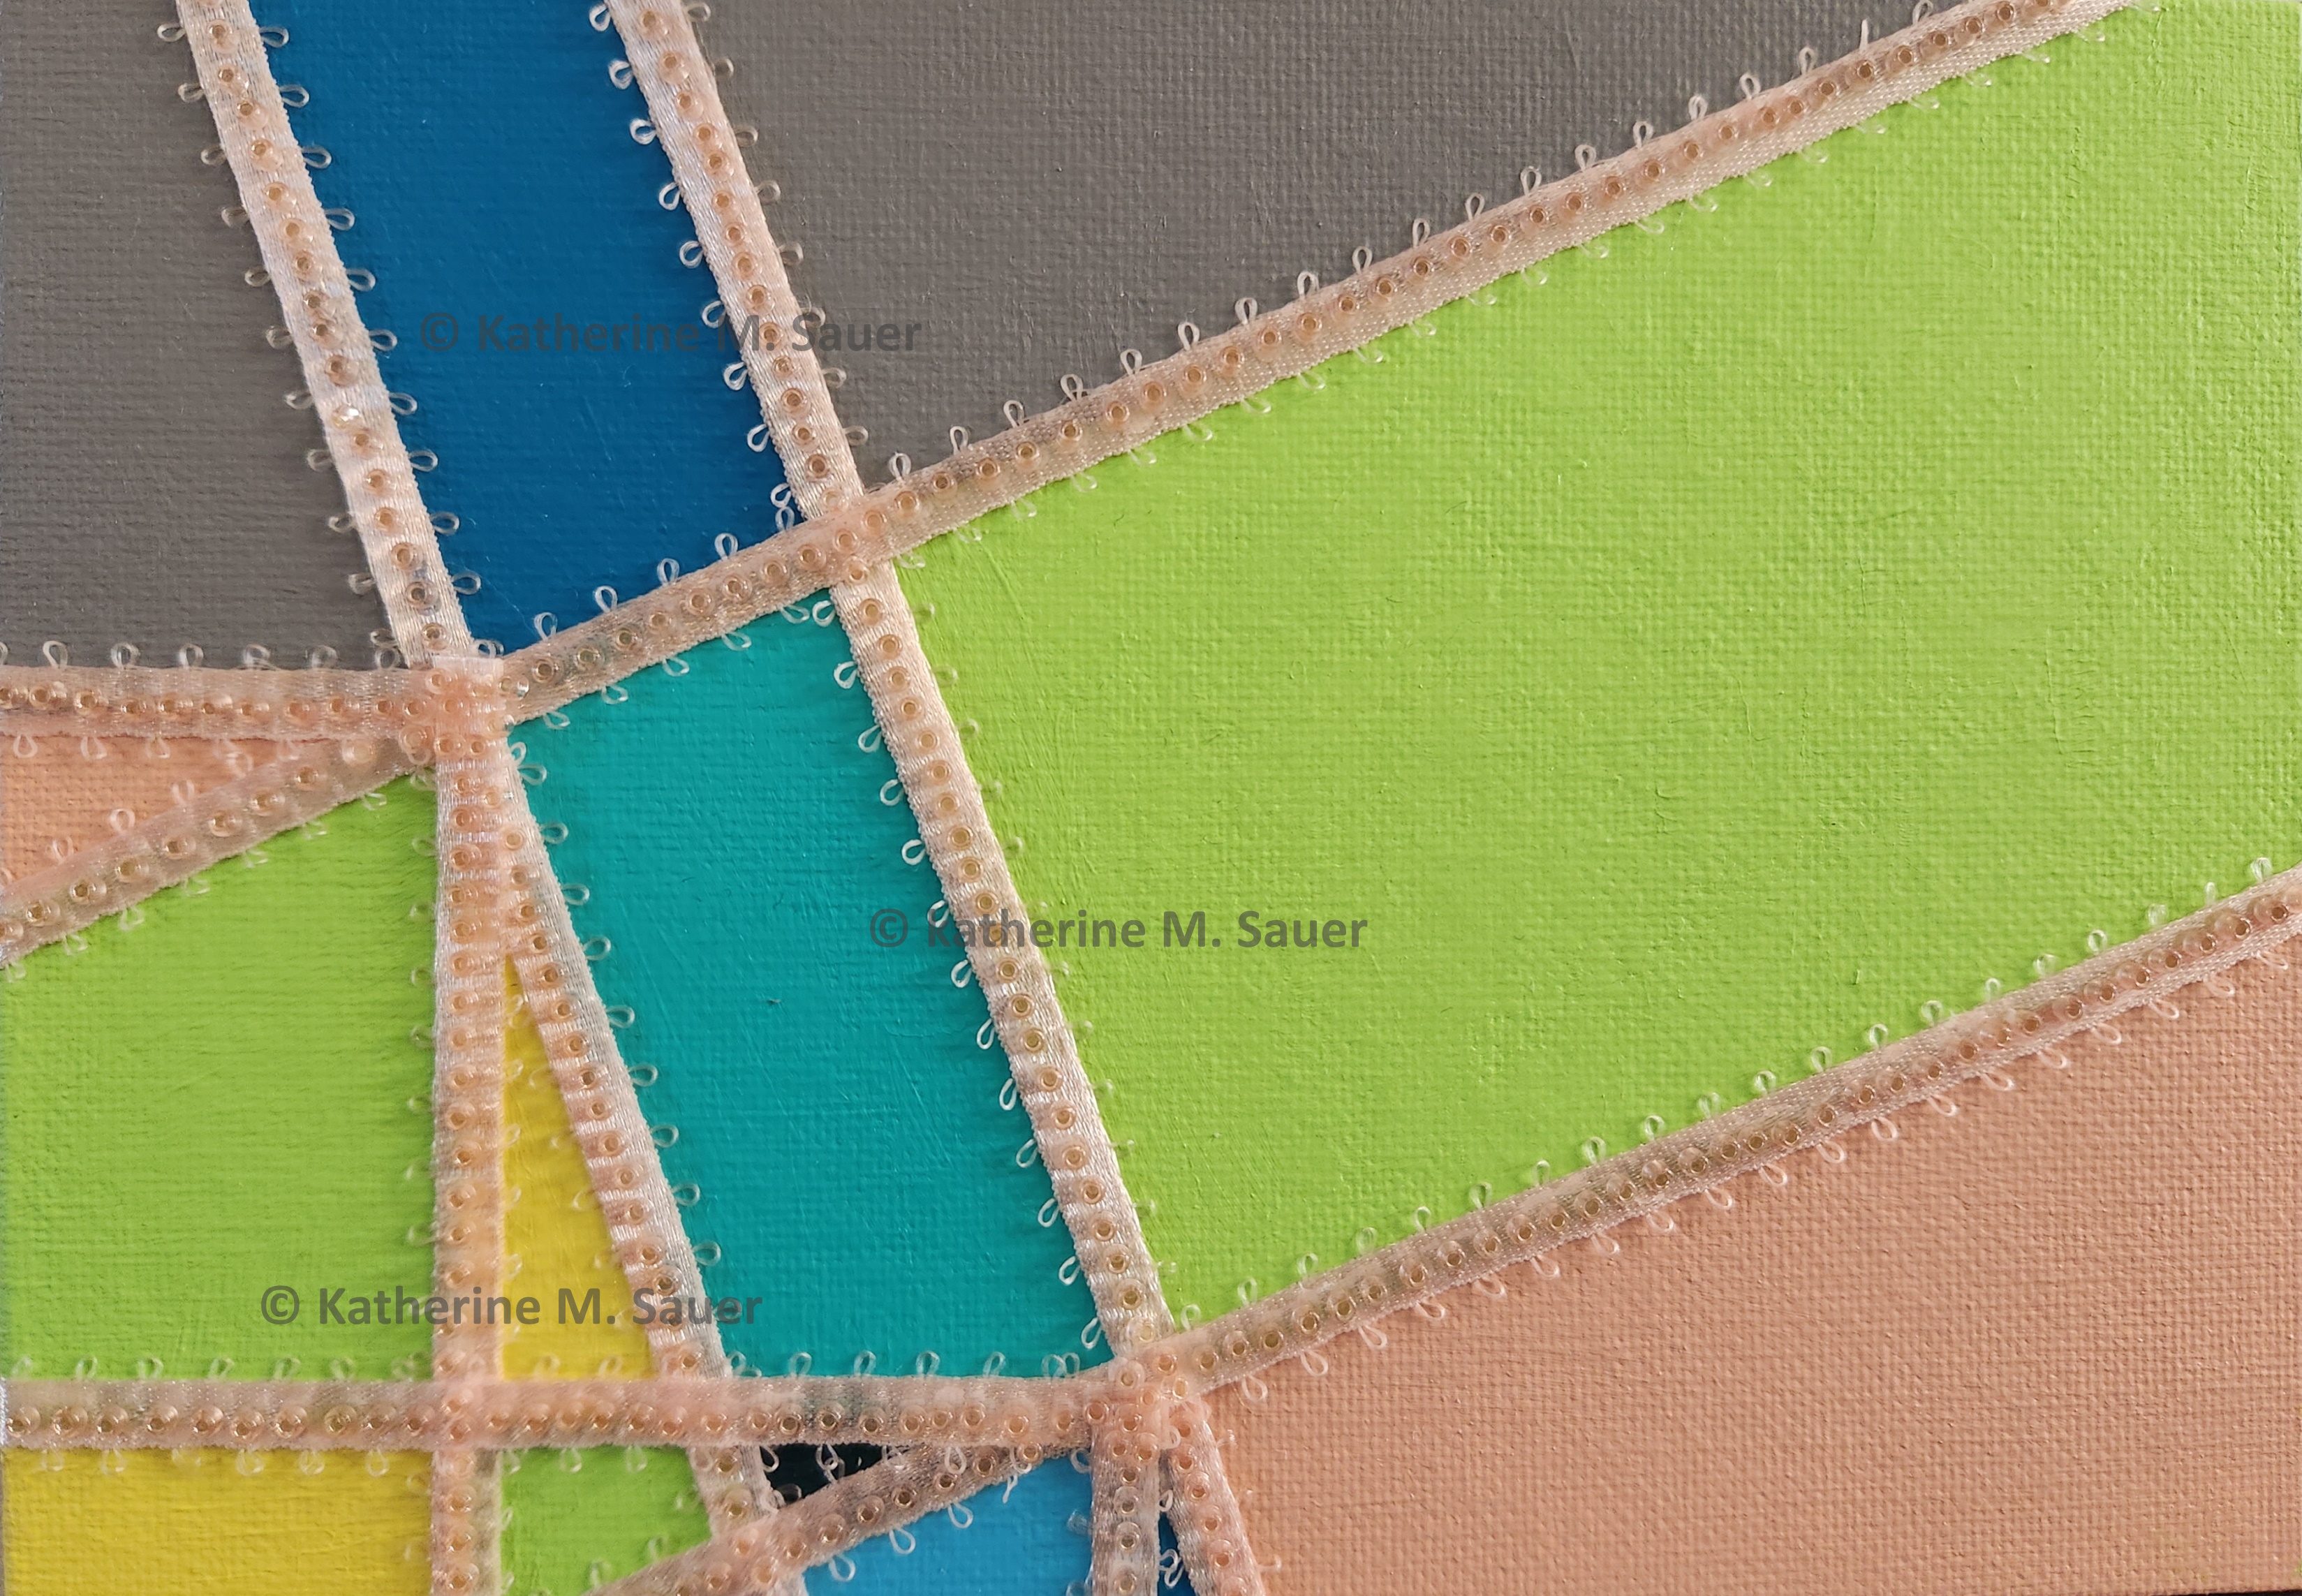
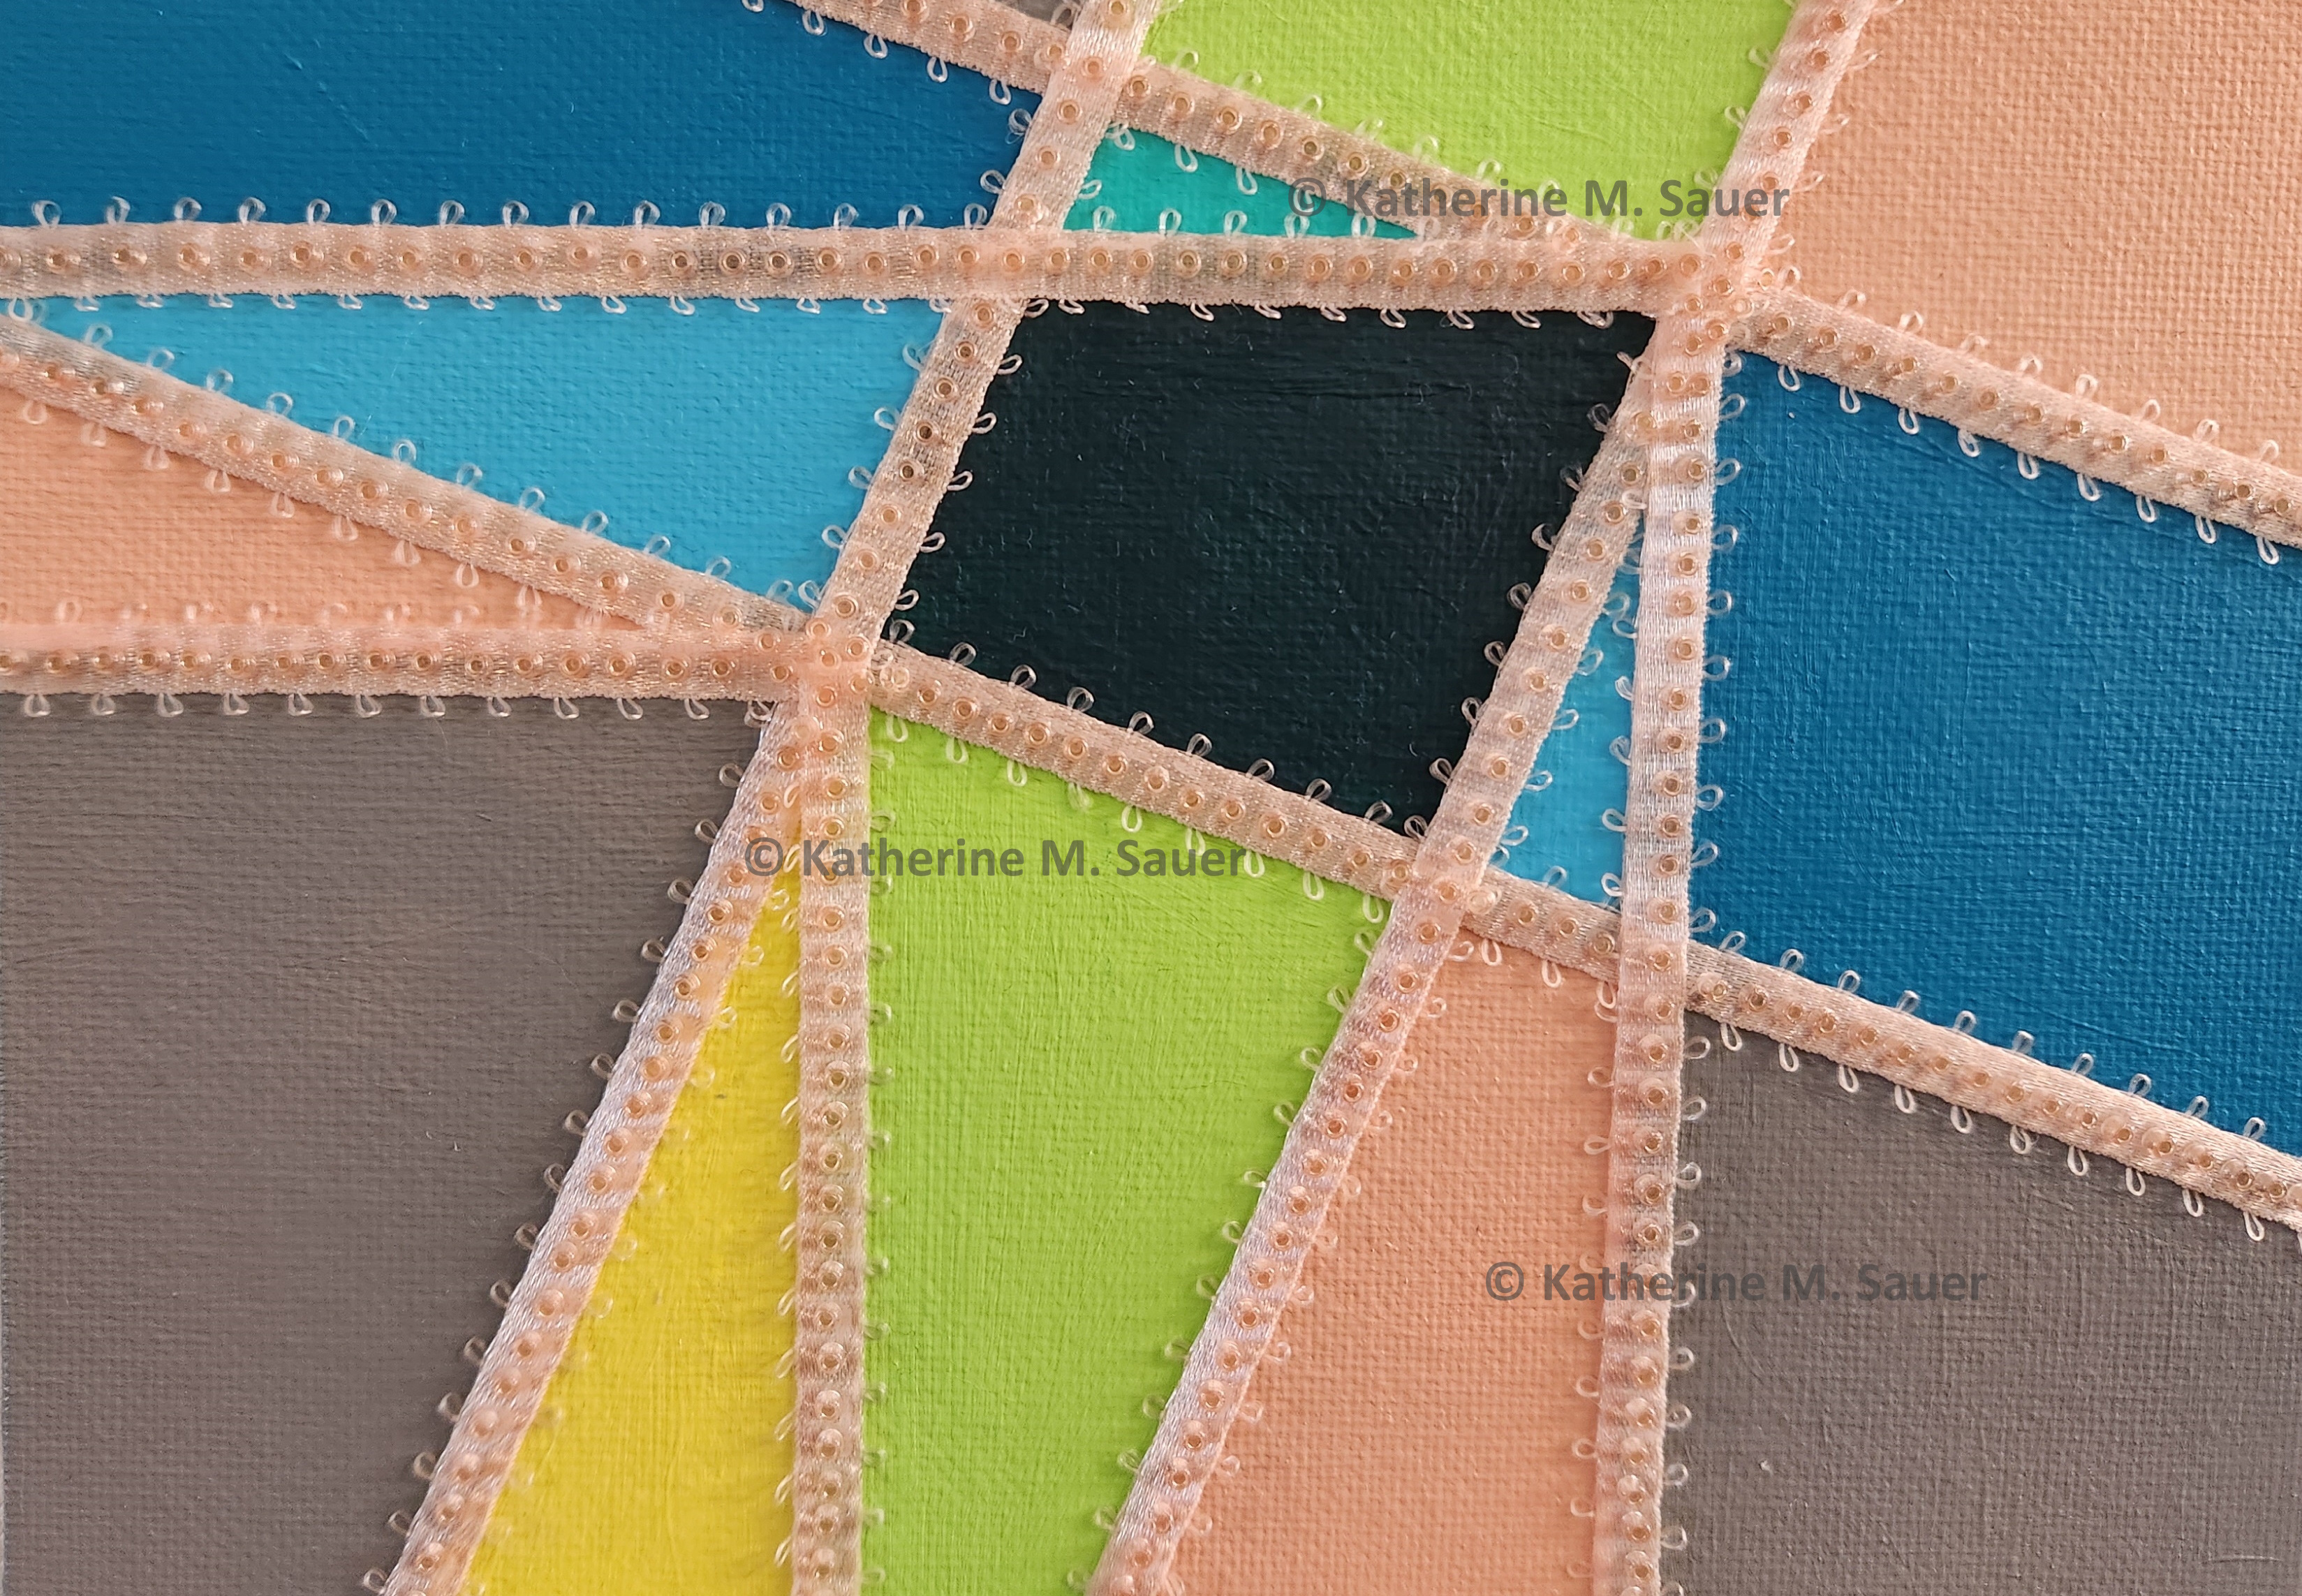
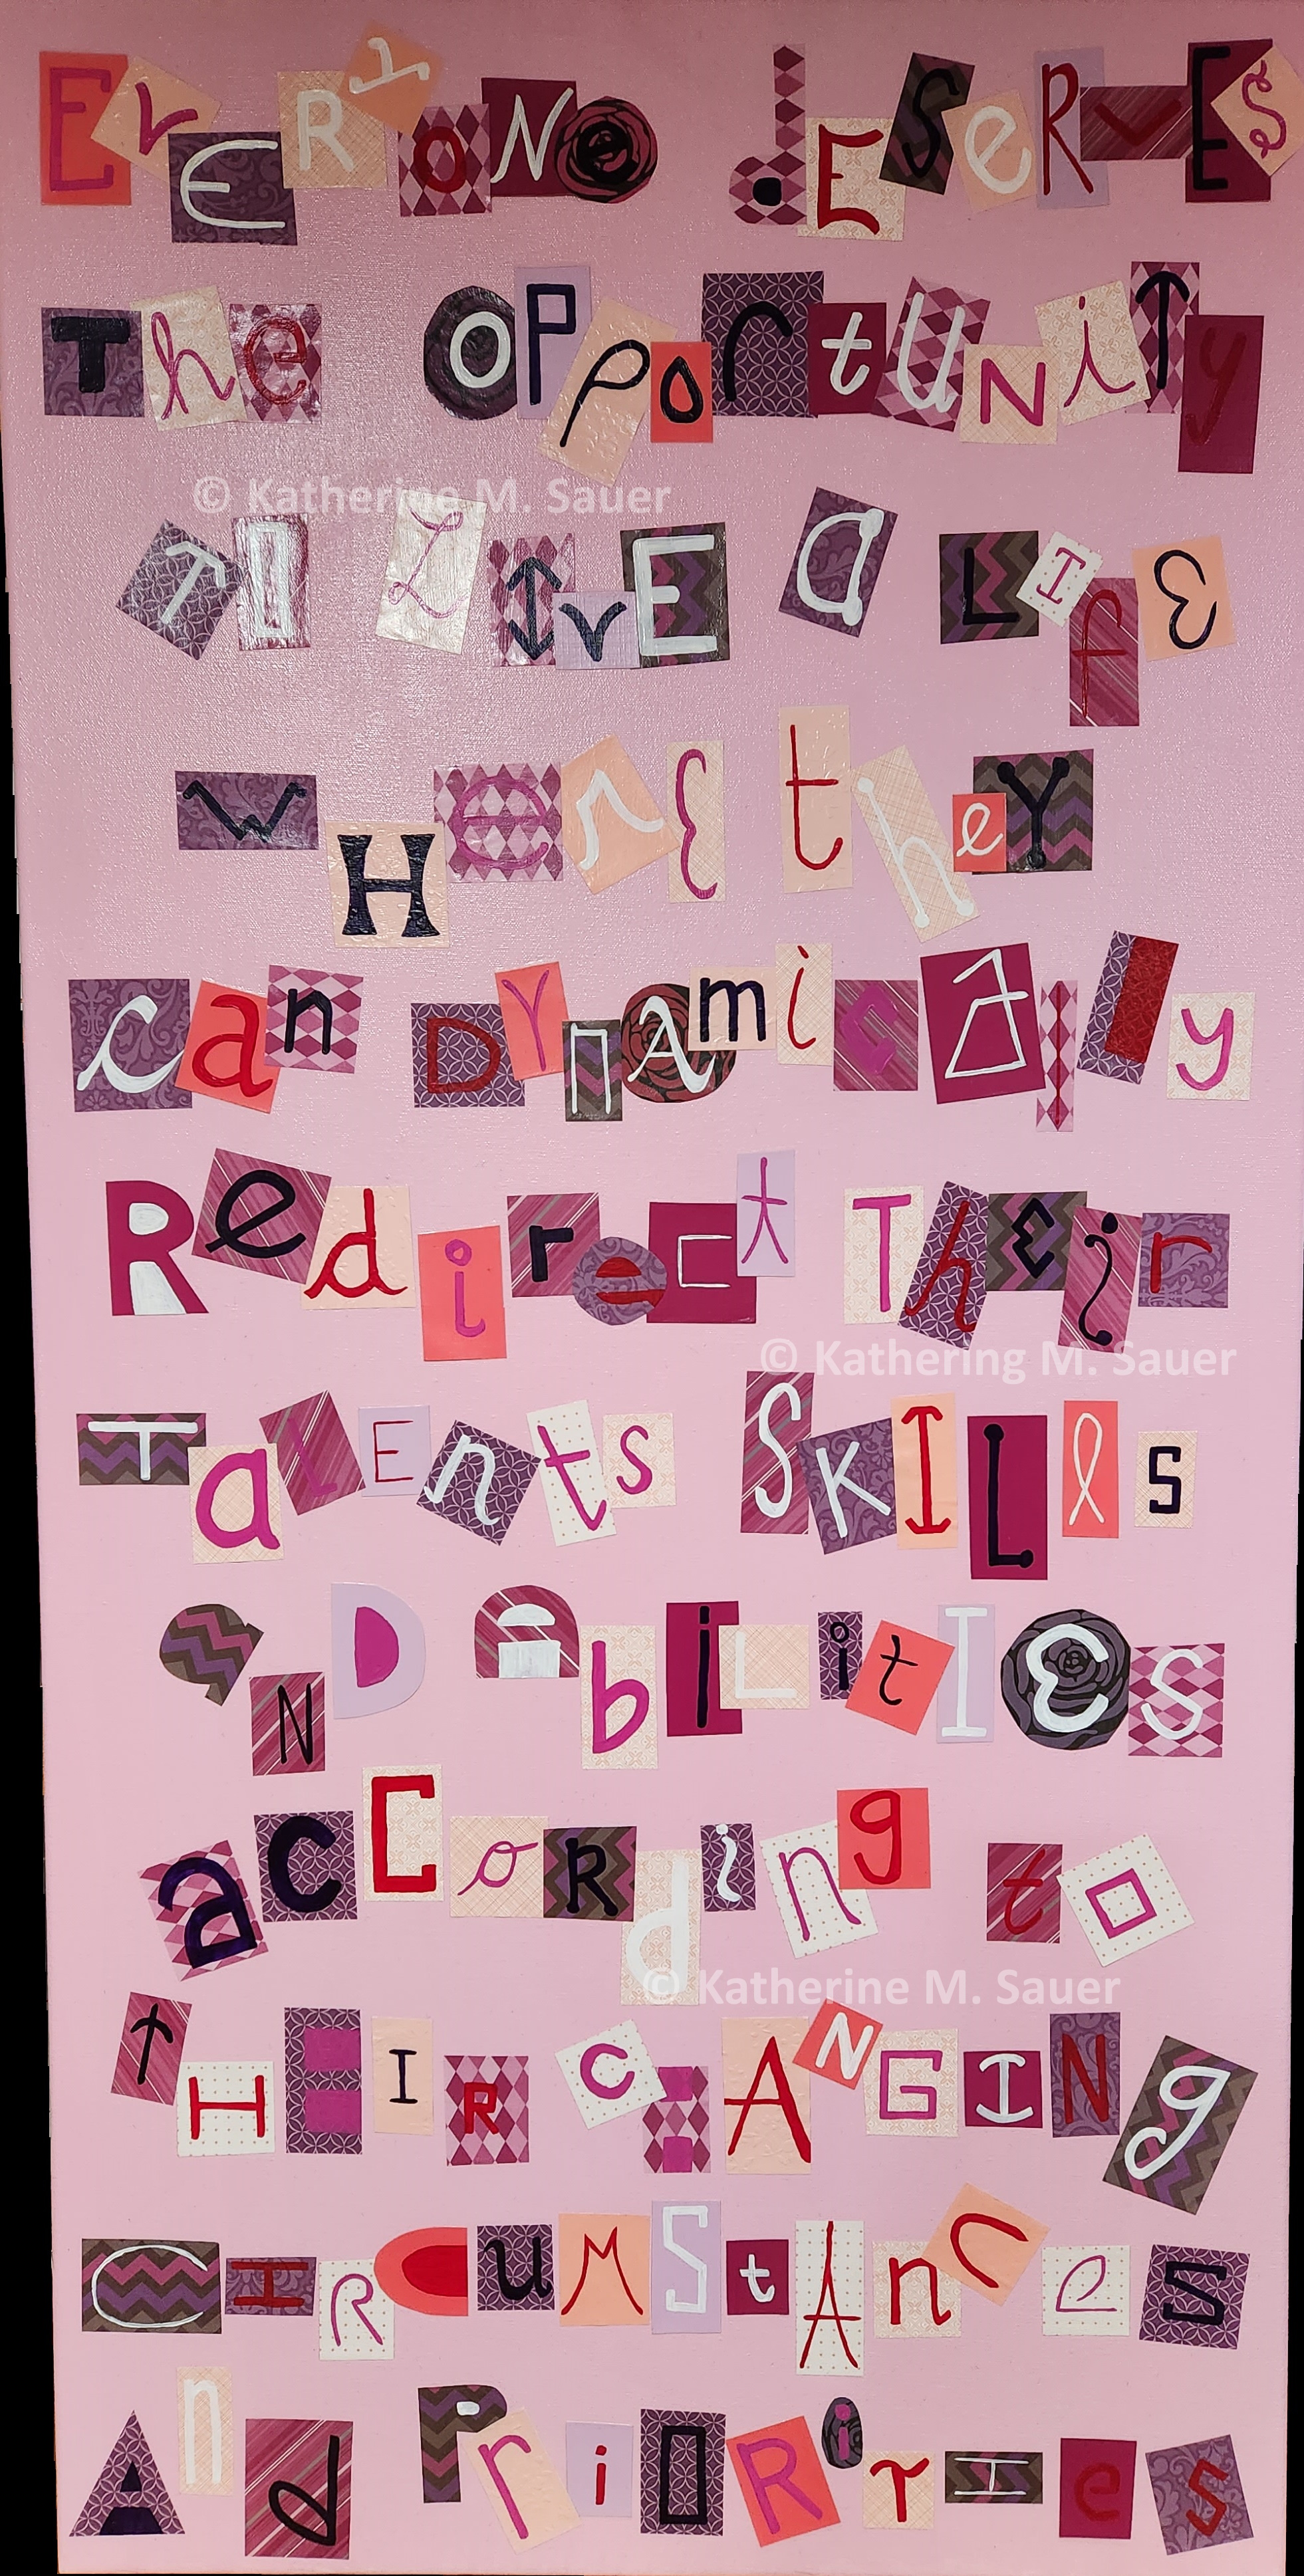
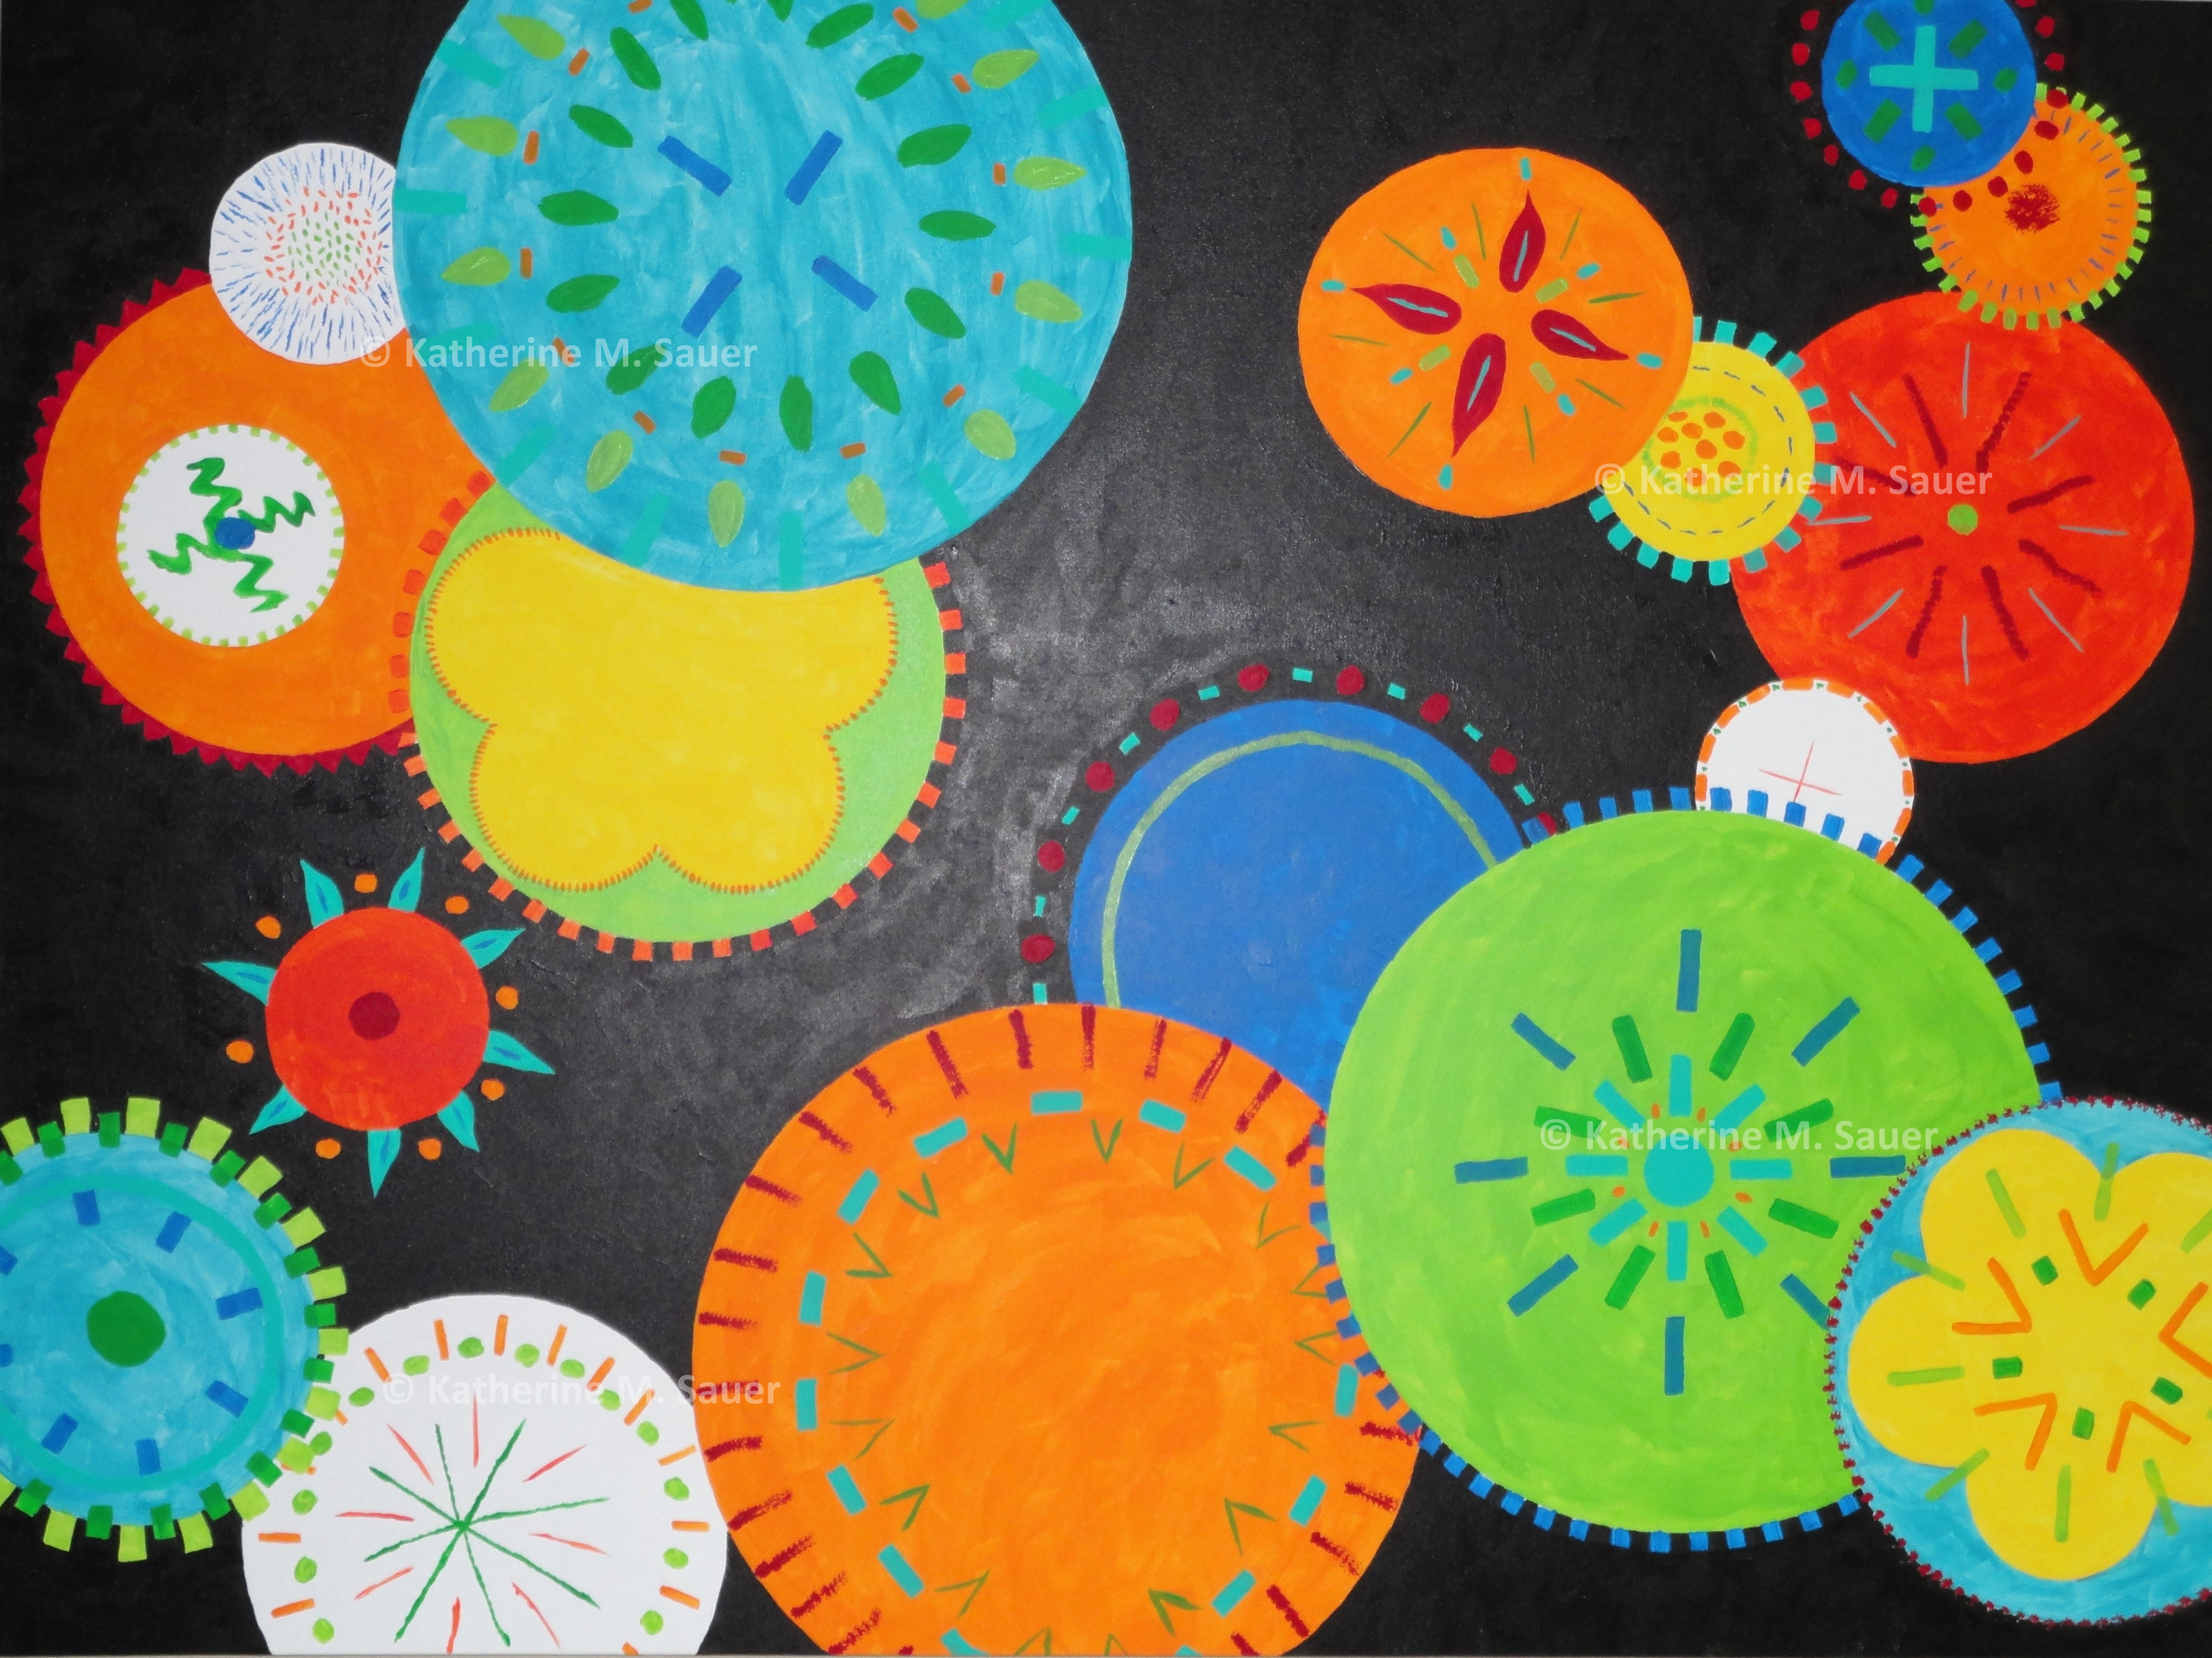
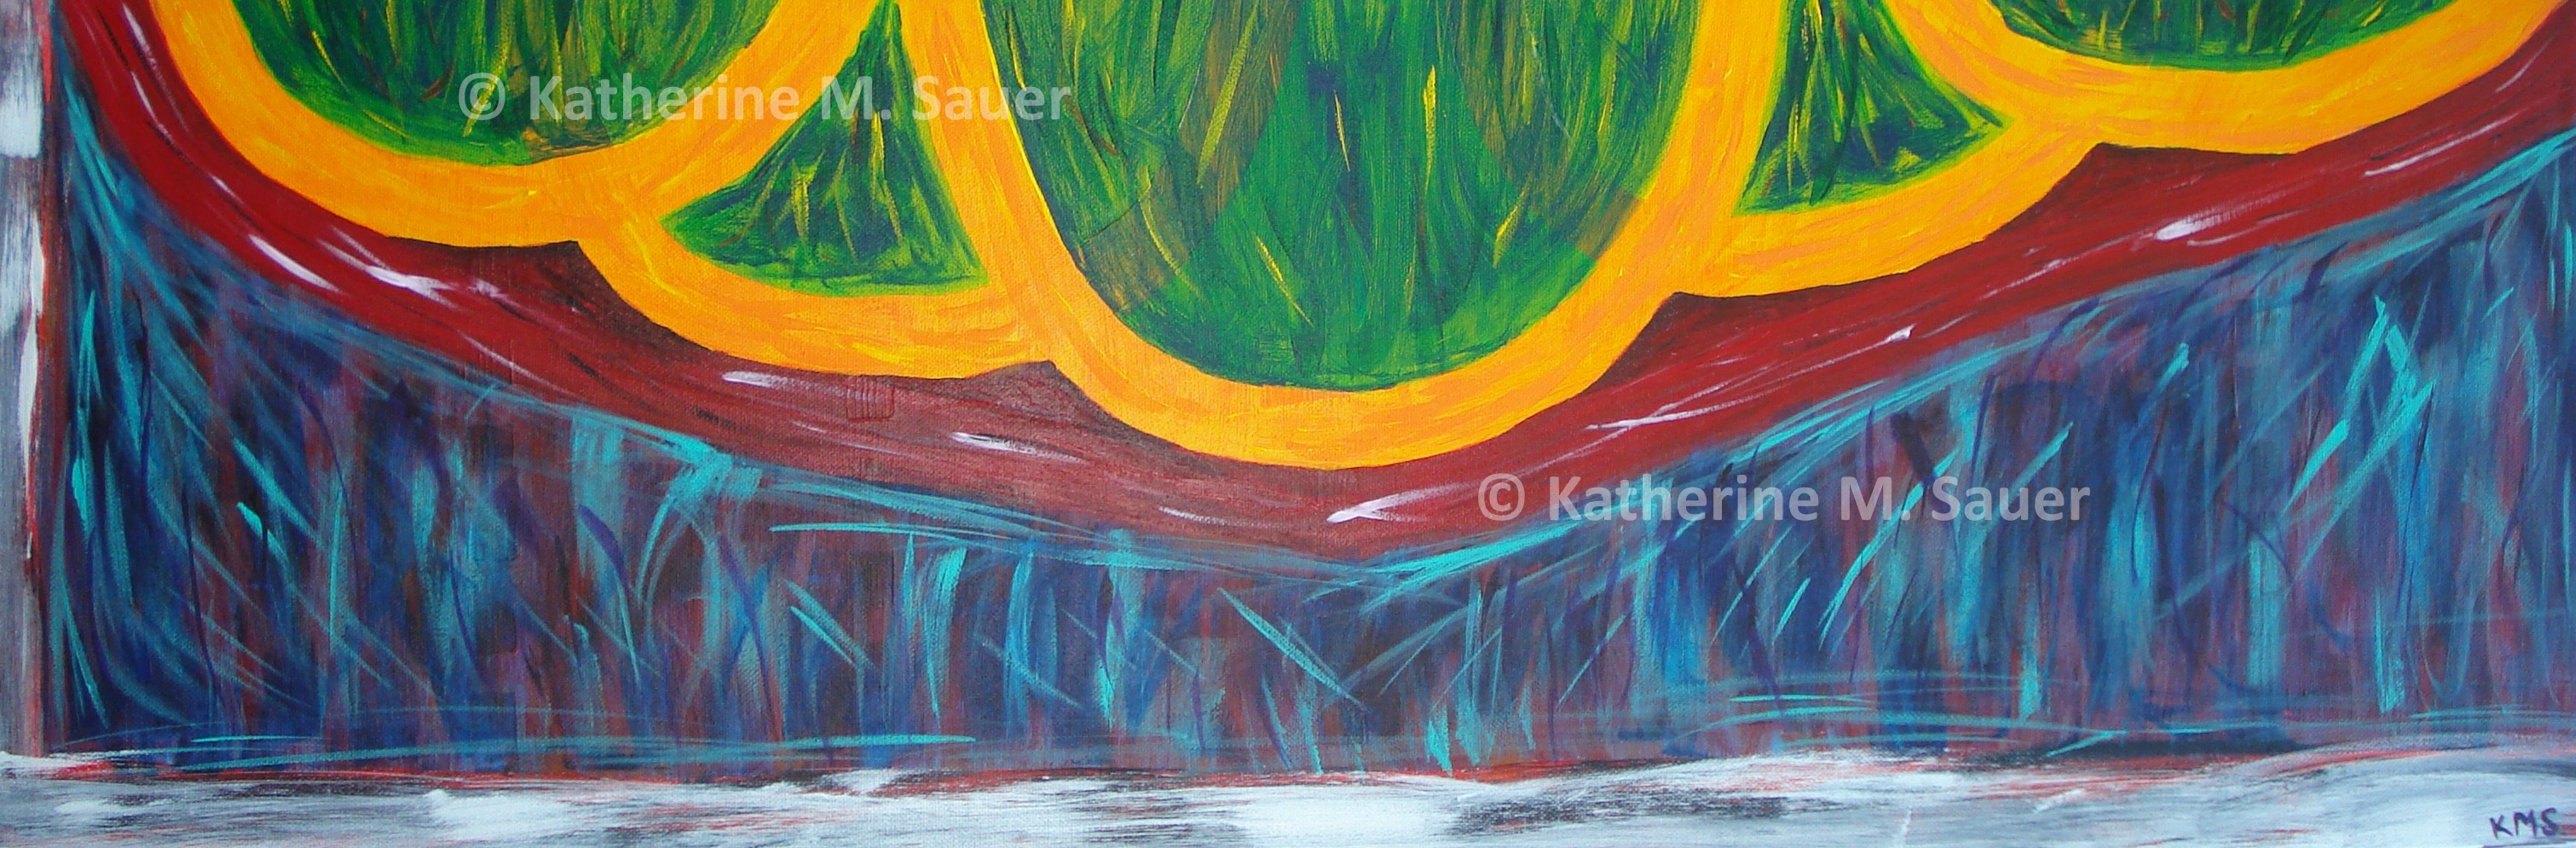
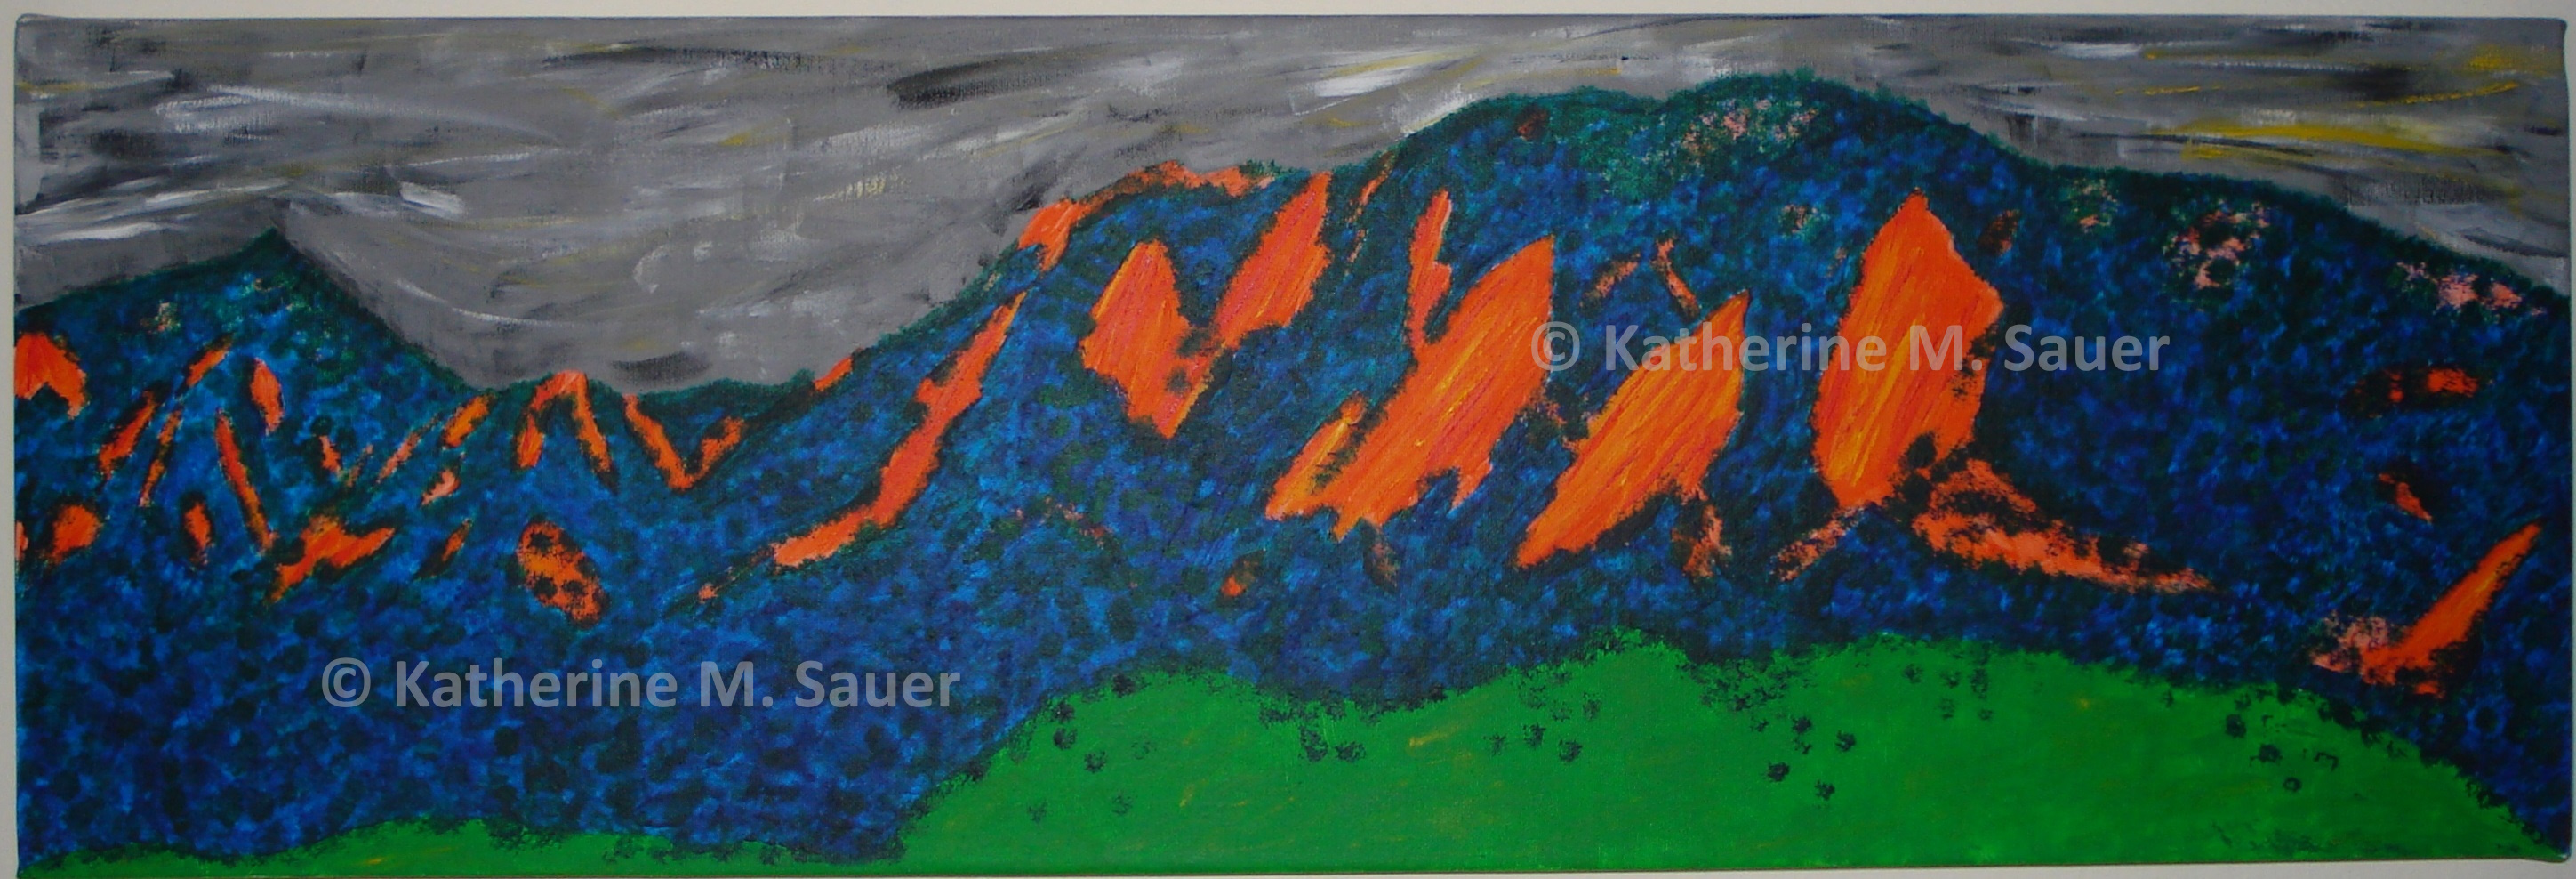
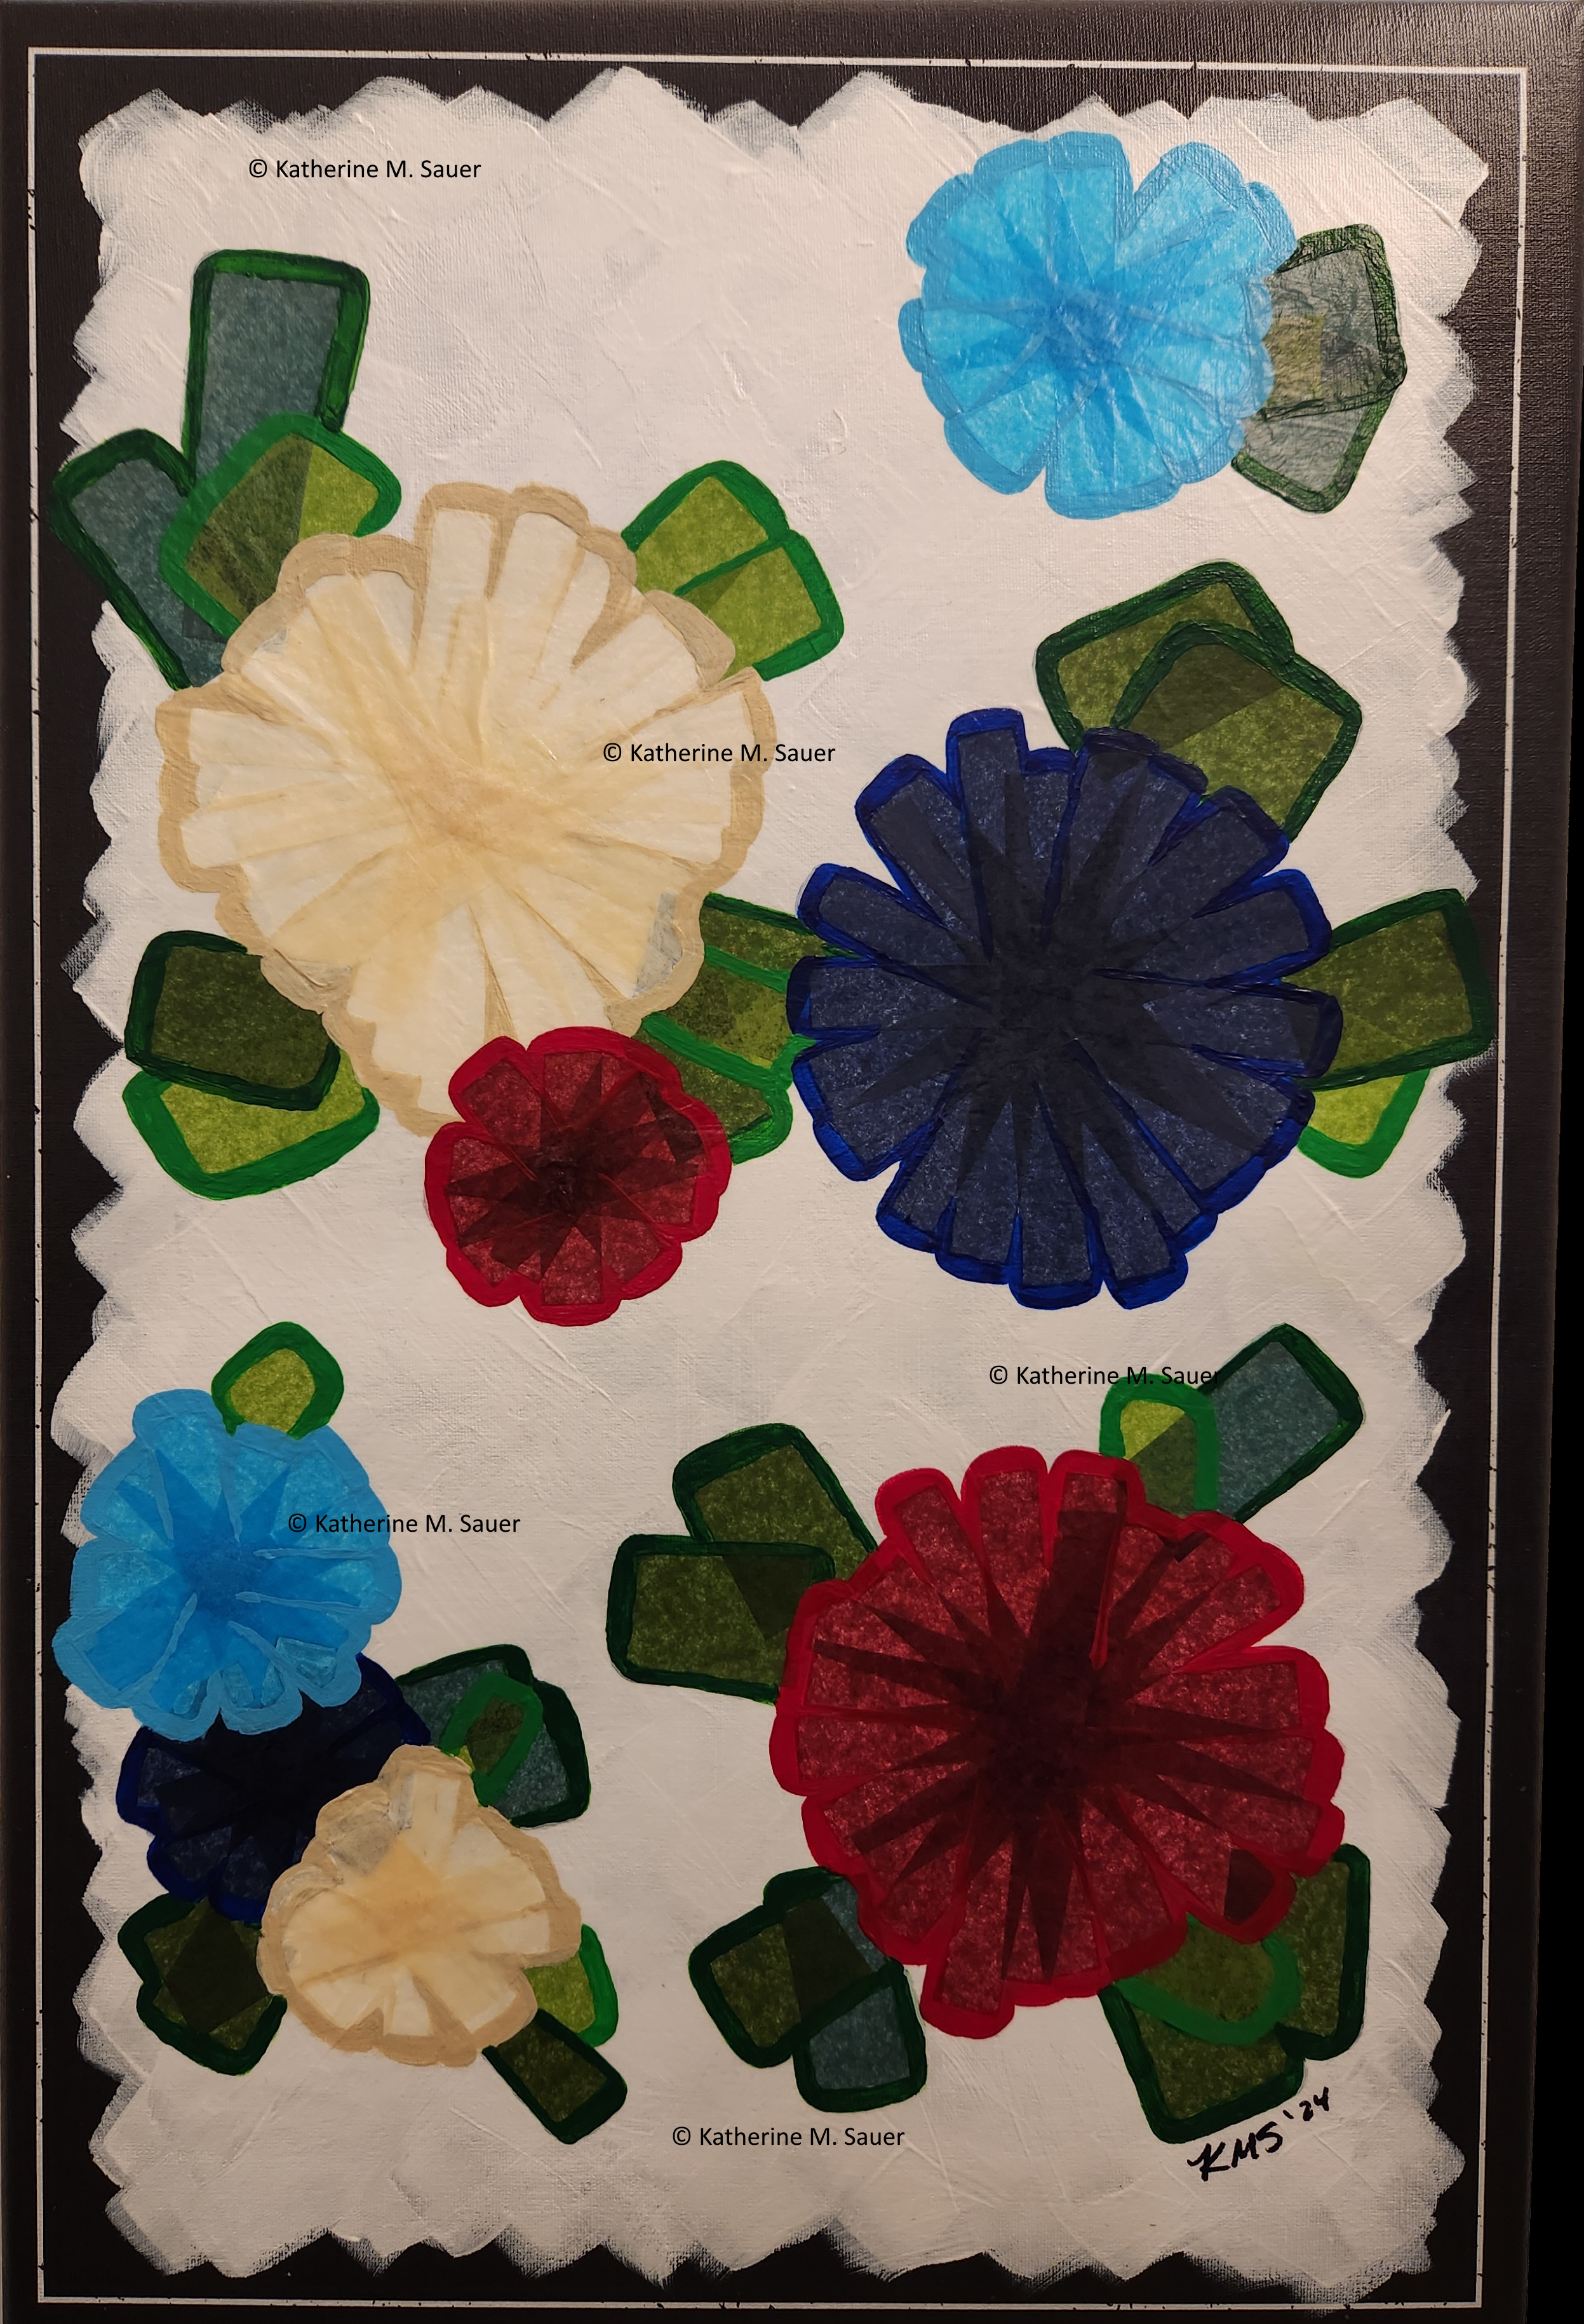
All Artwork by Katherine M. Sauer
in Reverse Chronological Order

Dahlias (2024)
paper and acrylic on coated recylced canvas; 12″ x 18″

an artwork with a variety of dahlia flowers

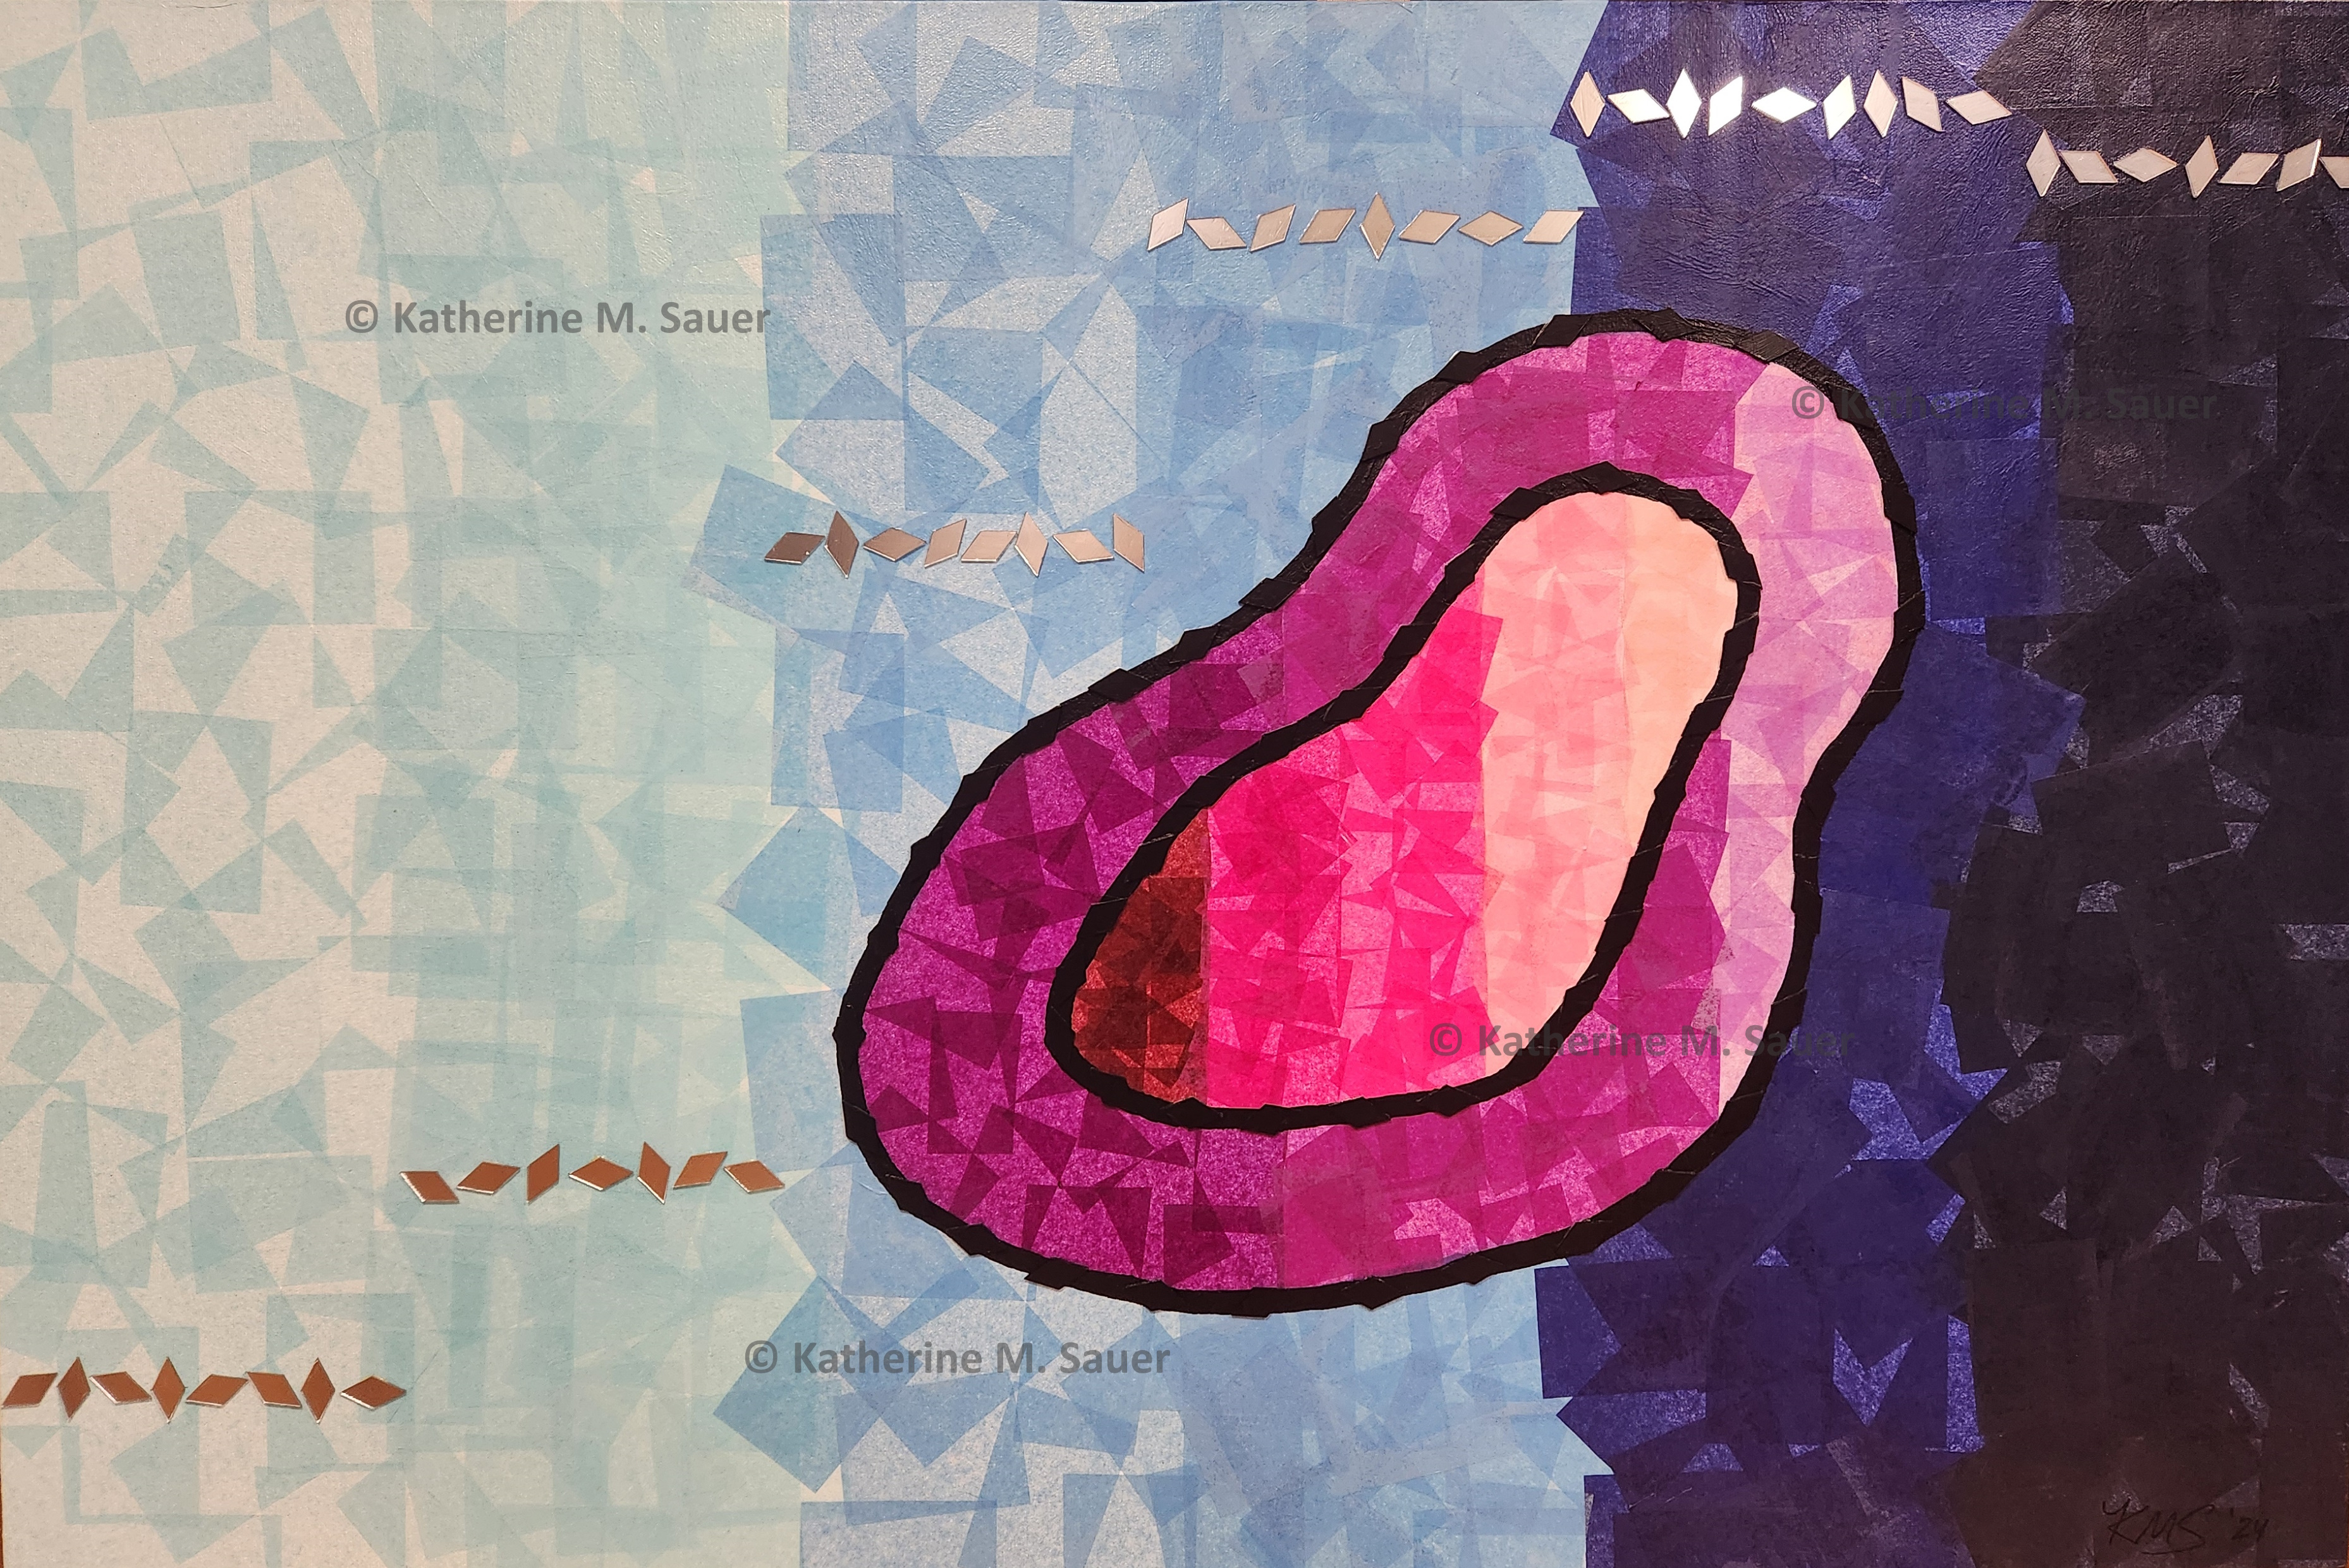
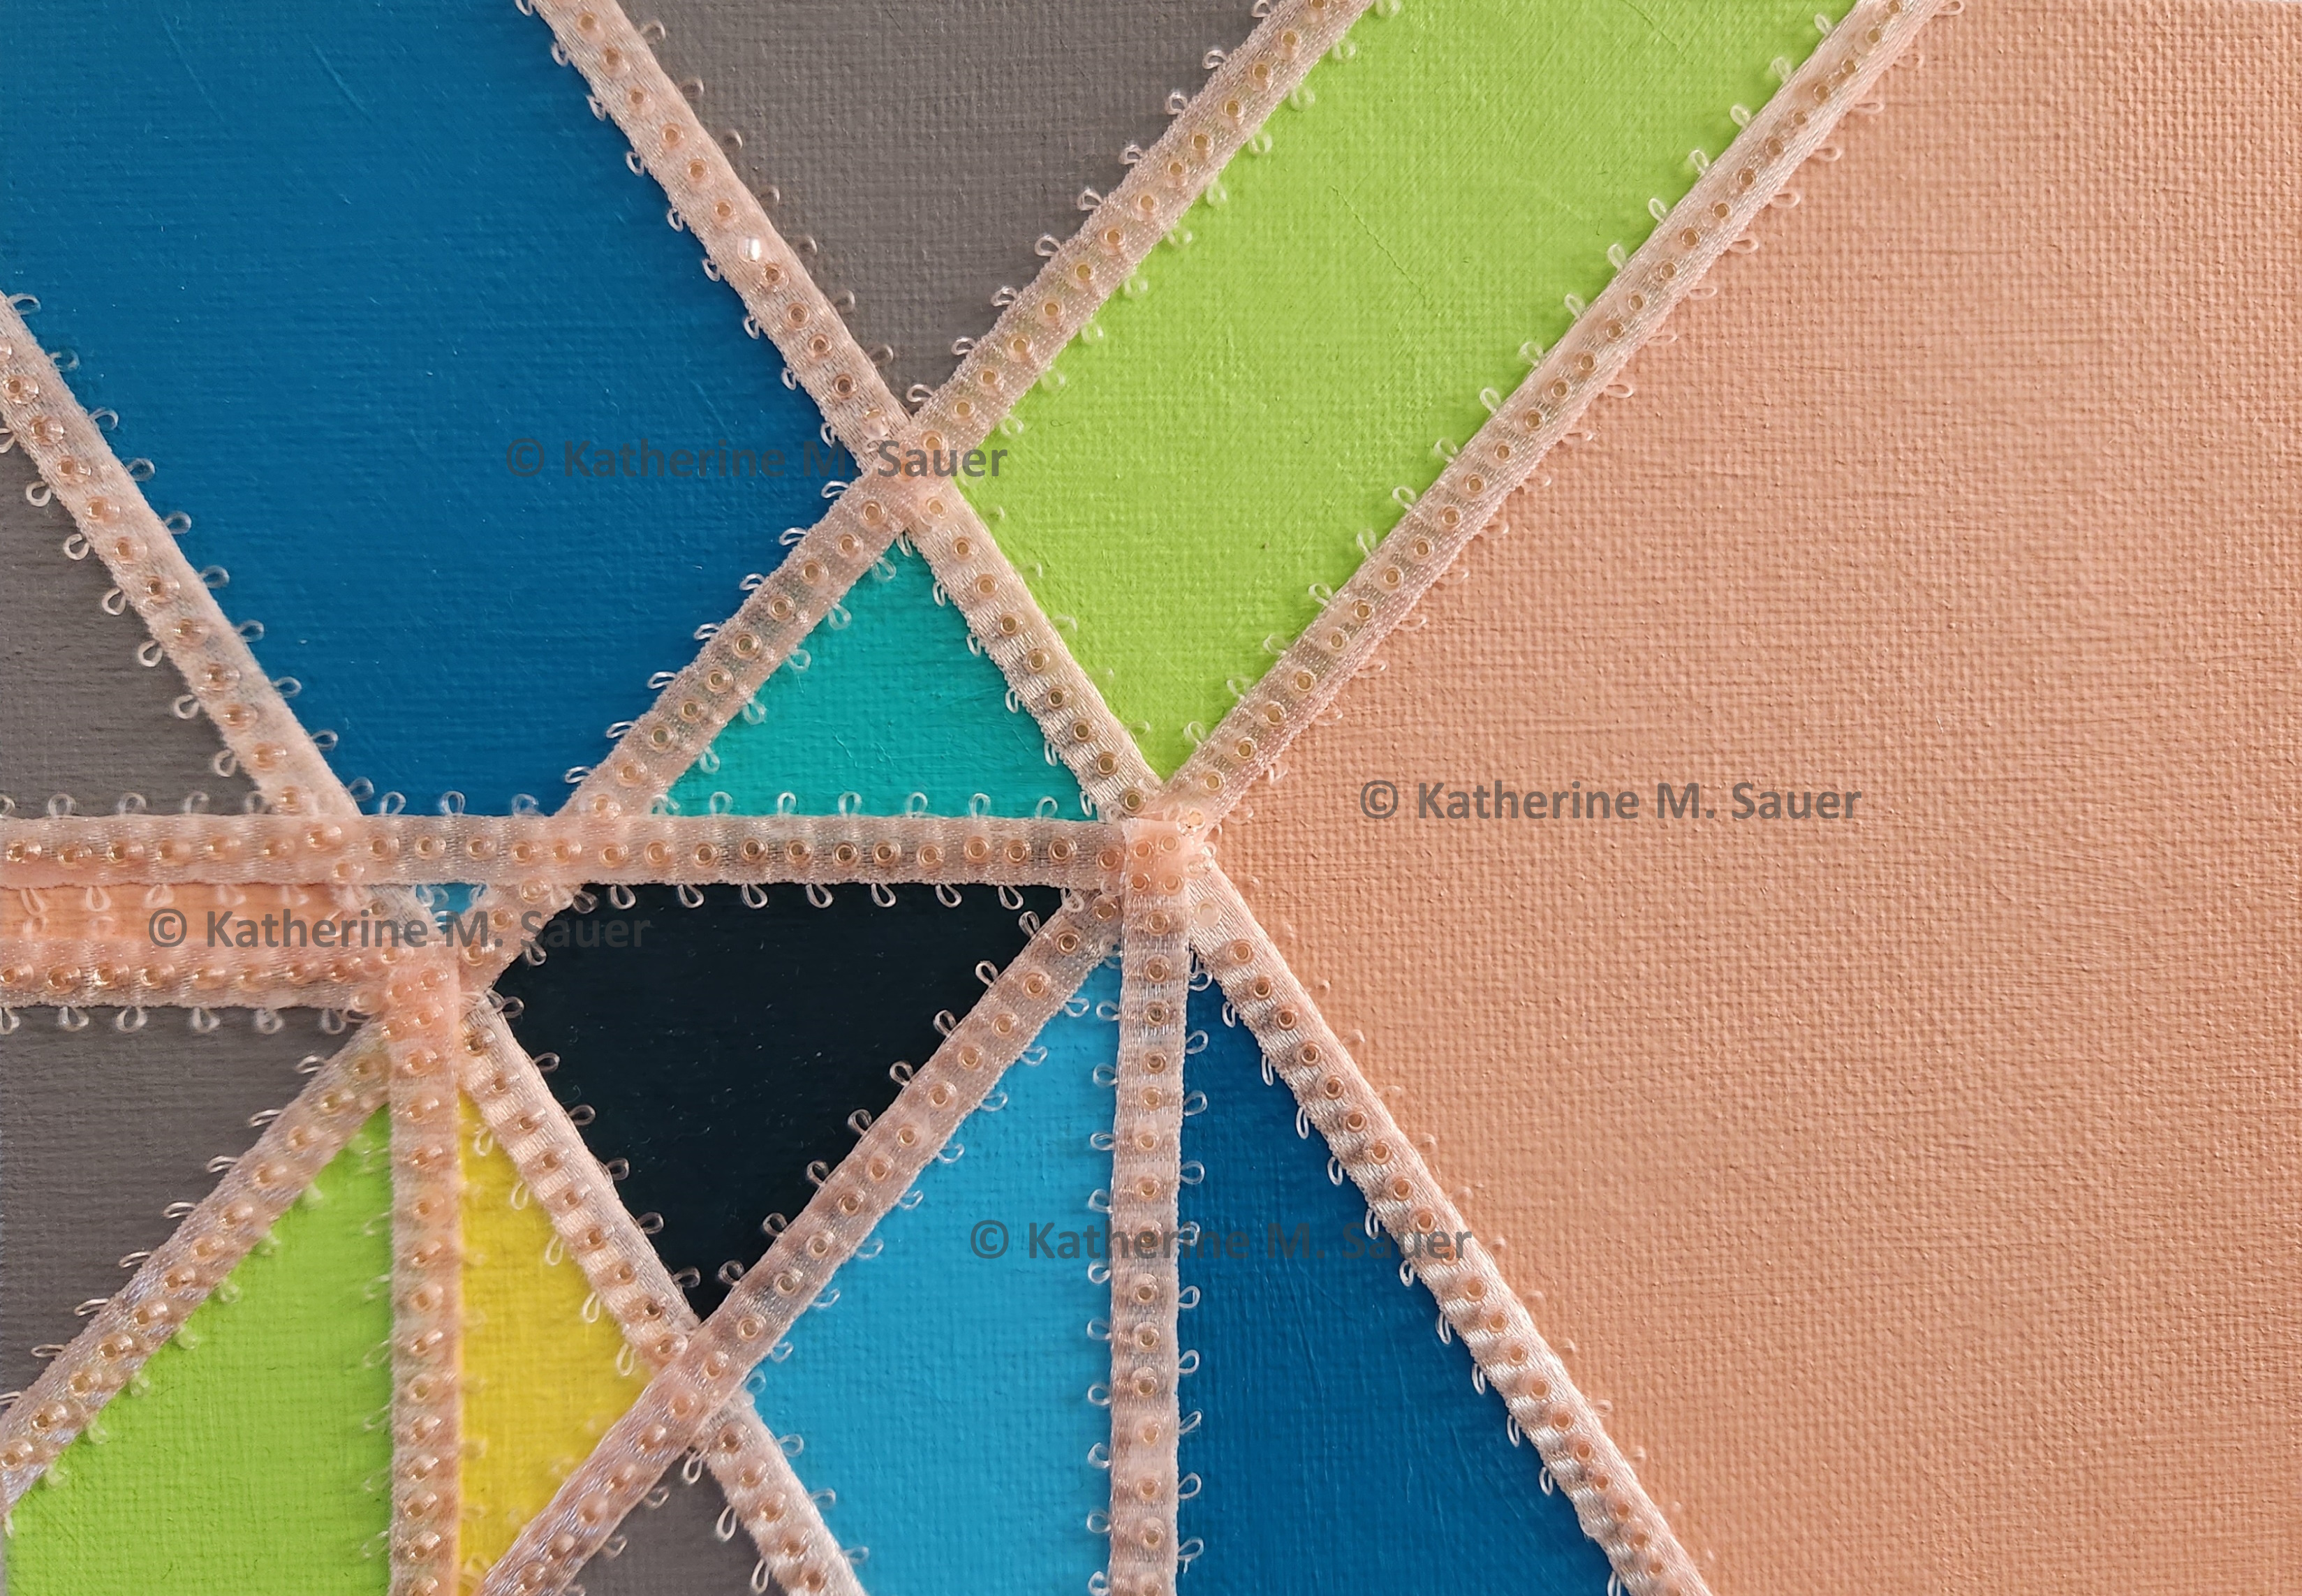
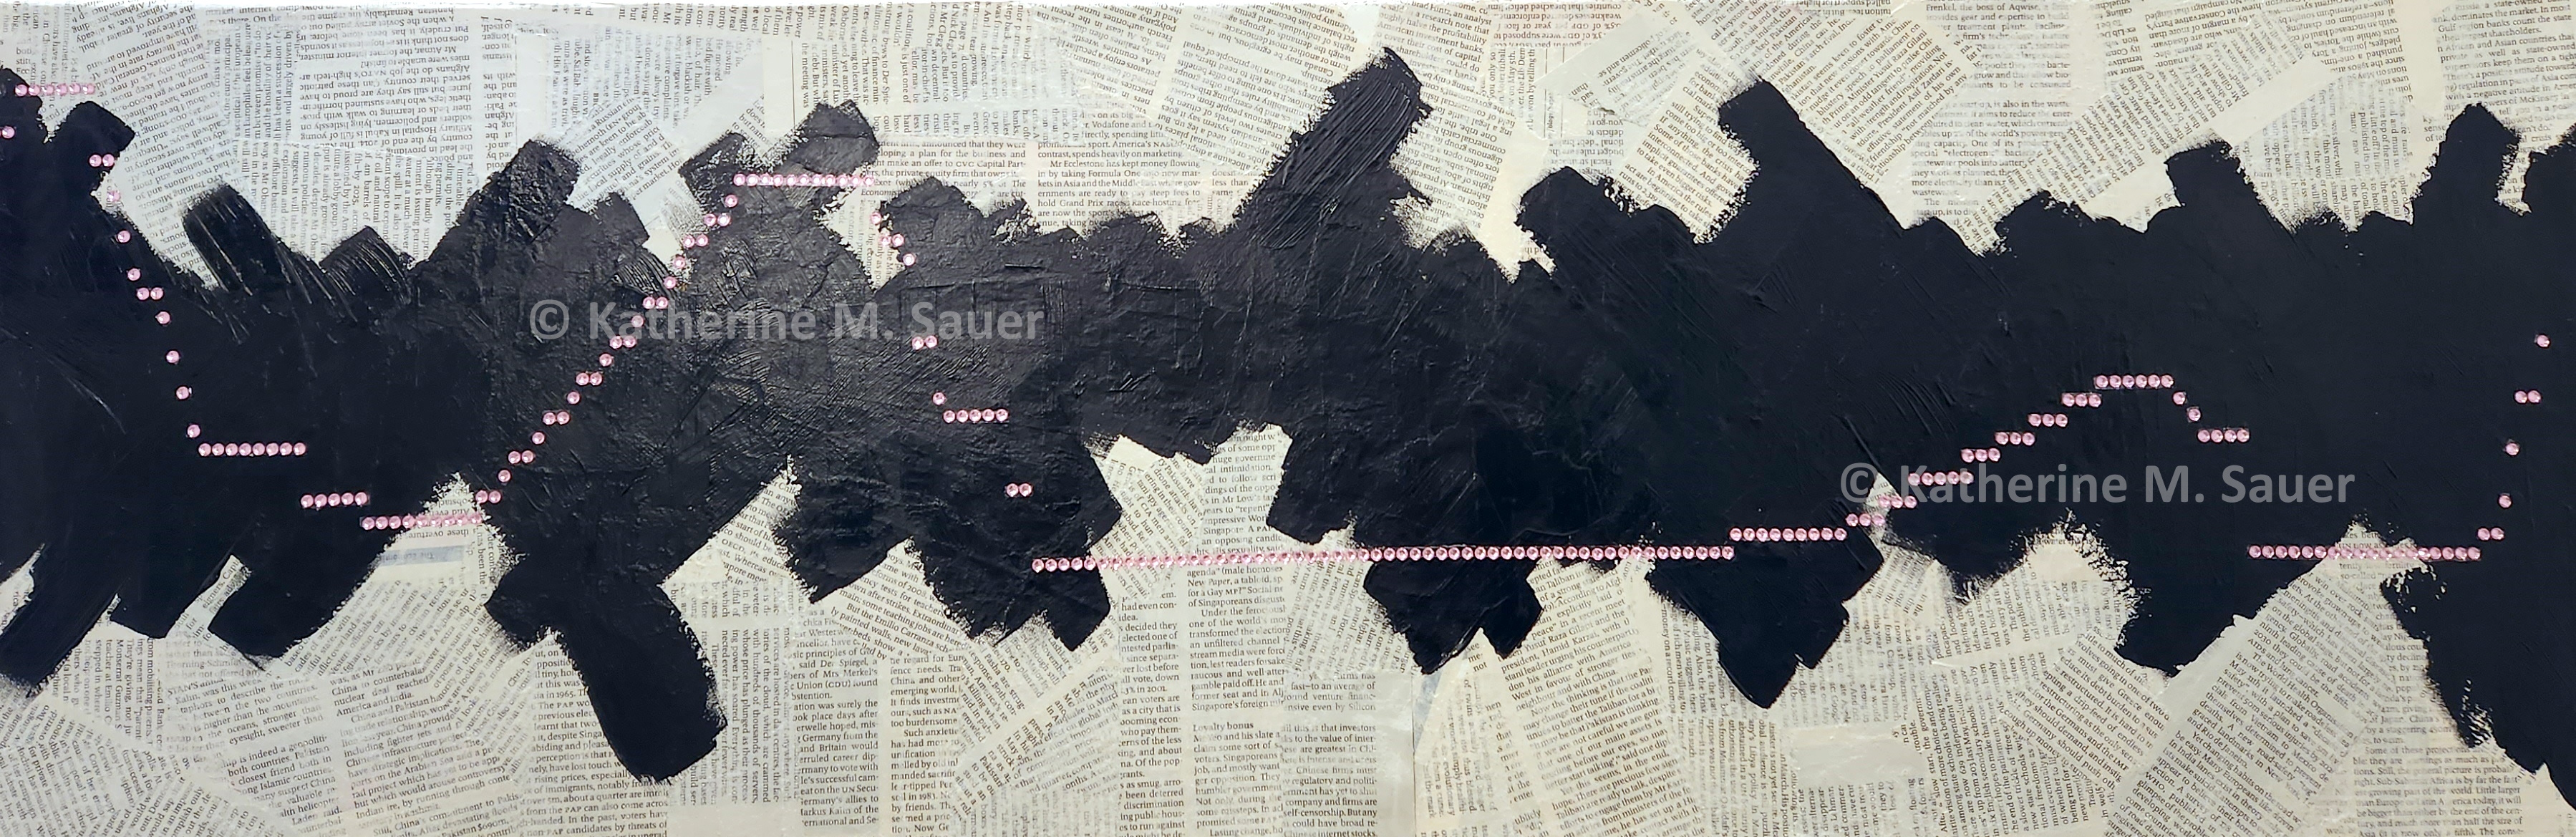
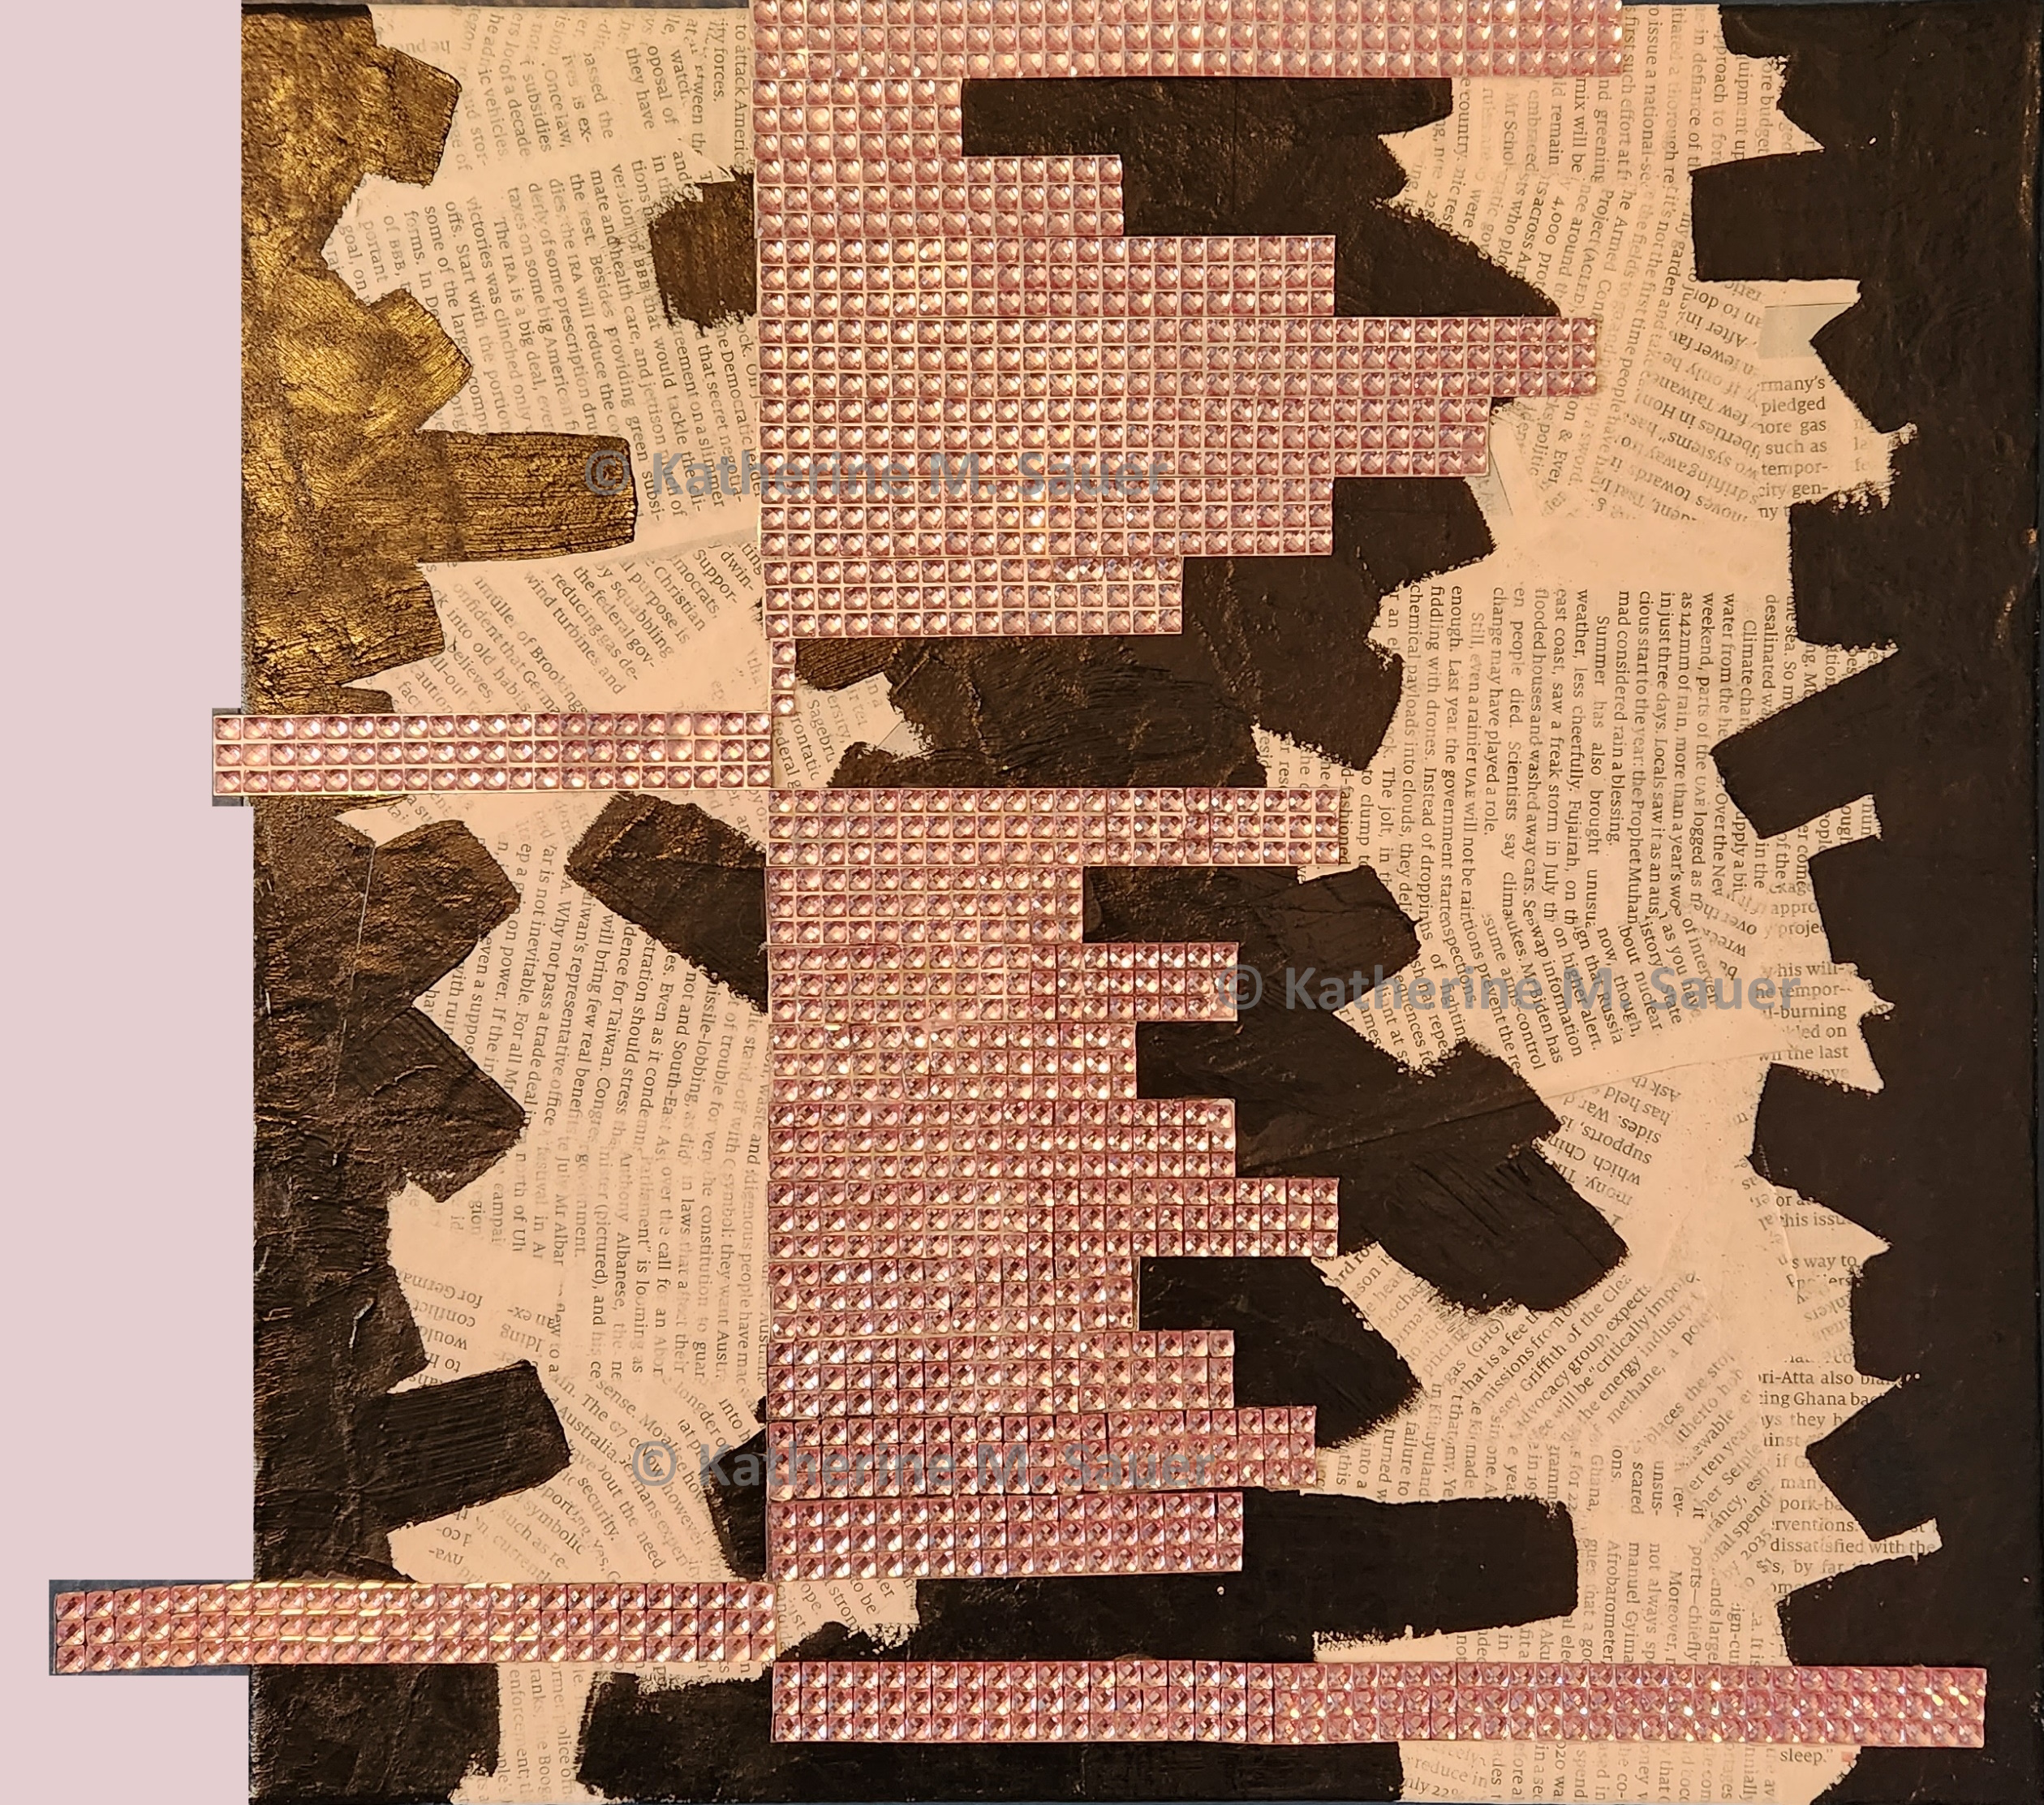
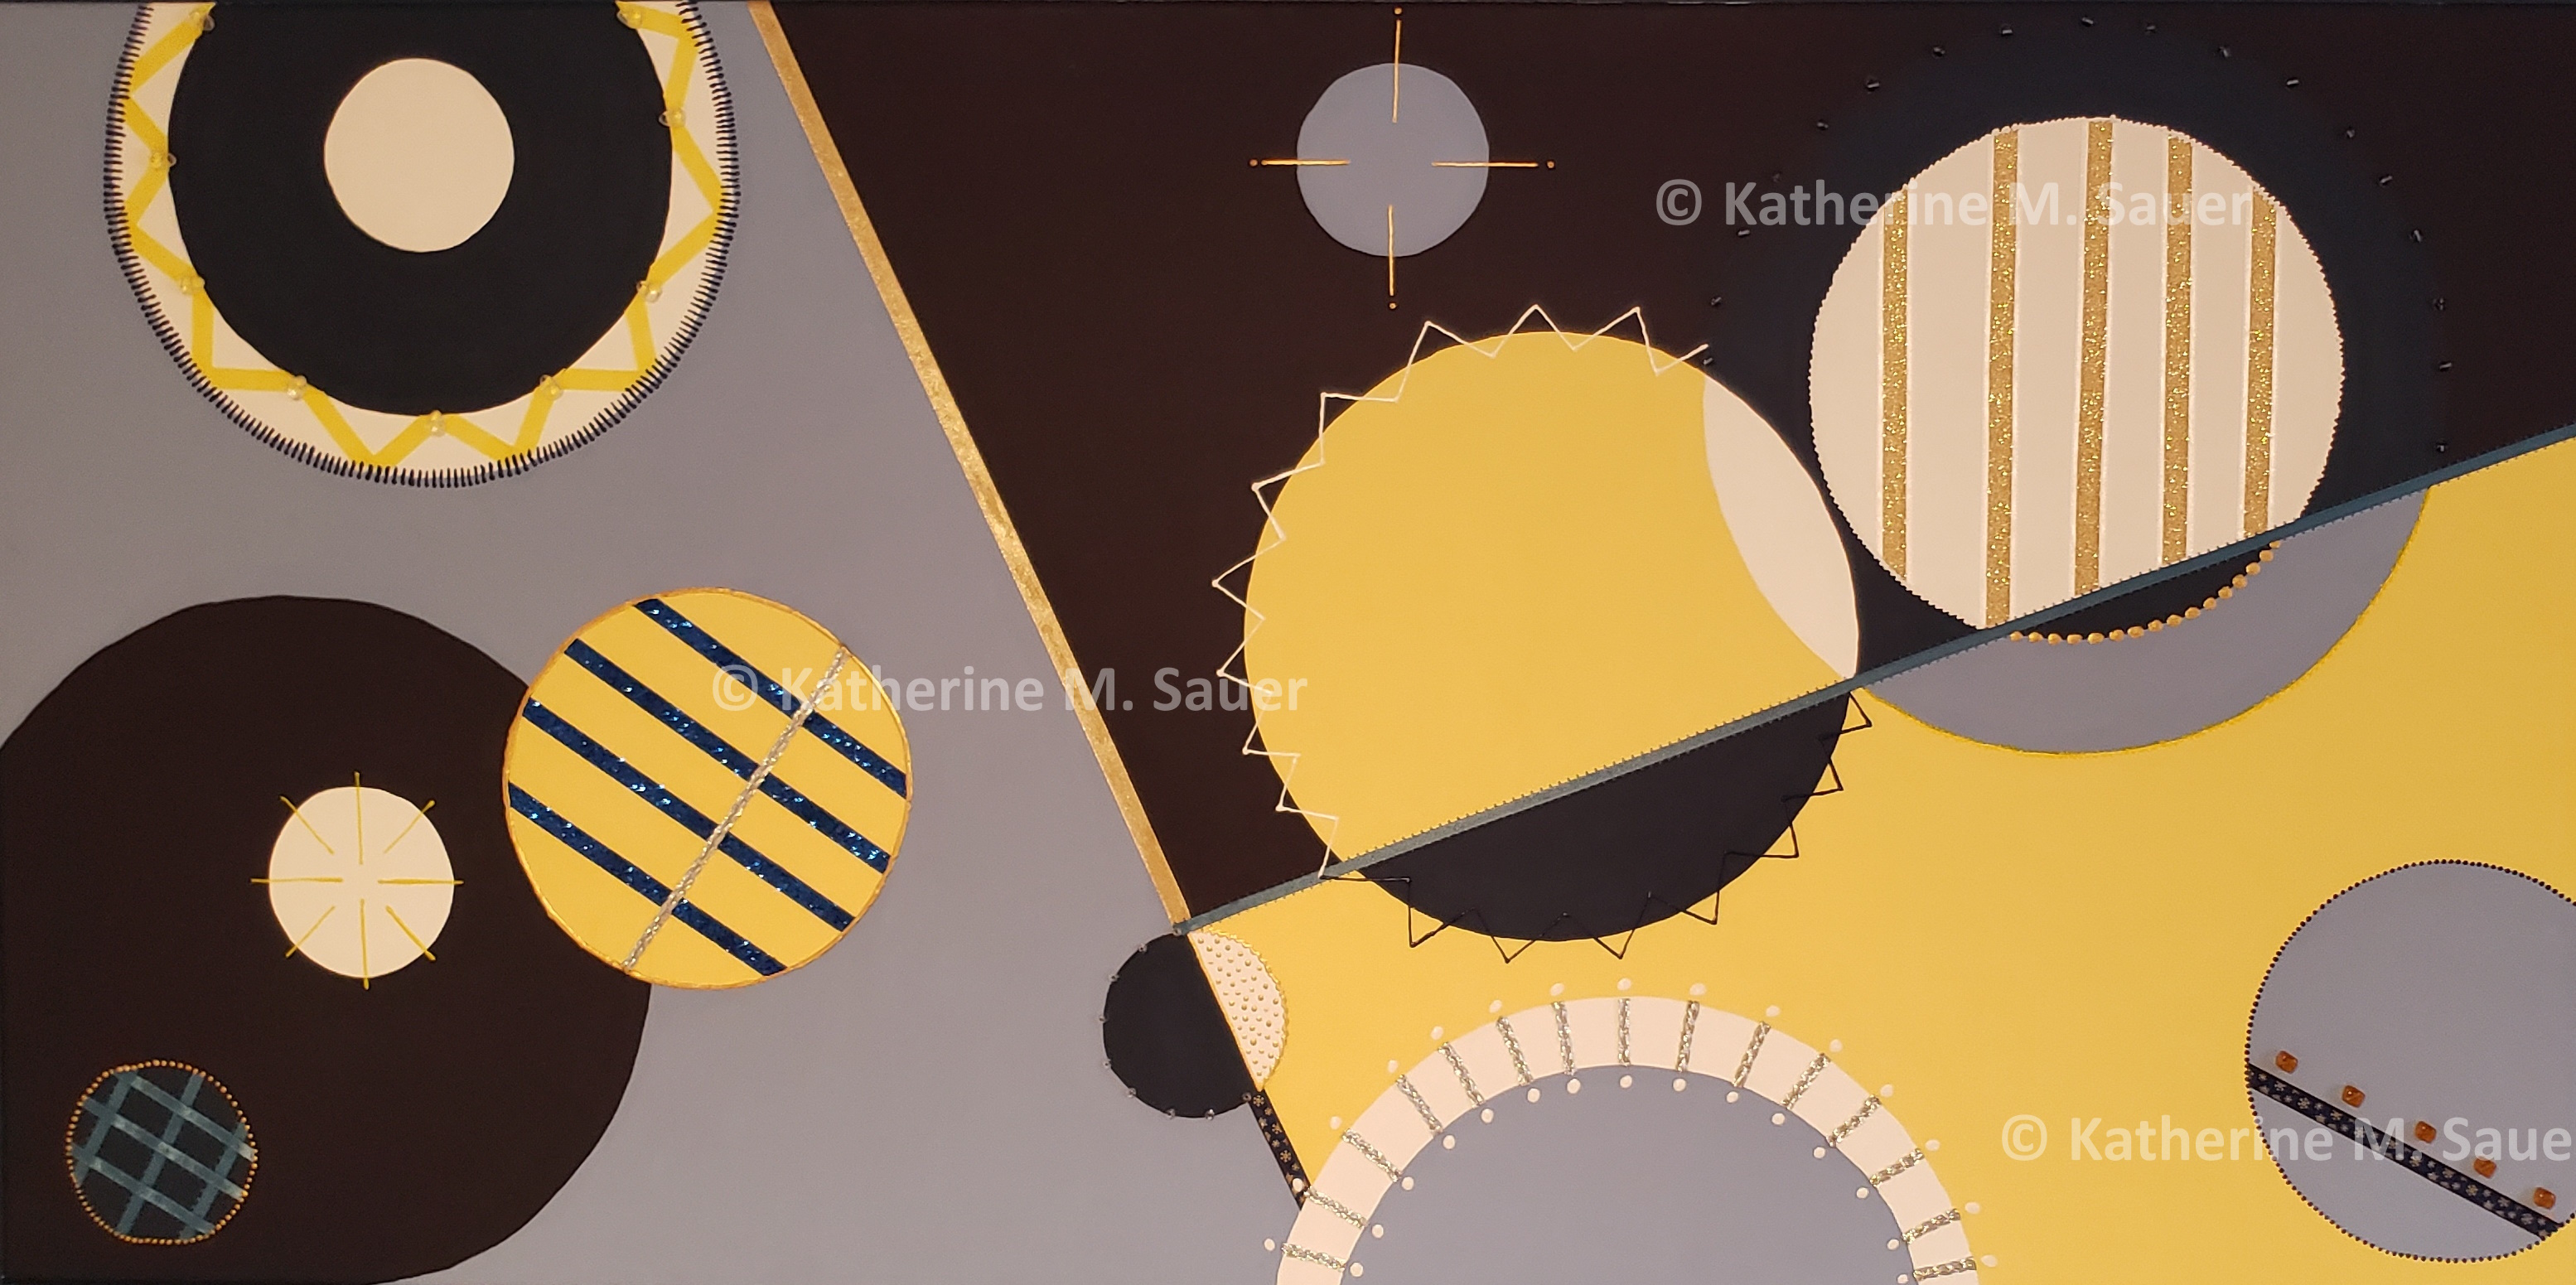
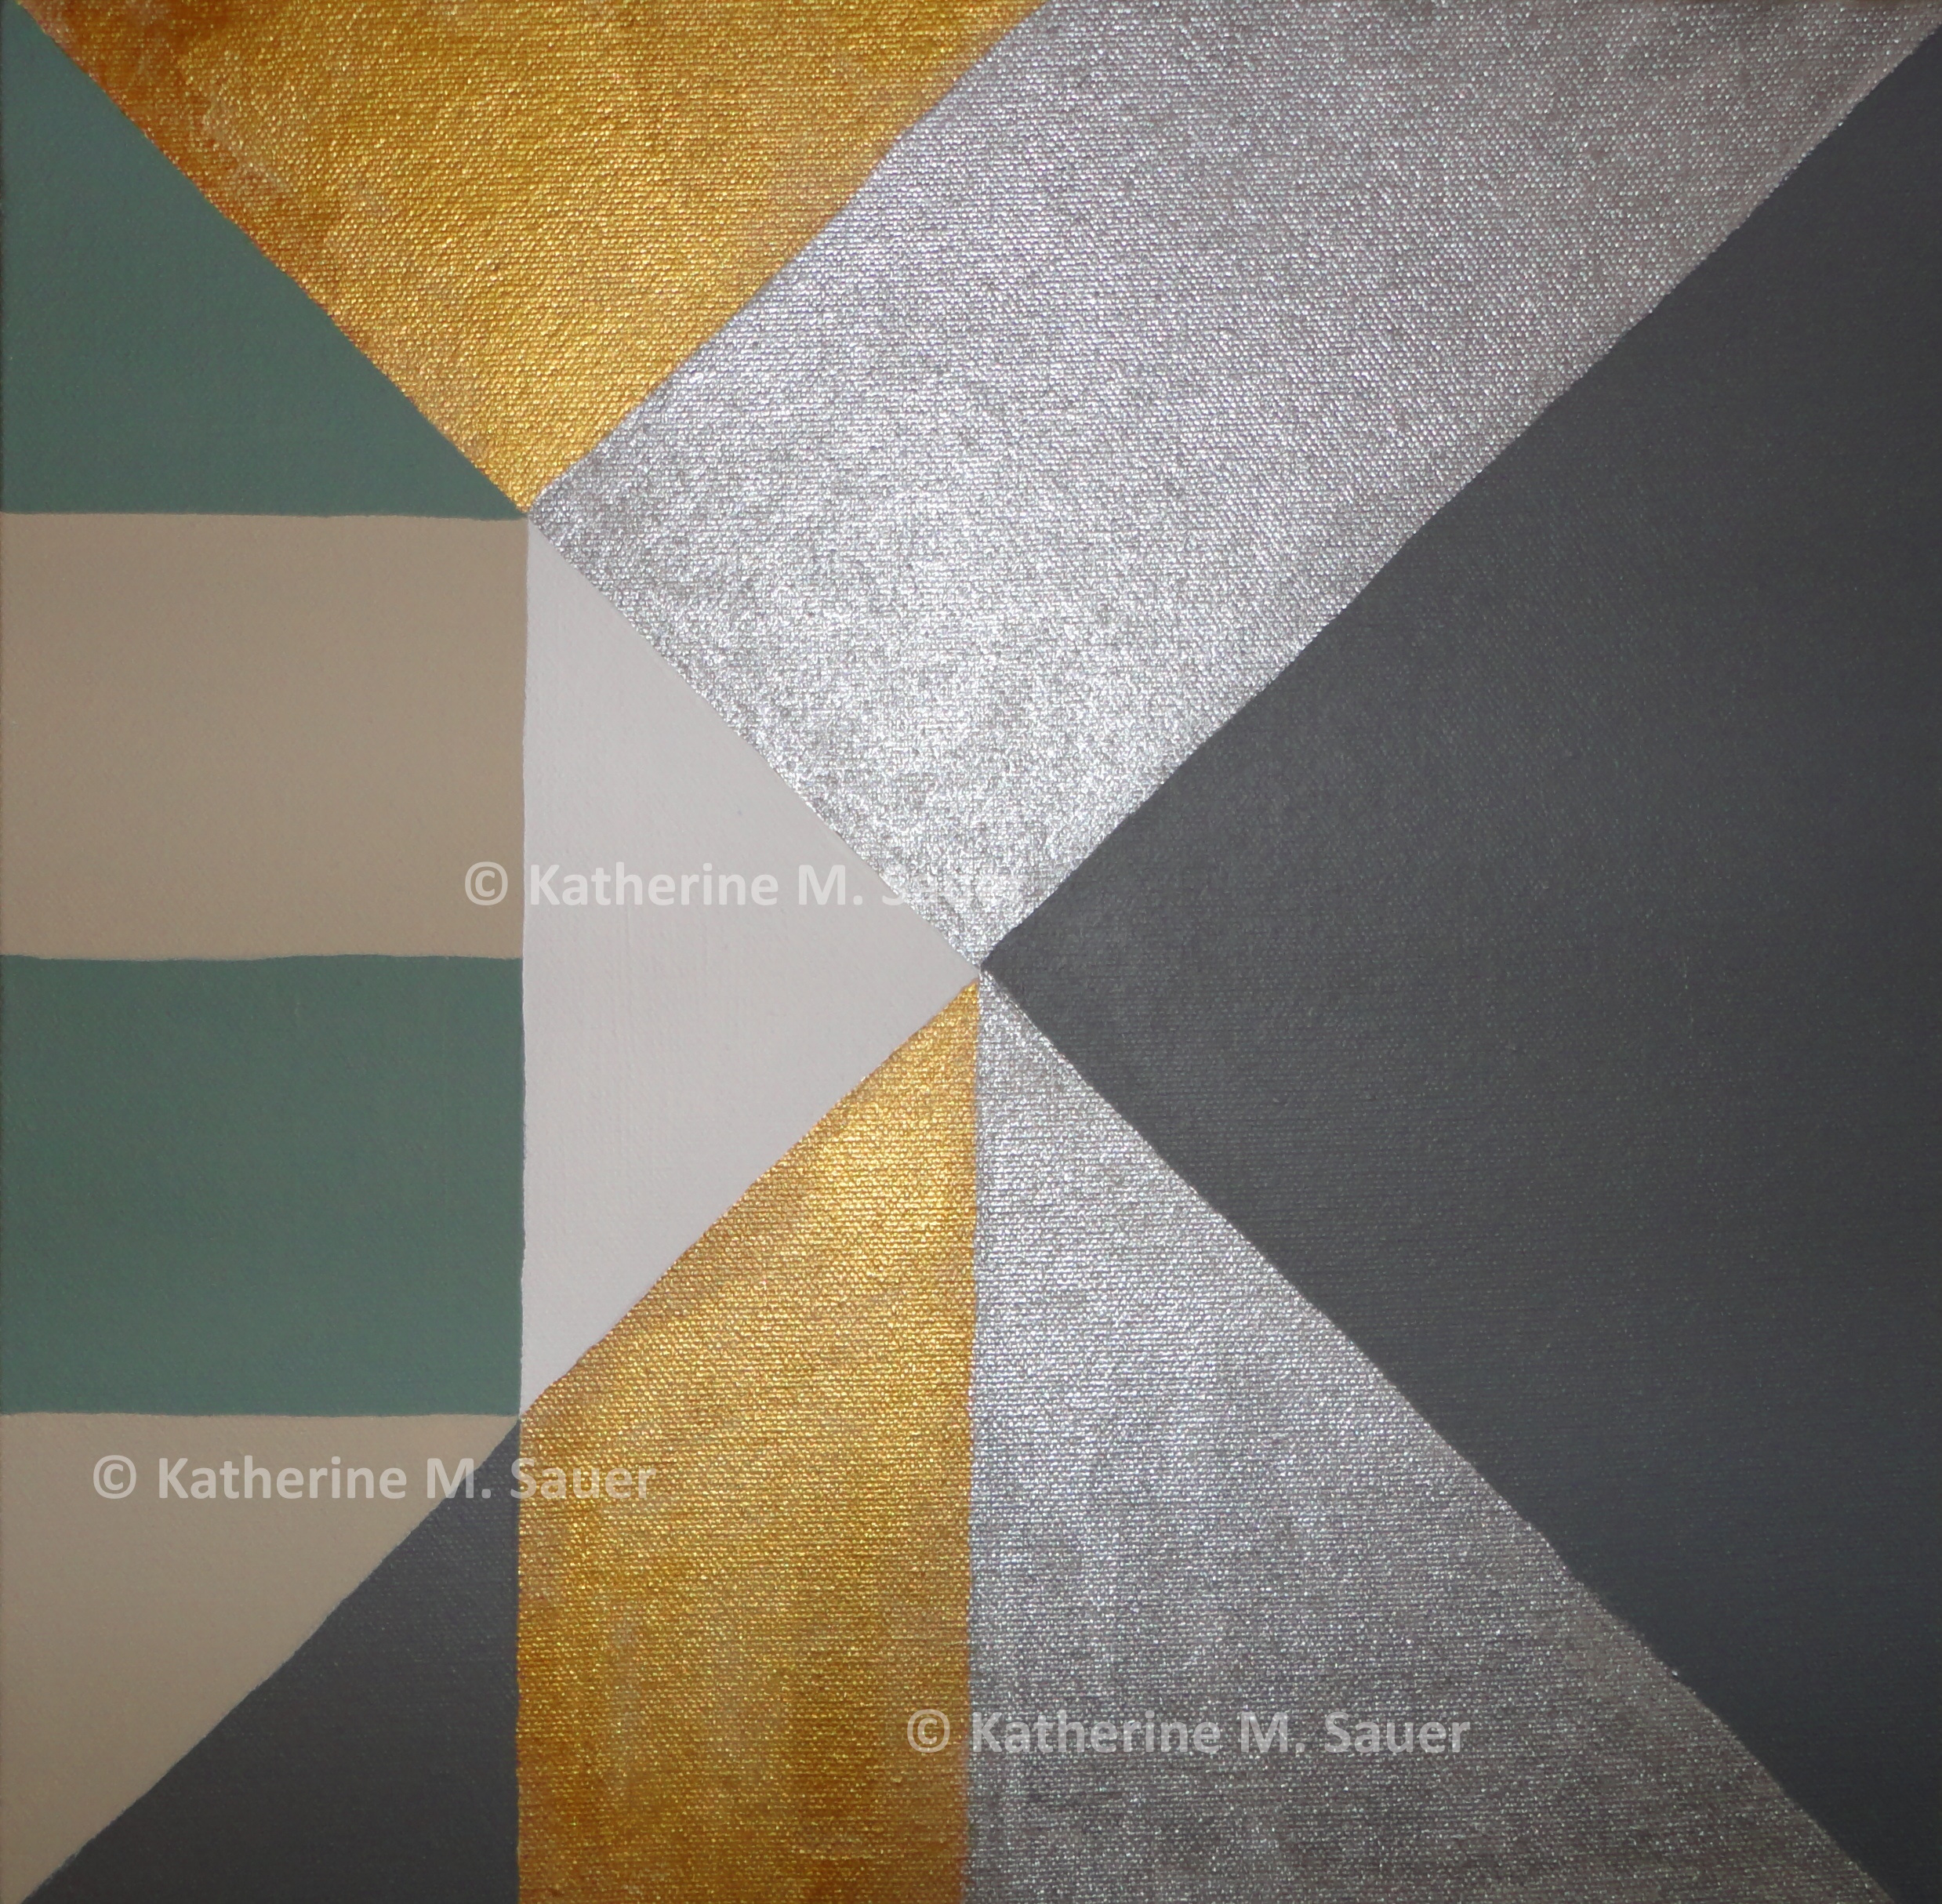
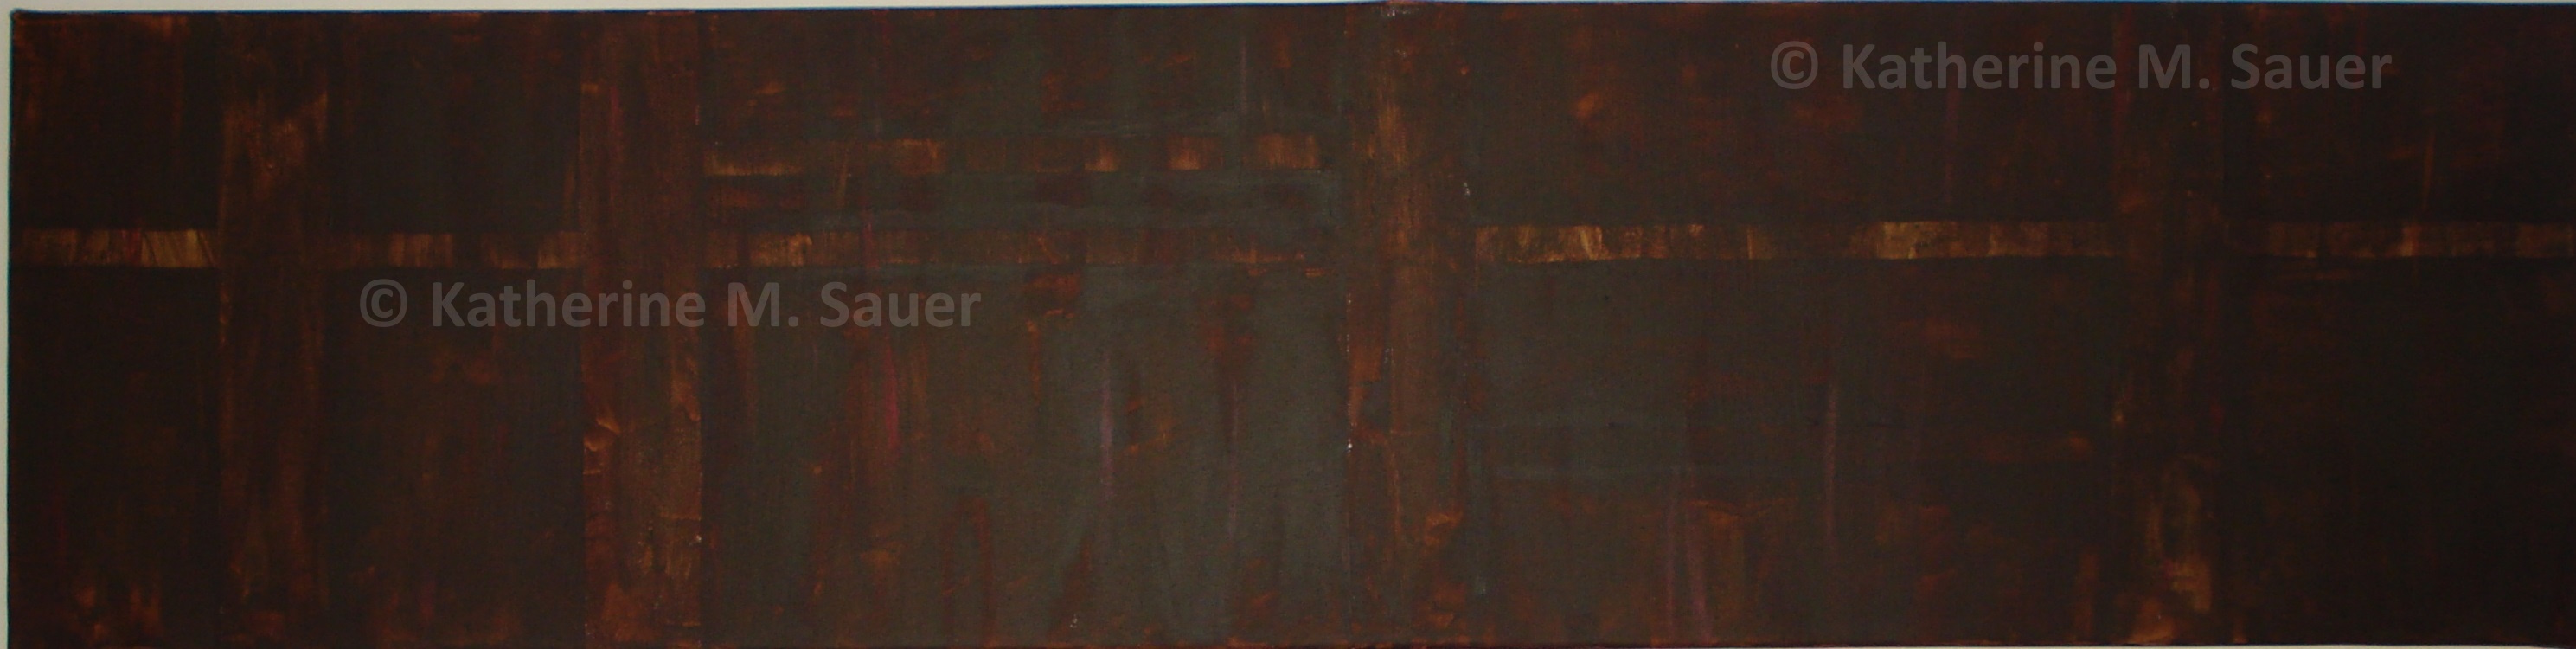
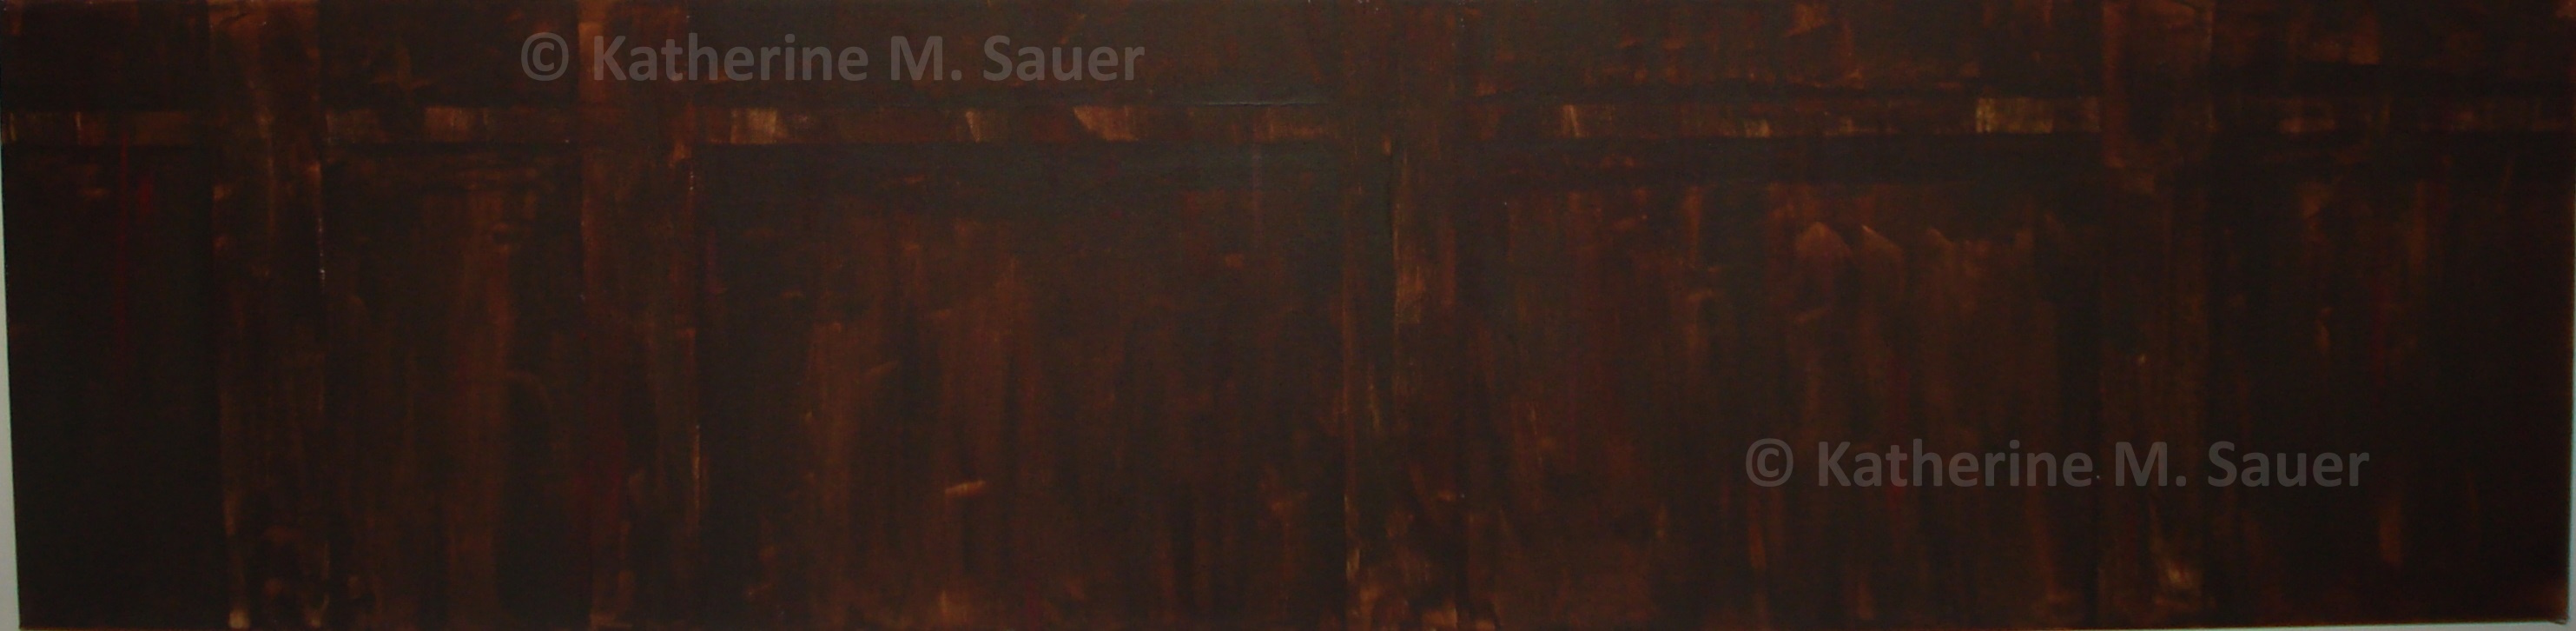
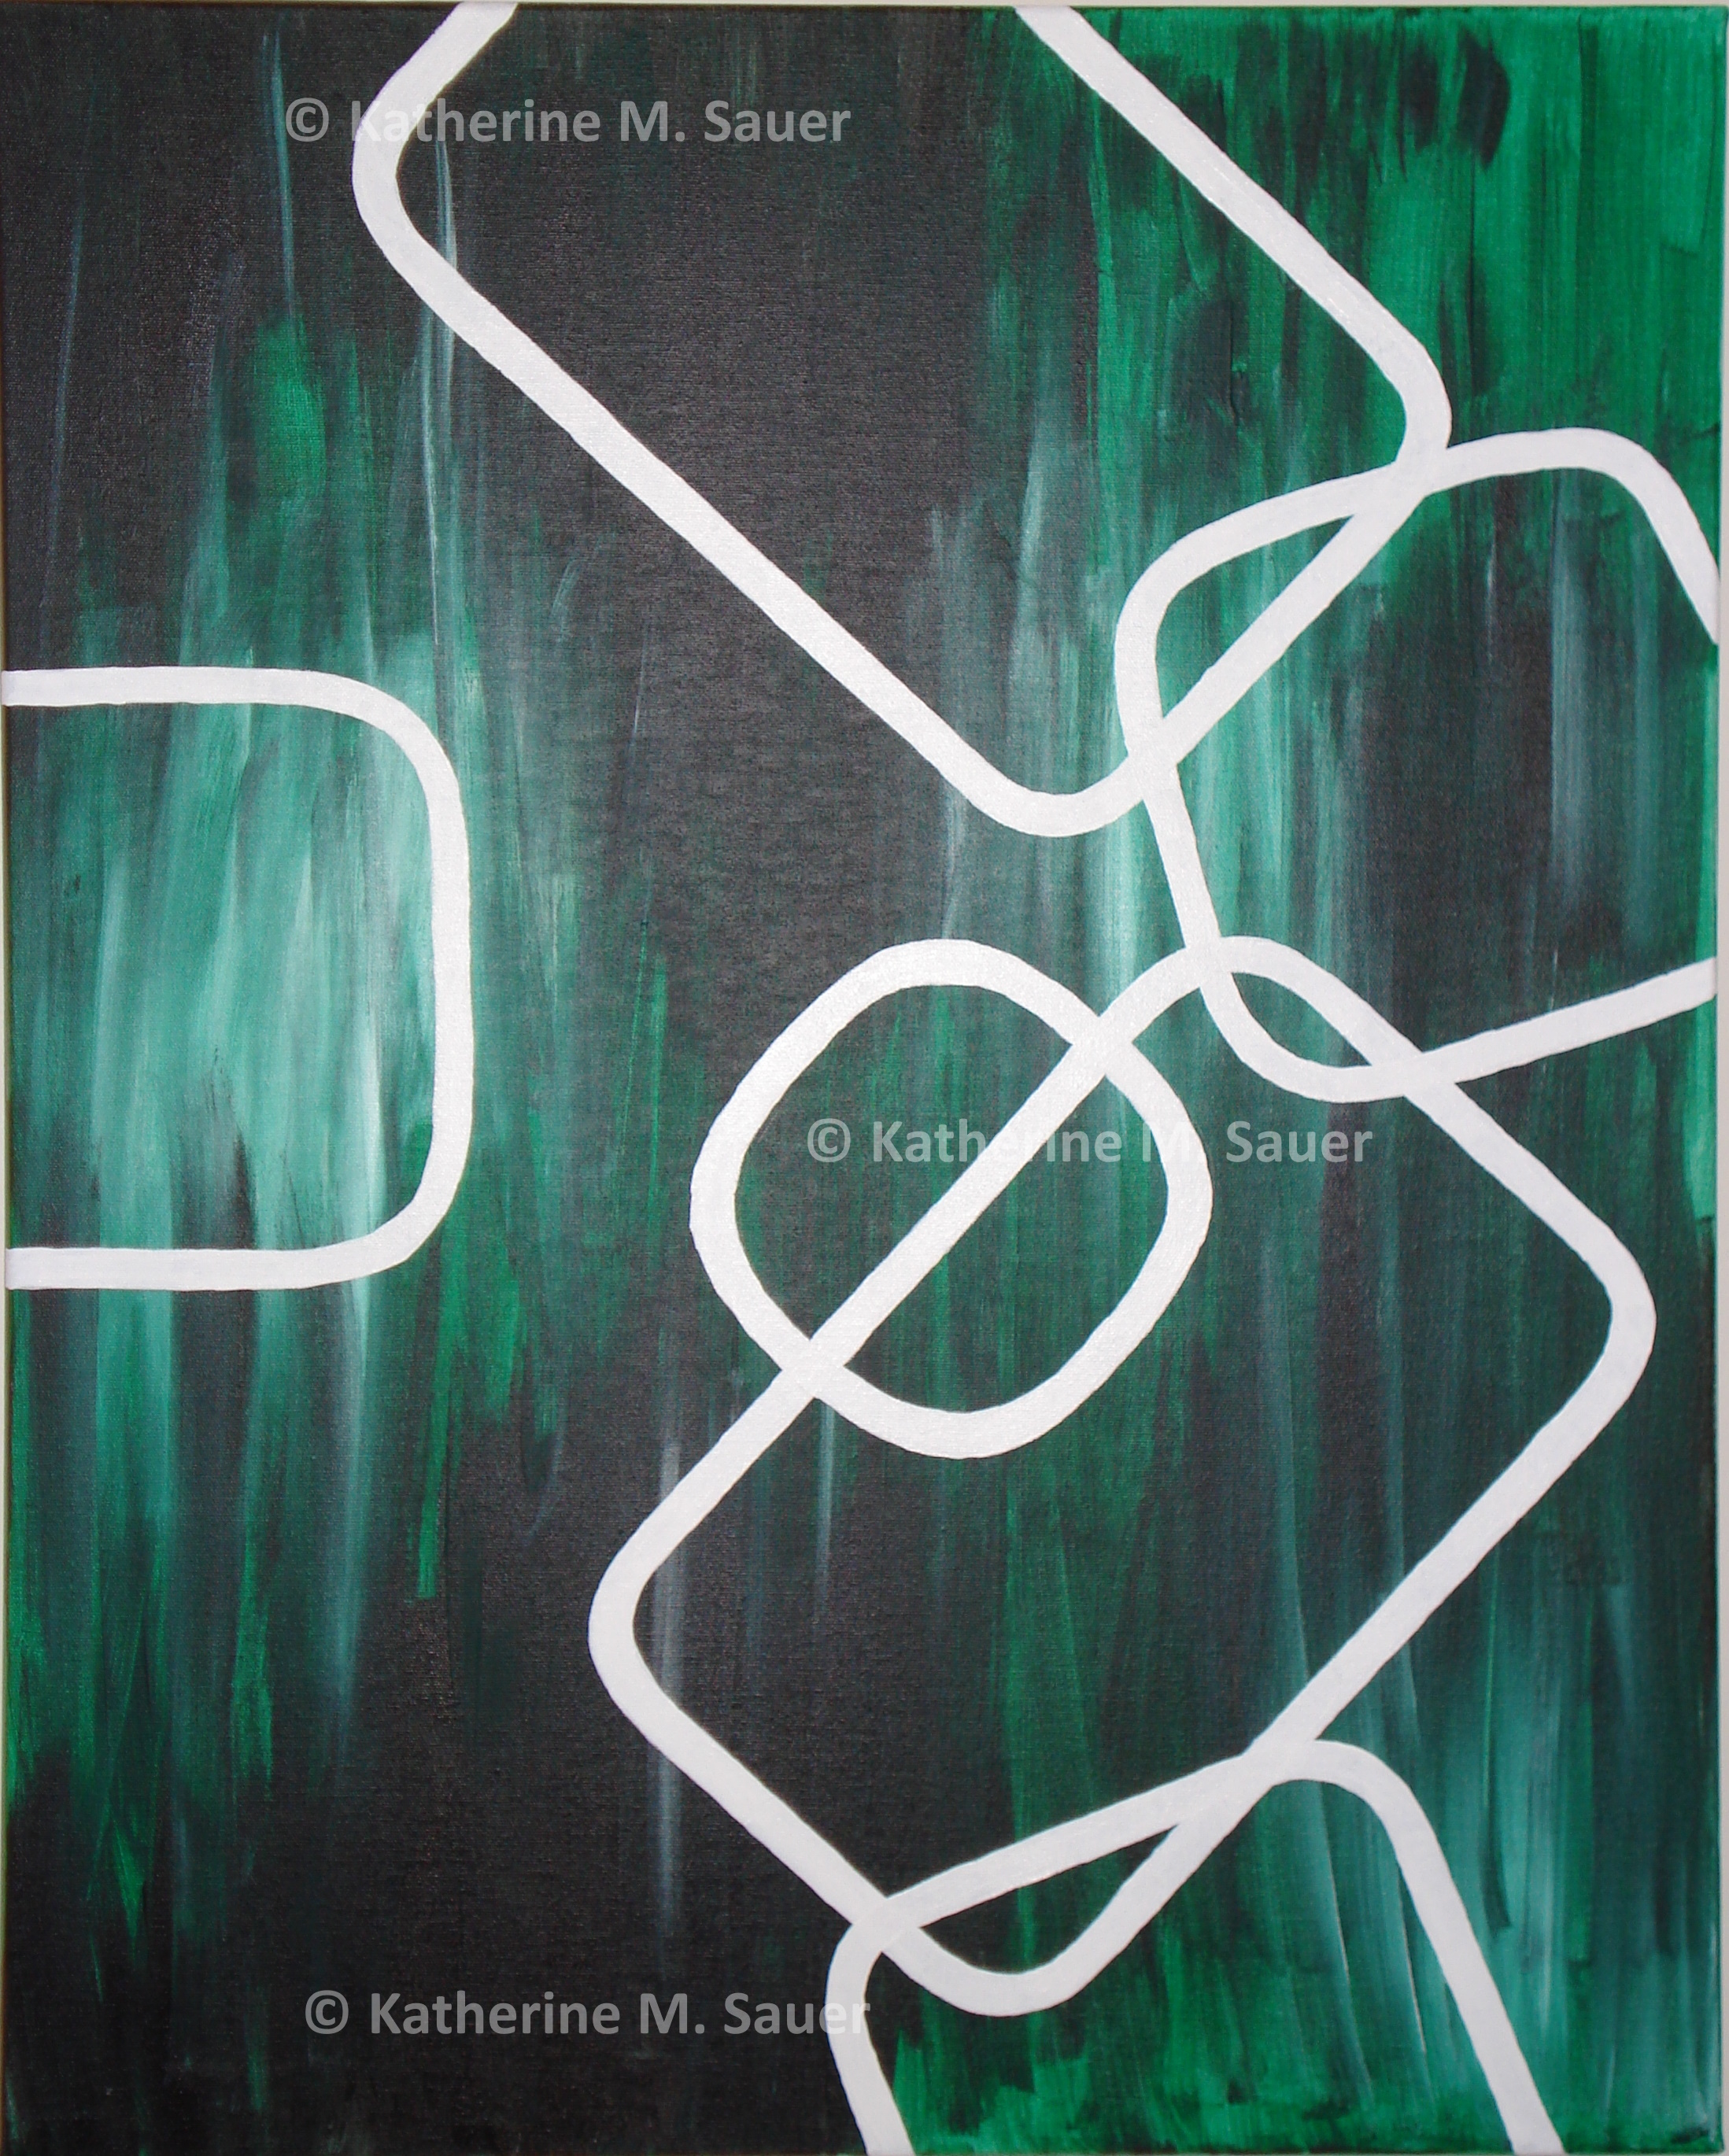
Status Symbols (2024)
paper, acrylic, and glass on canvas; 36″ x 24″

an artwork with two abstract figures

Growth (2022)
acrylic and tissue paper on canvas board; 16″ x 12″

a painting of round orange flowers on a teal background with the word 'growth' created using tissue paper

Inflation (2022)
acrylic and tissue paper on canvas board; 16″ x 12″

a painting of round pink flowers on a navy background with the word 'inflation' created using tissue paper

Employment (2022)
acrylic and tissue paper on canvas board; 16″ x 12″

a painting of star-like orange flowers on a blue background with the word 'employment' created using tissue paper

YCIGEXIM (2022)
acrylic and tissue paper on canvas; 12″ x 12″

a painting of geometric spaces in the letters YCIGEXIM, with outlines in white tissue paper

YCIGNX (2022)
acrylic and tissue paper on canvas board; 7″ x 5″

a painting of geometric spaces in the letters YCIGNX, with outlines in white tissue paper

GDP (2022)
acrylic and tissue paper on canvas board; 7″ x 5″

a painting of geometric spaces in the letters GDP, with accents in white tissue paper

ADAS I (2022)
acrylic, ribbon, and seed beads on canvas board; 7″ x 5″

a painting of geometric shapes, outlined in ribbon and seed beads

ADAS II (2022)
acrylic, ribbon, and seed beads on canvas board; 7″ x 5″

a painting of geometric shapes, outlined in ribbon and seed beads

ADAS III (2022)
acrylic, ribbon, and seed beads on canvas board; 7″ x 5″

a painting of geometric shapes, outlined in ribbon and seed beads

Big Data: FFR (2022)
paper mache, acrylic, and novelty jewels on canvas; 36″ x 12″

paper mache strips of The Economist magazine, black redacted areas, and pink jewels outlining the federal funds rate

Big Data: Growth (2022)
paper mache, acrylic, and novelty jewels on canvas; 12″ x 12″

paper mache strips of The Economist magazine, black redacted areas, and pink jewels depicting the GDP growth rate

Human (2022)
fabric, ribbon, acrylic, and ink on canvas; 12″ x 12″

Ransom note style lettering that reads 'Everyone deserves the opportunity to live a life where they can dynamically redirect their talents, skills, and abilities according to their changing circumstances and priorities'

Ransom (2022)
acrylic and paper on canvas; 24″ x 48″

paper mache strips of The Economist magazine, black redacted areas, and pink jewels depicting the GDP growth rate

Satellites (2021)
acrylic, ribbon, and glass beads on canvas; 48″ x 24″

a painting of a variety of sizes of circles decorated in yellow and blues with beads and ribbons

Indifference (2014)
acrylic on canvas; 16″ x 12″

a painting of a graph of indifference curves and a budget constraint

Insurance (2014)
acrylic on canvas; 16″ x 12″

a painting of a graph of expected utility with respect to insurance

Edgeworth Box (2013)
acrylic on canvas; 20″ x 16″

a painting of a diagonal line from SW to NE across the canvas, indifference curves tangent to each other, on a background of blues and greens

Profits (2012)
acrylic on canvas; 12″ x 12″

a painting of a graph of a monopolistically competitive firm making profits

Monopolist (2012)
acrylic on canvas; 12″ x 12″

a painting of a graph of a monopoly firm making profits

Sales Tax (2012)
acrylic on canvas; 12″ x 12″

a painting of a graph of sales tax

Tariff (2012)
acrylic on canvas; 12″ x 12″

a painting of a graph of tariffs

May (2012)
acrylic on canvas

a painting of a variety of sizes of circles decorated in bright colors

Adam Smith (2011)
oil pastel on paper; 8.5″ x 11″

a pastel portrait of economist Adam Smith

David Ricardo (2011)
oil pastel on paper; 8.5″ x 11″

a pastel portrait of economist David Ricardo

Perfect Competition (2011)
acrylic on canvas board: 16″ x 20″

a painting of a graph of a series of cost curves for a competitive firm, MR=MC

LRAC (2011)
acrylic on canvas; 36″ x 12″

a painting of a series of short run cost curves tracing out the long run average cost curve

Orange Geometric (2010)
acrylic on canvas; 20″ x 16″

a painting of circles and lines painted in gray, orange, and white

Panel I (2010)
acrylic on canvas; 36″ x 12″

a painting of brown tones

Panel II (2010)
acrylic on canvas; 36″ x 12″

a painting of brown tones

Flatirons (2010)
acrylic on canvas; 36″ x 12″

a painting of the Flatirons mountains outside of Boulder, CO

Black & White I (2008)
ink on paper; 11″ x 8.5″

a variety of lines and shapes in black ink on white paper

Black & White II (2008)
ink on paper; 11″ x 8.5″

a variety of lines and shapes in black ink on white paper

Black & White III (2008)
ink on paper; 11″ x 8.5″

a variety of lines and shapes in black ink on white paper

Black & White IV (2008)
ink on paper; 11″ x 8.5″

a variety of lines and shapes in black ink on white paper

Black & White V (2008)
ink on paper; 11″ x 8.5″

a variety of lines and shapes in black ink on white paper

Black & White VI (2008)
ink on paper; 11″ x 8.5″

a variety of lines and shapes in black ink on white paper

Disco (2006)
acrylic on canvas

a painting of a variety of geometric shapes and lines in pink, purple, black, white, and gray

Cherries (2006)
acrylic on canvas; 20″ x 16″

a painting of stylized cherries over a black and white checkered background

Labyrinth (2006)
acrylic on canvas; 20″ x 16″

a painting of a labyrinth in blue, brown, and white

RGB Circles (2006)
acrylic on canvas

a painting of white rings in a variety of sizes, over a background of red, black, and gray

RGB Lines (2006)
acrylic on canvas

a painting of white lines criss-crossing, over a background of blue, black, and gray

RGB Rectangles (2006)
acrylic on canvas

a painting of white rectangles, over a background of green, black, and gray