some geometric shapes, black paint over paper mache; text reads 'Proof of Concept. A pop-up art exhibition by Katie Sauer.

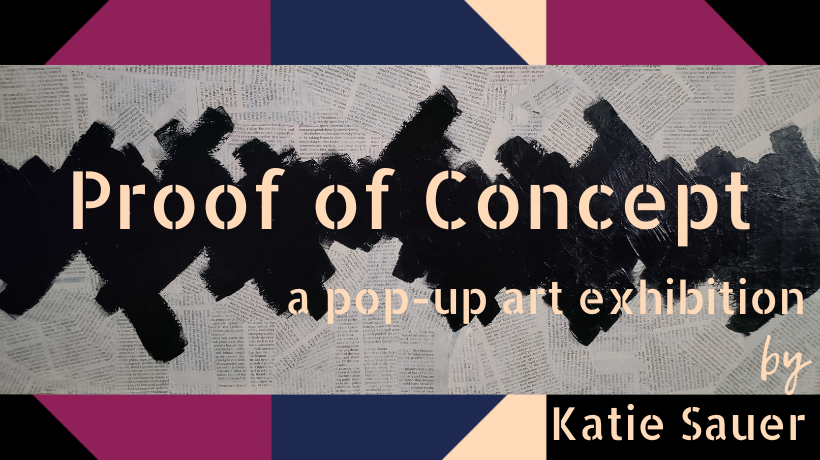
Proof of Concept, Katherine Sauer's debut show, was held in Broomfield, Colorado on 10.01.2022.

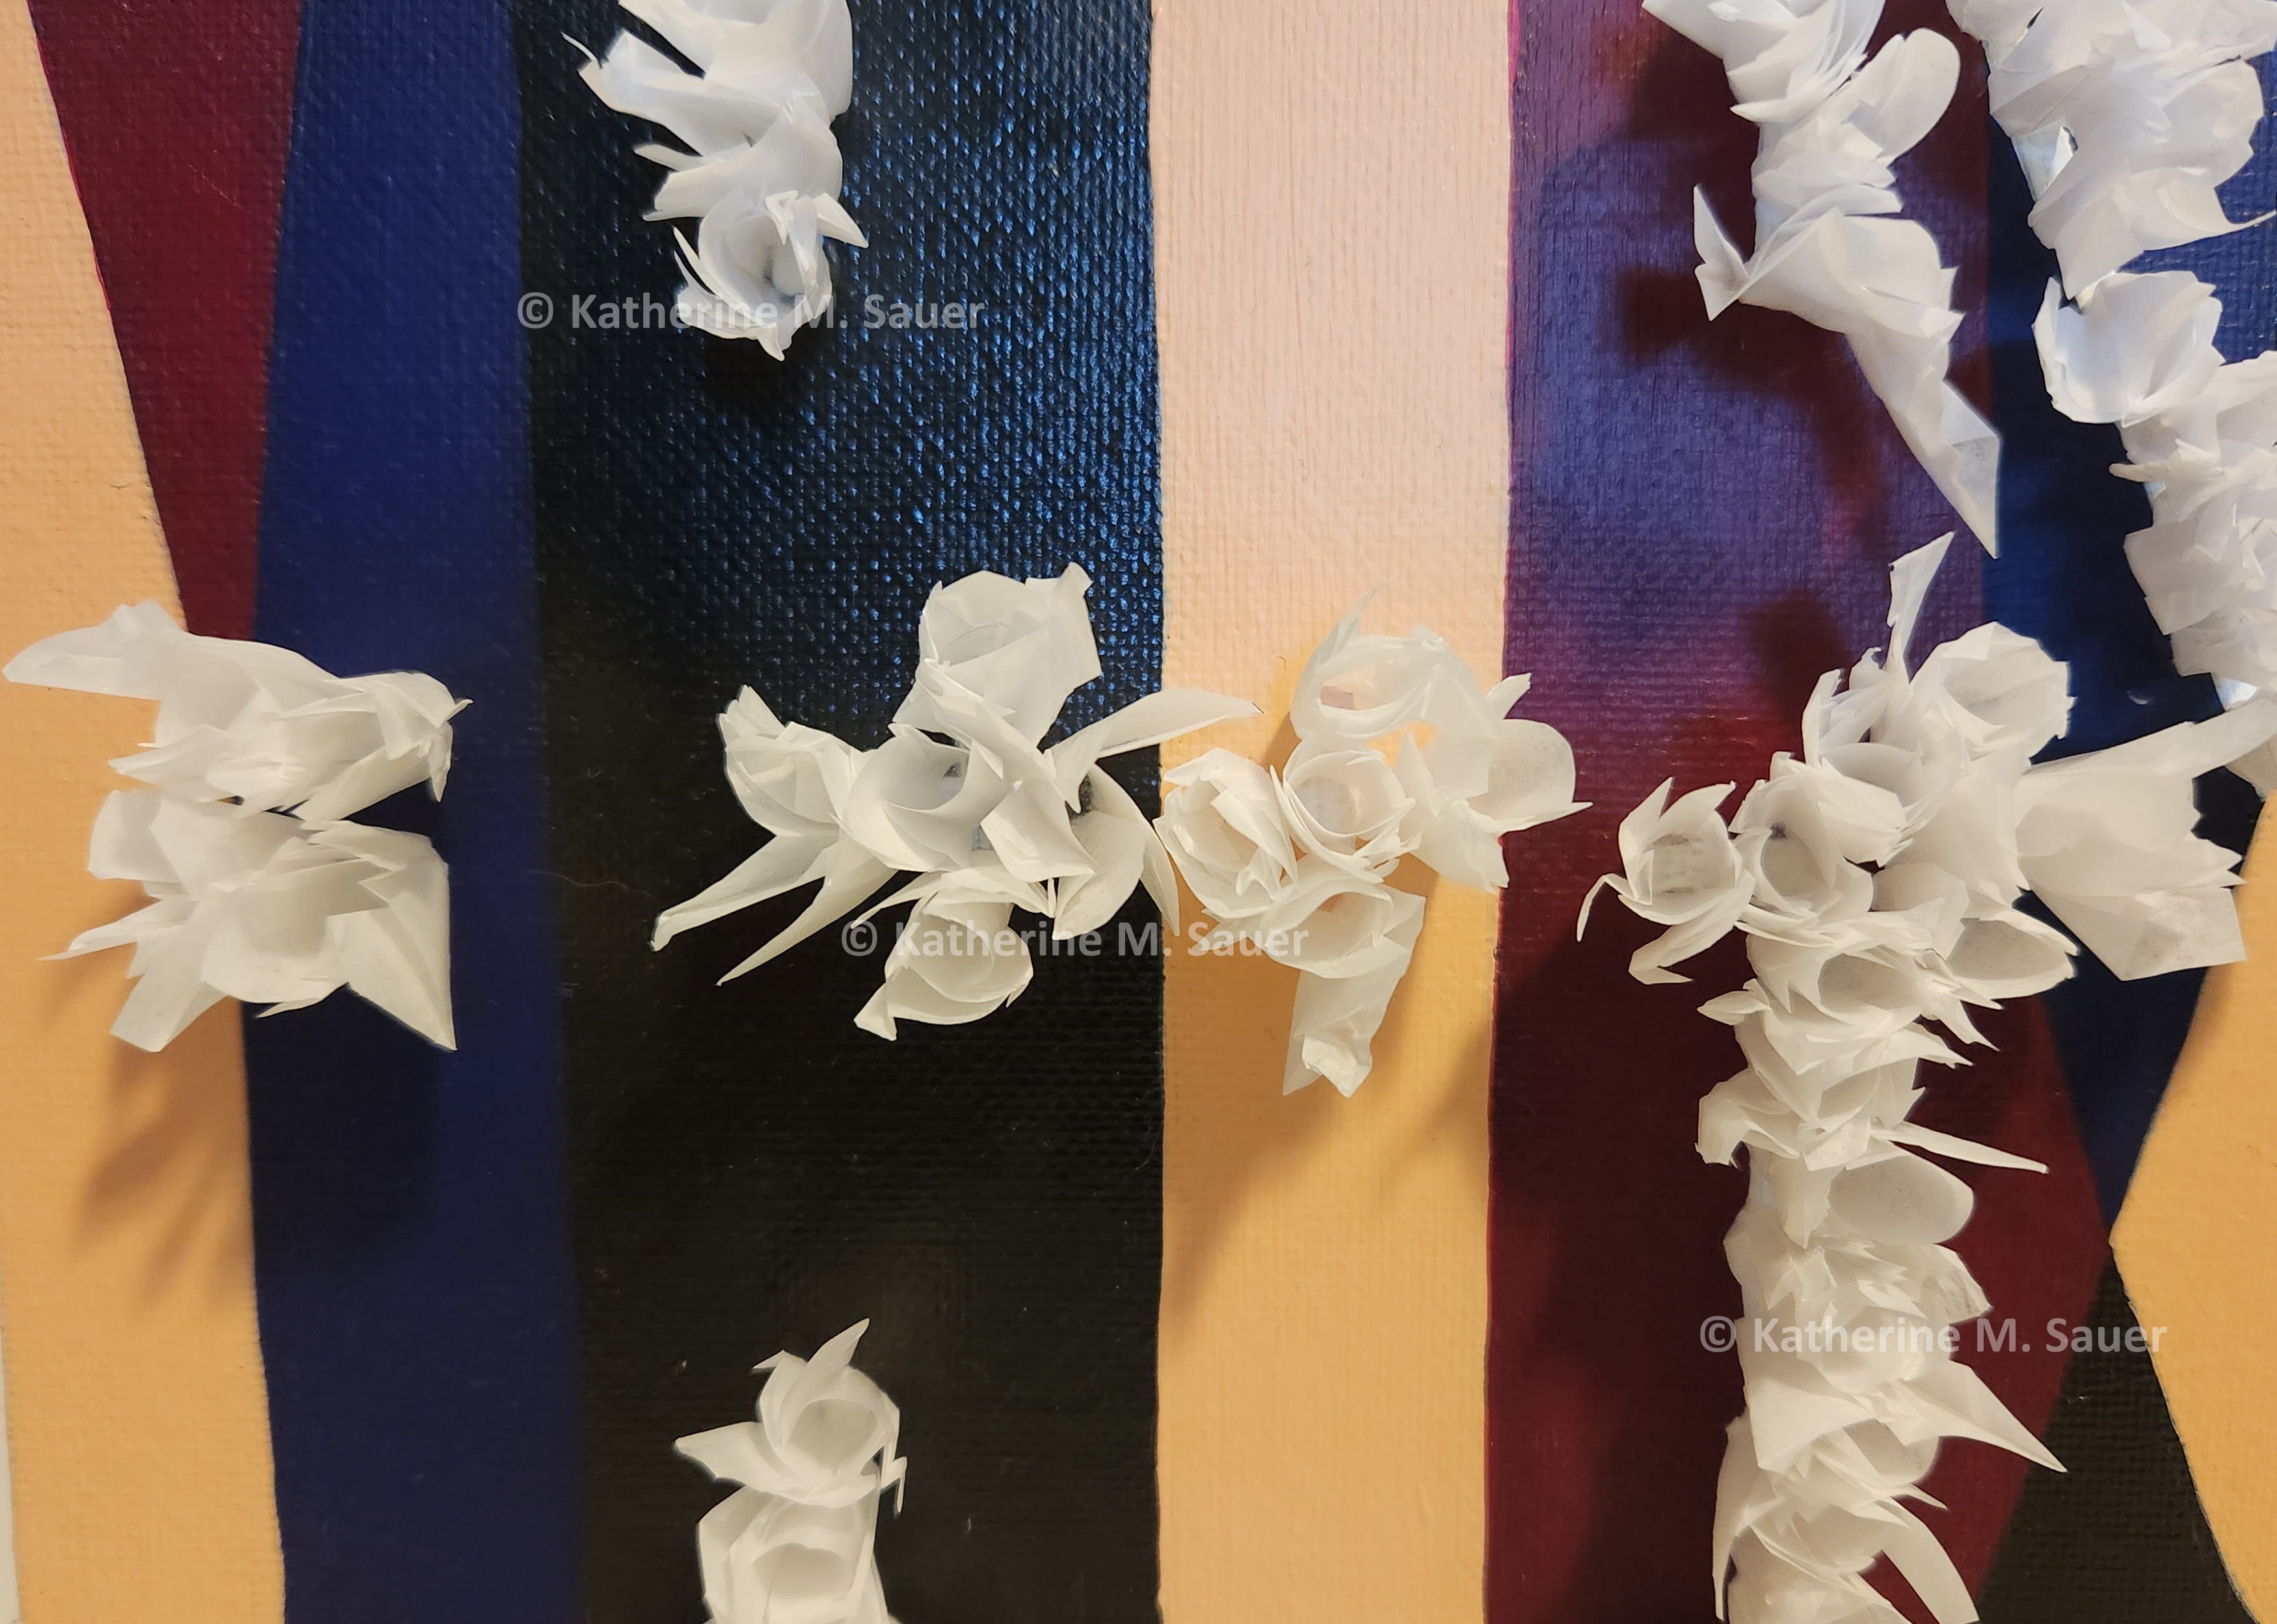
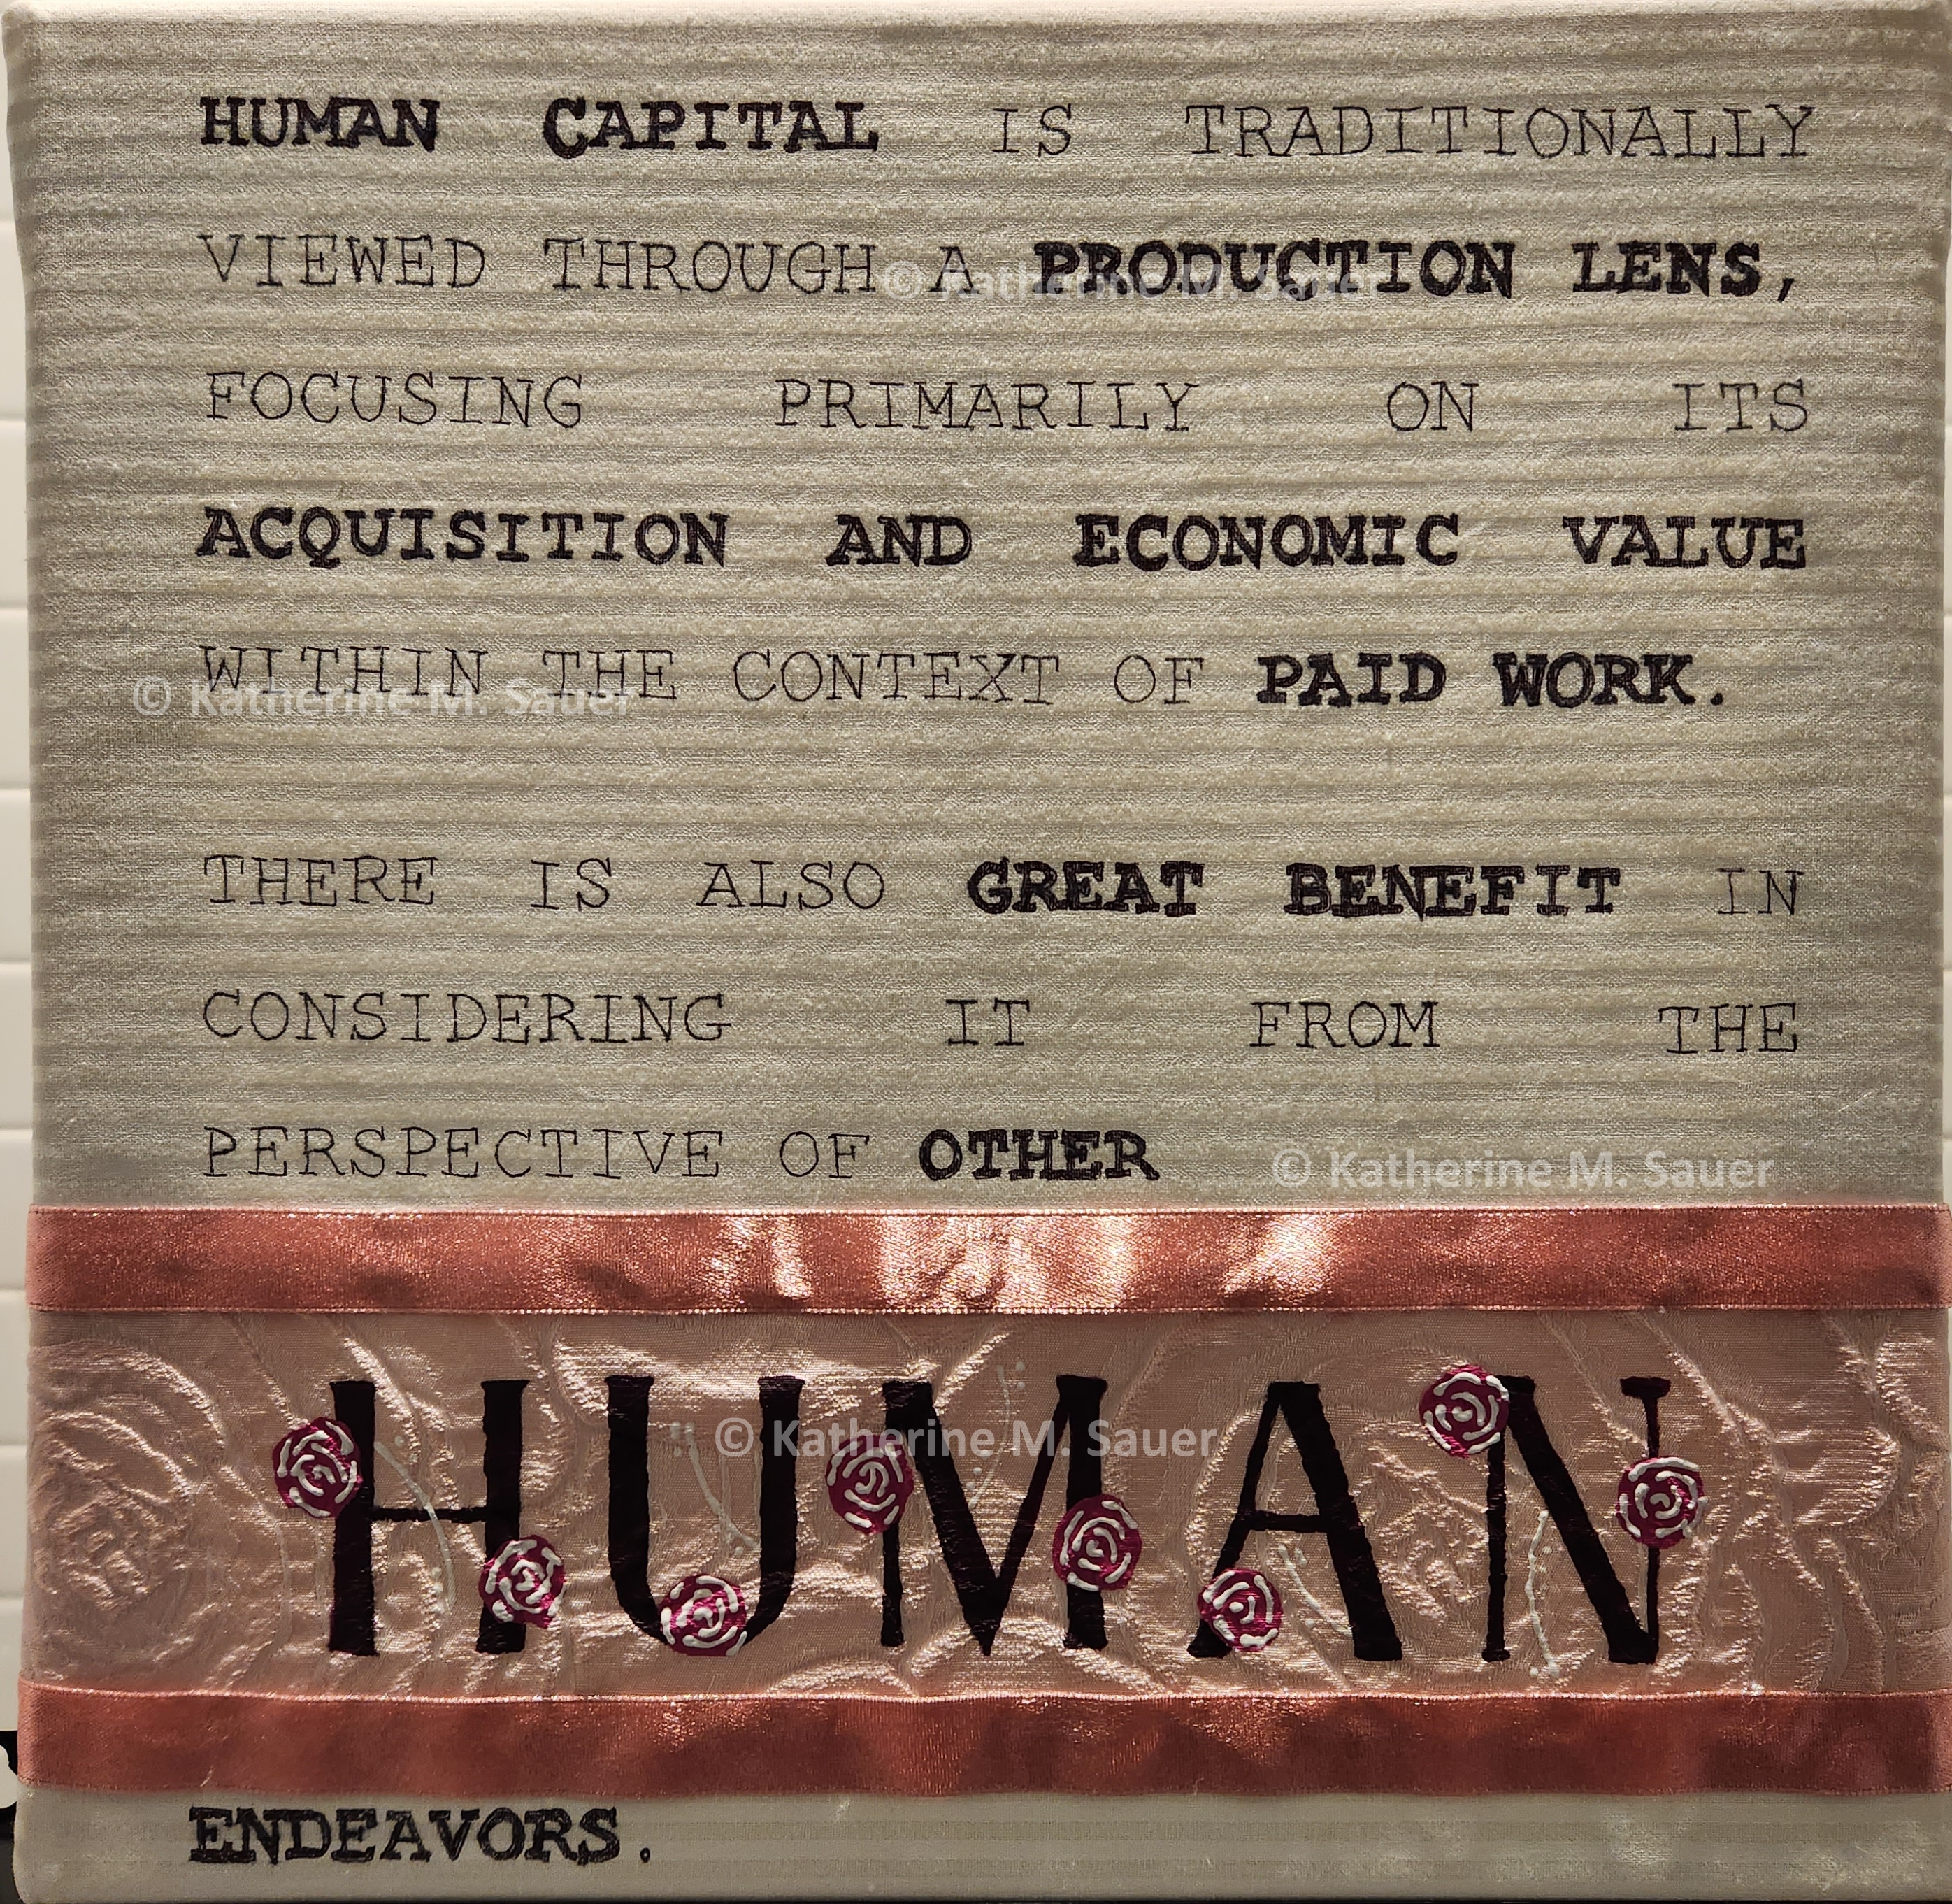
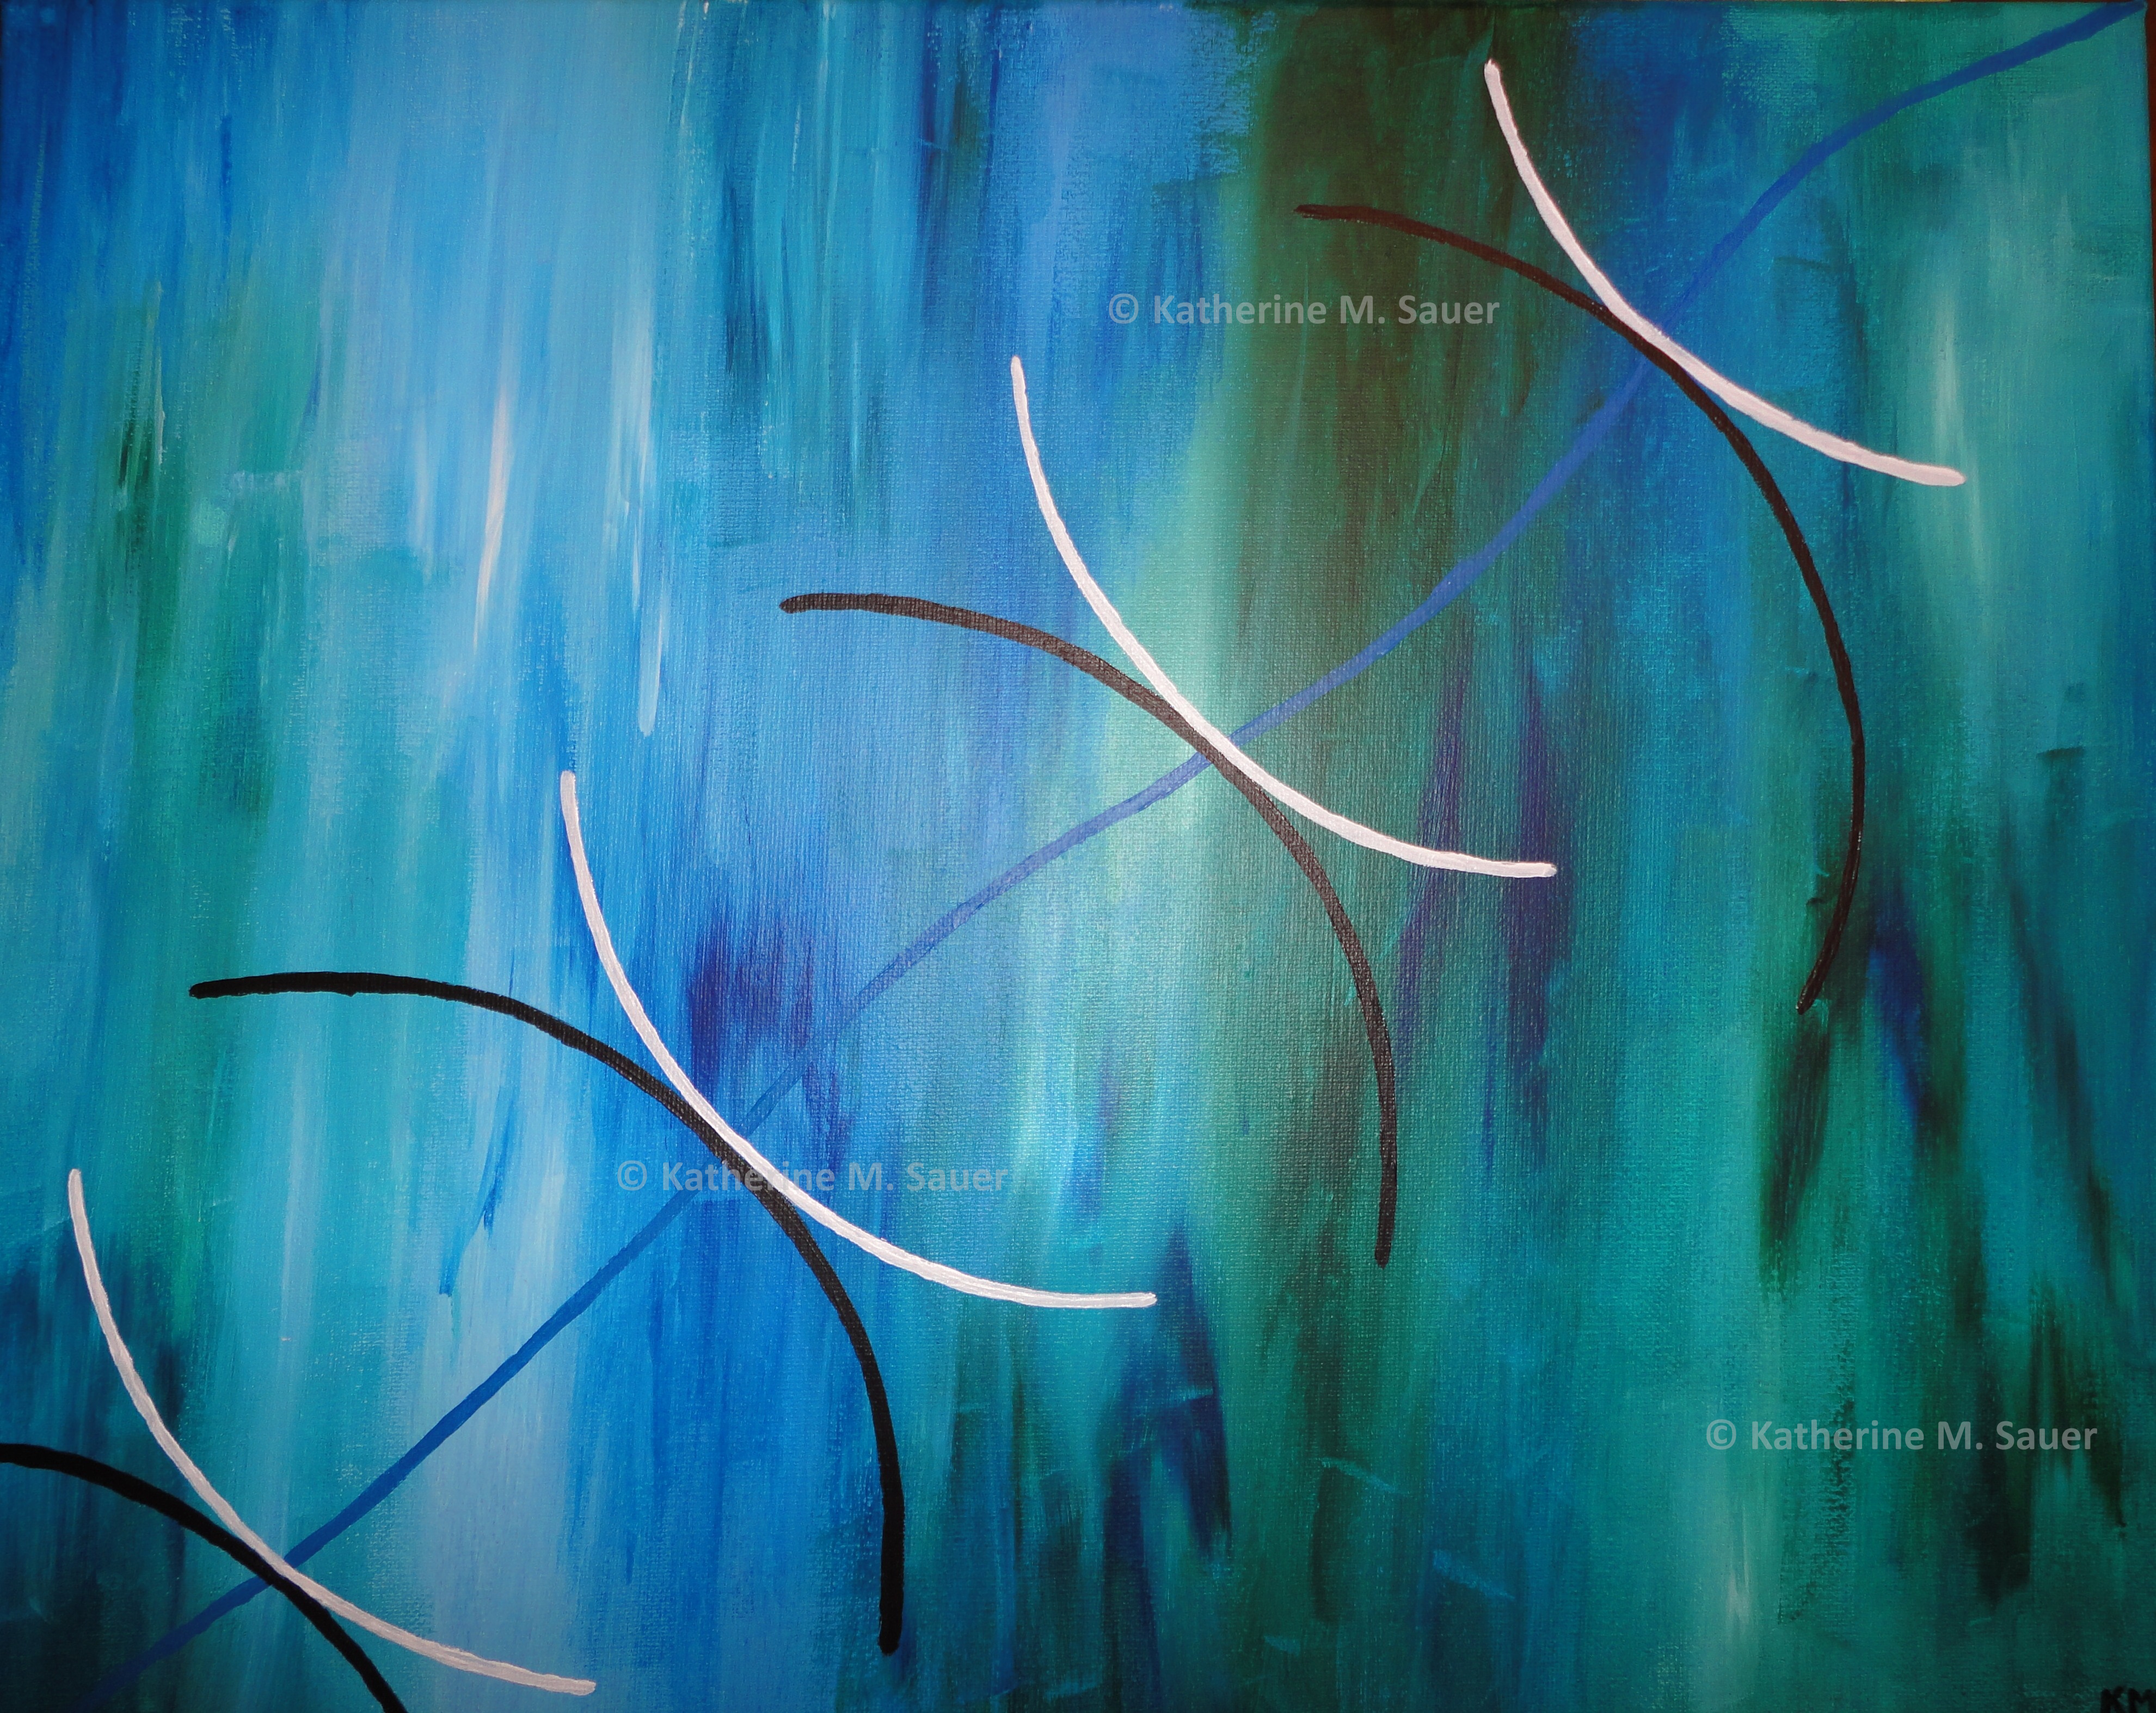
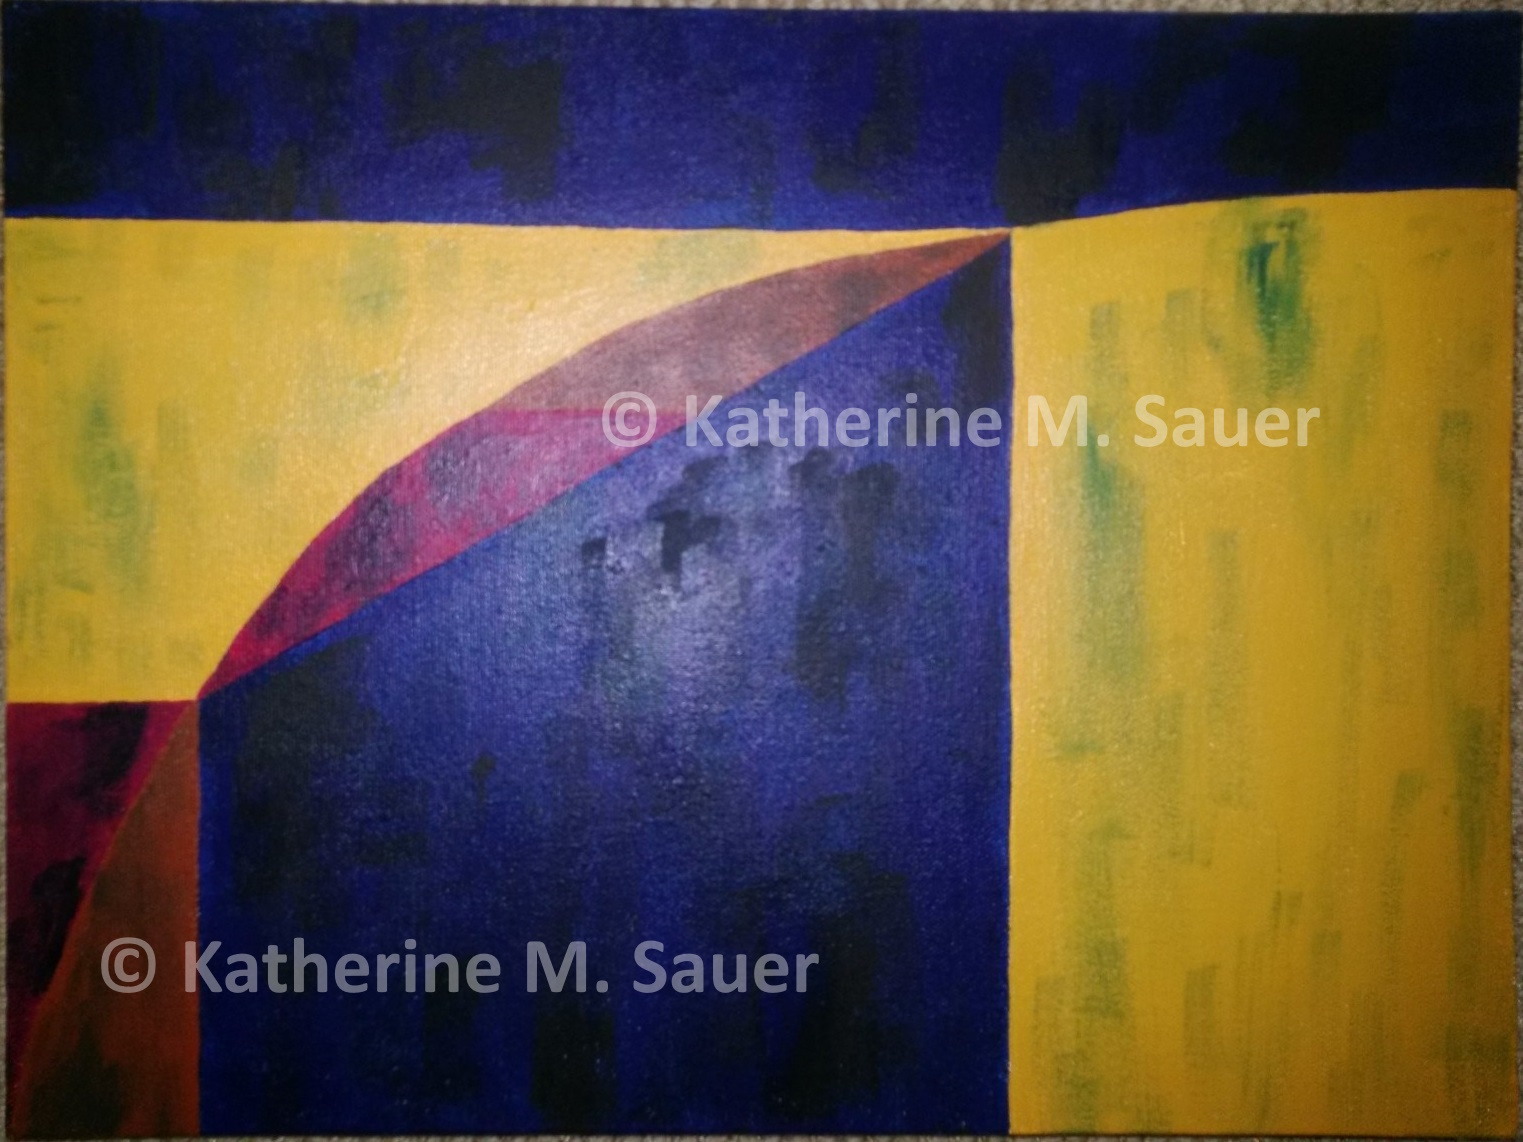
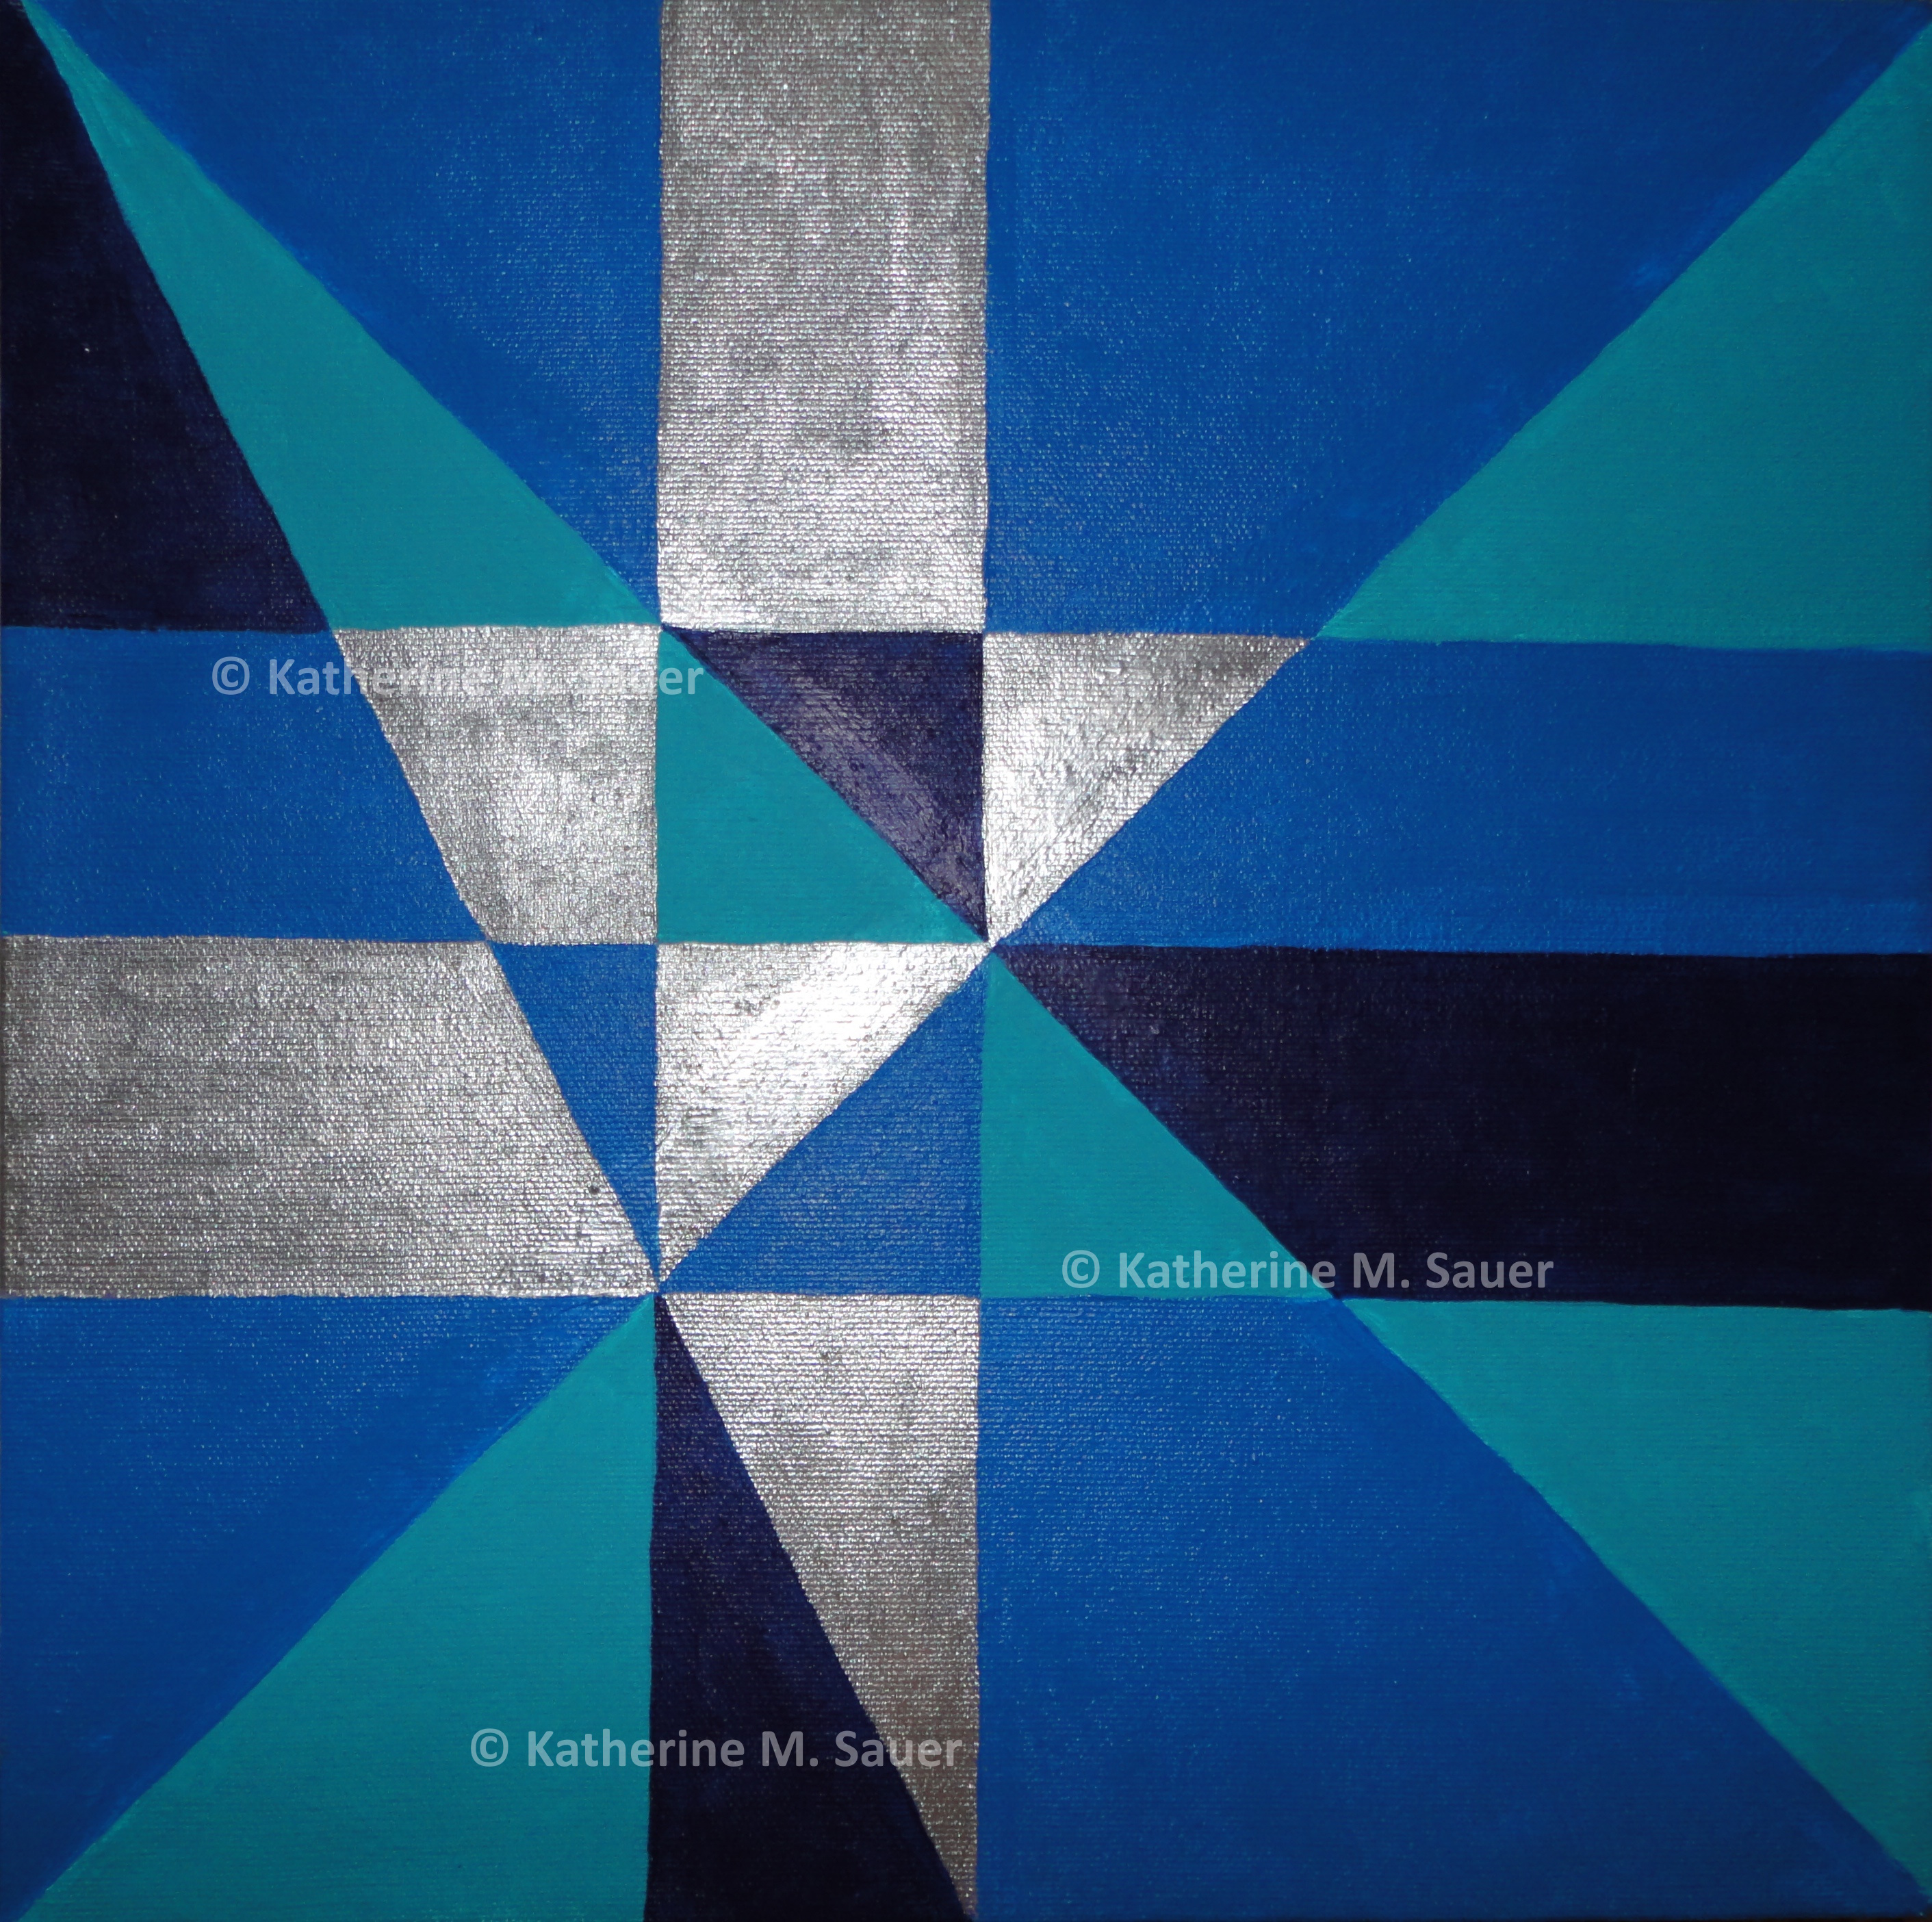
The pop-up exhibition was comprised of thirteen new pieces and six older works in the theme of fundamental concepts from the economics discipline. Early works focus on the beauty inherent in economics graphs while recent works juxtapose traditional economics with “feminine” treatments such as colors, ruffles, and home crafts.

The new pieces are divided into five mini-studies of two or three works each. A study is a collection of pieces where the artist explores a technique, material, subject, etc., sometimes in preparation for creating a single piece and sometimes becoming a series themselves.

Study: The Big 3

This study presents three major macroeconomic fundamentals – growth, inflation, and unemployment – in a floral motif. Each concept influences your daily life choices, sometimes being top of mind and sometimes fading into the background.

Growth (2022)
acrylic and tissue paper on canvas board; 16" x 12"

a painting of round orange flowers on a teal background with the word 'growth' created using tissue paper

Inflation (2022)
acrylic and tissue paper on canvas board; 16" x 12"

a painting of round pink flowers on a navy background with the word 'inflation' created using tissue paper

Employment (2022)
acrylic and tissue paper on canvas board; 16" x 12"

a painting of star-like orange flowers on a blue background with the word 'employment' created using tissue paper

Study: GDP

Gross Domestic Product is a way to measure the size of the economy, as measured by a dollar value.

It is measured as the sum of its components: Consumption (what consumers spend), Investment (business investment and inventories and new homes), Government (spending by all levels of government), and Net Exports (EXports minus IMports, capturing the value of what is sold abroad minus what we buy from abroad). For short, Gross Domestic Product is often represented by GDP or by Y.

This study explores the beauty inherent in the shapes of the letters themselves.

YCIGEXIM (2022)
acrylic and tissue paper on canvas; 12" x 12"

a painting of geometric spaces in the letters YCIGEXIM, with outlines in white tissue paper

YCIGNX (2022)
acrylic and tissue paper on canvas board; 7" x 5"

a painting of geometric spaces in the letters YCIGNX, with outlines in white tissue paper

GDP (2022)
acrylic and tissue paper on canvas board; 7" x 5"

a painting of geometric spaces in the letters GDP, with accents in white tissue paper

Study: Aggregate Demand and Supply

The dynamics of economy-wide consumption and production changes are depicted in this study: 1) low inflation with positive growth 2) a contraction with significant inflation 3) tolerable inflation with positive growth.

Embellishments with ribbon and beads, along with the color palette, are meant to evoke the skilled craftswork that goes into a handmade quilt – though beautiful home crafts are not counted in the value of the economy.

ADAS I (2022)
acrylic, ribbon, and seed beads on canvas board; 7" x 5"

a painting of geometric shapes, outlined in ribbon and seed beads

ADAS II (2022)
acrylic, ribbon, and seed beads on canvas board; 7" x 5"

a painting of geometric shapes, outlined in ribbon and seed beads

ADAS III (2022)
acrylic, ribbon, and seed beads on canvas board; 7" x 5"

aa painting of geometric shapes, outlined in ribbon and seed beads

Study: Data

These pieces reflect the abundance of economic data published daily, and the clandestine-esque embargos on premature release.

The horizontal piece shows the federal funds rate target, by month, from 1-1-00 through 9-1-22.

Annual Real GDP growth for 2000 through 2021 is depicted in the square piece.

Each work is unfinished, leaving room for the final 2022 data to be incorporated.

Big Data: FFR (2022)
paper mache, acrylic, and novelty jewels on canvas; 36" x 12"

paper mache strips of The Economist magazine, black redacted areas, and pink jewels outlining the federal funds rate

Big Data: Growth (2022)
paper mache, acrylic, and novelty jewels on canvas; 12" x 12"

paper mache strips of The Economist magazine, black redacted areas, and pink jewels depicting the GDP growth rate

Study: Unleashing Human Capital

"Ransom" highlights the sentiment that many workers feel they are stuck in their jobs but can’t make a change due to necessities like health insurance. Additionally, much important human work is unpaid (e.g., caregiving, emotional labor, volunteering) and falls to women to do.

"Human" offers an expansive take on the concept of human capital. Imperfect lettering in courier new font style over fabric reminiscent of tractor feed paper contrasts with feminine and handicraft style emphasis of the word “human”.

Ransom (2022)
acrylic and paper on canvas; 24" x 48"

Ransom note style lettering that reads 'Everyone deserves the opportunity to live a life where they can dynamically redirect their talents, skills, and abilities according to their changing circumstances and priorities'

Human (2022)
fabric, ribbon, acrylic, and ink on canvas; 12" x 12"

hand lettering in the style of computer font that reads 'Human capital is traditionally viewed through a production lens, focusing primarily on its acquisition and economic value within the context of paid work. There is also great benefit in considering it from the perspective of other human endeavors'. There is emphasis on the word 'human' and it is offset by ribbon and floral fabric.

Earlier Works Included in the Exhibition

Edgeworth Box (2013)
acrylic on canvas; 20" x 16"

An Edgeworth box is used to analyze potential trades between two people. The contract curve and indifference curves are visible.

a painting of a diagonal line from SW to NE across the canvas, indifference curves tangent to each other, on a background of blues and greens

Insurance (2014)
acrylic on canvas; 16" x 12"

The marginal gains from insurance depend on the horizontal difference between expected utility and the utility under certainty.

a painting of a graph of expected utility with respect to insurance

Monopolist (2012)
acrylic on canvas; 12" x 12"

A single producer enjoys the price markup over the intersection of marginal revenue and marginal cost.

a painting of a graph of a monopoly firm making profits

Sales Tax (2012)
acrylic on canvas; 12" x 12

A sales tax raises the price for consumers, lowers the take-home price for sellers, and causes deadweight loss.

 a painting of a graph of sales tax

Tariff (2012)
acrylic on canvas; 12" x 12"

Tariffs raise the domestic price above the prevailing price in the world market. They benefit or harm different parties unequally and cause overall deadweight loss.

 a painting ofa graph of tariffs

Profits (2012)
acrylic on canvas; 12" x 12

A firm earning short run profits as shown by the area between the price and production cost.

a painting of a graph of a monopolistically competitive firm making profits